改裝 2080 Ti 22G · part 15
[Benchmark] Dual-GPU AllReduce Only Uses 8% of PCIe Gen3 x16 — It Moves Little, Very Often
❯ cat --toc
- The one command that measures this, and the one flag people skip
- The bridge looks healthy, but GeForce doesn't expose its traffic counters
- The `internal` AllReduce backend stages every reduction through pinned host memory
- Four arms, because a single number can't isolate AllReduce
- Across all four arms, PCIe never gets past 8% of the Gen3 x16 ceiling
- The real production config tops out at 8.2% of the bus
- Prefill is 11% faster on layer split than on tensor split
- What limits dual-card decode is round trips, not bytes
- Advanced: the measurement rig, and the three traps in it
- The full four-arm config
- Trap 1: `--fit` is on by default, and `-sm tensor` ignores it
- Trap 2: `--help` still lists `-sm row`, but the code is gone
- Trap 3: the median threw away the bursts
- How thin the decode sampling really is
- Full data, all four arms
- The NVLink counters these cards don't report
- Quiescing: verify the baseline is zero, don't assume it
- Takeaways
TL;DR
Two modded 22GB 2080 Tis running Qwen3.8-27B under llama.cpp's -sm tensor, on the GGML_CUDA_ALLREDUCE=internal backend. In the production config — 262K context, MTP, 54.9 tok/s — PCIe peaks at 8.2% of the Gen3 x16 bus. A four-arm control run puts the net AllReduce cost at 67 MB/s per card at decode, 973 MB/s at prefill. This backend stages every reduction through pinned host memory, which is why PCIe carries it and the NVLink bridge doesn't. Scope: llama.cpp has more than one AllReduce implementation, and these numbers describe only this one.
Two people assemble one machine in separate rooms. There is a hatch in the wall between them, and normally they pass parts straight through it. The hatch jams. So they fall back on the old procedure: every step, each walks out, puts their half on a table in the hallway, waits for the other to do the same, carries the combined result back. The hatch is still there. It is still, in principle, the fast way. It just isn't the way anything is moving today.
This is Part 15 of the modded-2080-Ti series. Part 14 got two 22GB cards to 59.632 tok/s on Qwen3.8-27B with llama.cpp tensor parallel plus MTP, up from 37.1 on one card. A reader emailed after it went up with a specific request: re-run the benchmarks with nvidia-smi dmon -s t open in another terminal, and show how much PCIe bandwidth the AllReduce actually eats.
My first reaction was that it probably couldn't be measured. There is an NVLink bridge between those two cards, so I assumed the AllReduce rode NVLink and the PCIe counters would sit near zero. That assumption was wrong on this box, and finding out why turned out to be the more interesting half of the article.
The one command that measures this, and the one flag people skip
nvidia-smi dmon is the device monitor: one line per GPU per interval, one second by default. -s picks which metric group you get.
| group | what it prints |
|---|---|
p | power and temperature |
u | utilization |
m | framebuffer and BAR1 memory |
e | ECC errors and PCIe replay errors |
t | PCIe throughput — rxpci and txpci, in MB/s |
t is the one that answers this question. The full command I used:
nvidia-smi dmon -s t -i 0,1 -d 1 -o T
-i 0,1 picks the two cards. -d 1 is the one-second interval. -o T adds a timestamp column, and that is the flag worth arguing about. Without timestamps you cannot align the samples to the start and end of your own request, which means you cannot separate your traffic from whatever else is touching those GPUs. I found that out the hard way; see the quiescing section in the second half.
The whole thing is read-only. It does not slow the benchmark down.
The bridge looks healthy, but GeForce doesn't expose its traffic counters
Here is why I thought this was a dead end. The bridge reports itself as present and healthy:
GPU 0: Link 0: 25.781 GB/s, Link 1: 25.781 GB/s
GPU 1: Link 0: 25.781 GB/s, Link 1: 25.781 GB/s
The topology matrix agrees, showing NV2 between GPU0 and GPU1. So my model was: the reduction rides NVLink, PCIe stays quiet, and the counters I was being asked to read would show nothing.
The NVLink side can't be read anyway. Ask for its data counters and you get:
Data Tx: N/A
Data Rx: N/A
Same on all three cards in the box. There is no clean product-family rule to quote here — NVIDIA documents these counters per device, and a workstation card like the RTX A6000 does return real Tx/Rx values. What I can say is what I measured: on these 2080 Tis, nothing. So: invisible on PCIe, unreadable on NVLink. Both windows dark. That was where I stopped guessing and went to read the source.
The internal AllReduce backend stages every reduction through pinned host memory
The file is ggml/src/ggml-cuda/allreduce.cu in b10064. Its header comment states the design outright:
// Two reduction strategies are selected per call by tensor size:
//
//   * Chunked kernel path (small reductions): a single CUDA kernel both
//     stages data through pinned host memory and performs the local sum.
//     Cross-GPU synchronization happens *inside the kernel* (busy-wait on
//     a host-memory flag), which keeps launch overhead low for the
//     latency-sensitive token-generation case.
//
//   * Copy-engine path (large reductions): the transfer is split into
//     D2H + H2D cudaMemcpyAsync chunks driven by the GPU's copy engine,
//     followed by a small device-side add kernel.
Both strategies go through pinned host memory. The small path is the token-generation hot path; the large path is prefill. The large one says it in the code itself, device to host and then host to device:
CUDA_CHECK(cudaMemcpyAsync(..., cudaMemcpyDeviceToHost, p->streams[i]));
CUDA_CHECK(cudaMemcpyAsync(
    p->dev_tmp[i] + offset, p->host_large[peer].host + offset, this_bytes,
    cudaMemcpyHostToDevice, p->streams[i]));
The strongest evidence sits a few lines below that, in a note explaining why the code is shaped this way:
// atomicAdd_system() requires hostNativeAtomicSupported, which is unavailable
// on PCIe-attached consumer GPUs without NVLink, so the volatile path is the
// portable choice.
This backend was written for consumer cards that have no NVLink at all. Once you are on it, having a bridge changes nothing about the route the data takes.
Scope, before any of the numbers below. llama.cpp ships more than one AllReduce implementation, and
-sm tensorruns on whichever one your build selects. Everything below applies toGGML_CUDA_ALLREDUCE=internal, the backend this machine is configured for. llama.cpp ships other AllReduce implementations with different data paths, so check which backend your build selects before you apply these numbers to it.
One caveat: even on internal, NVLink still carries some traffic. Even on internal, NVLink is not fully unused. llama.cpp calls cudaDeviceEnablePeerAccess at init, and ordinary cross-device tensor copies use cudaMemcpyPeerAsync, which does ride the bridge. The bridge isn't idle. It just isn't carrying the hottest path, which is the per-layer AllReduce.
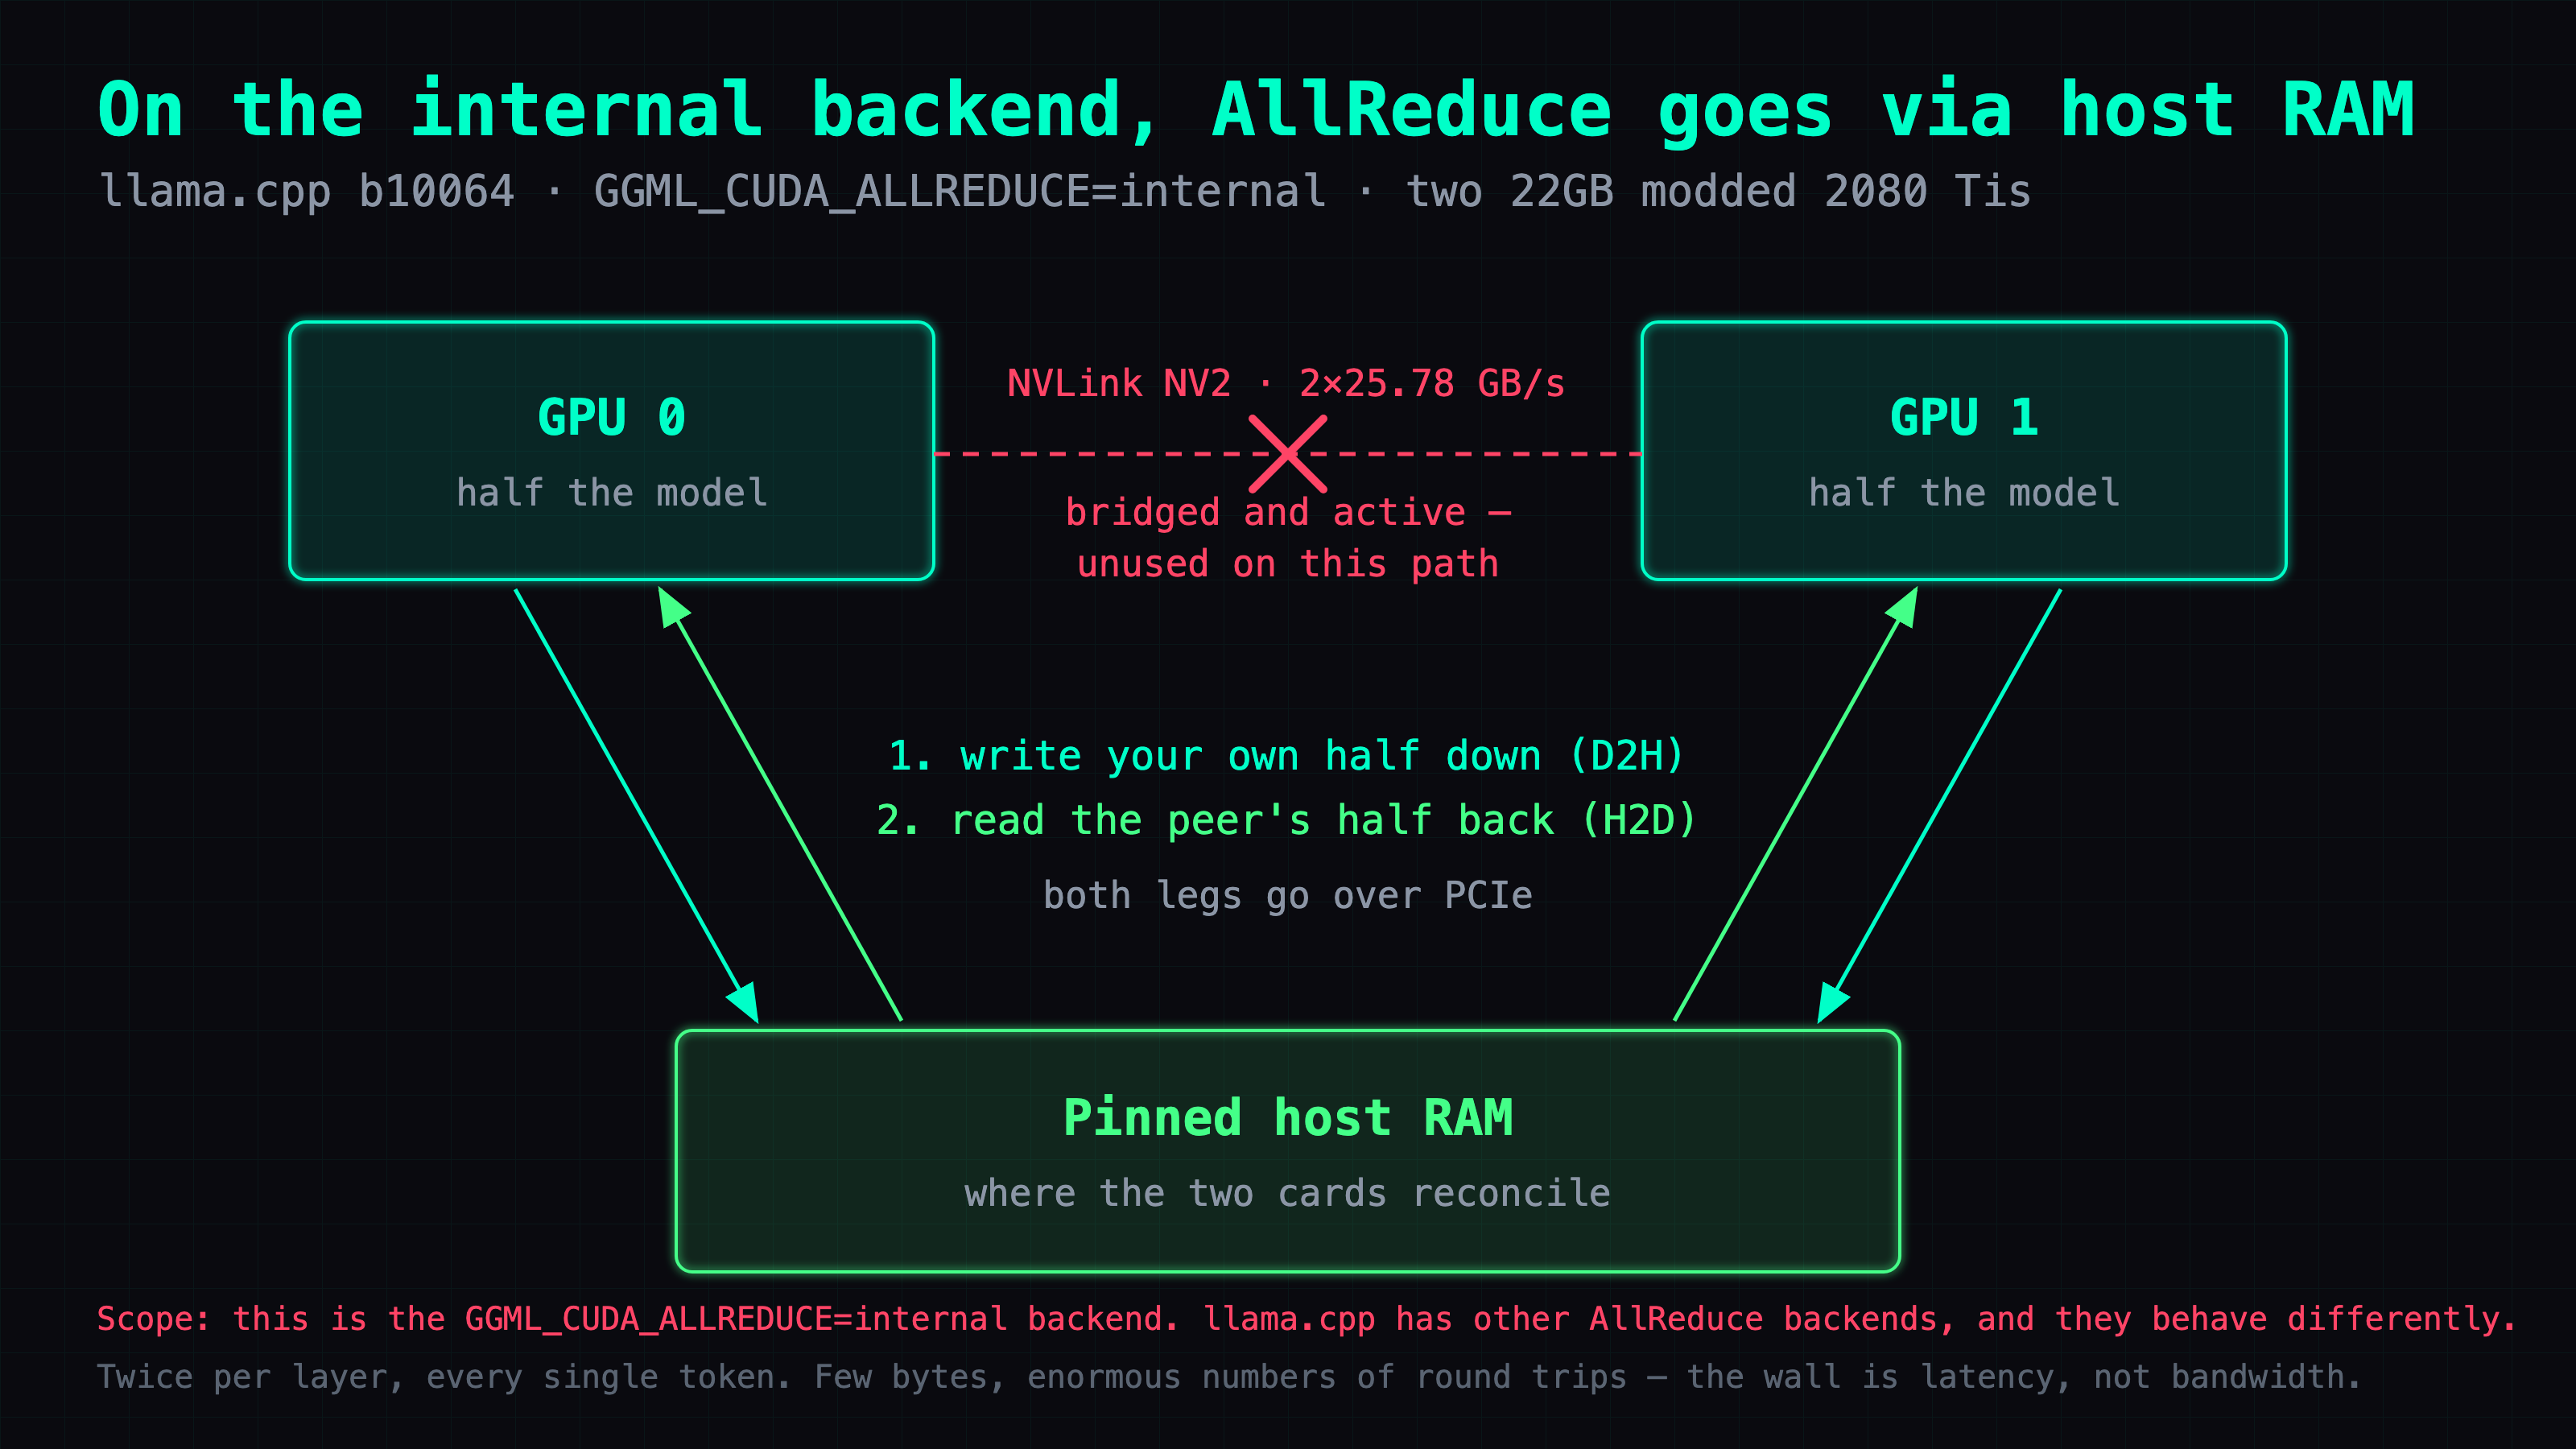
So the PCIe counters would show something after all. Which raised the next problem: how do you tell AllReduce traffic apart from the ordinary host-to-device traffic that any inference run produces?
Four arms, because a single number can't isolate AllReduce
You can't. Not from one measurement. Whatever -sm tensor shows on the PCIe counters includes every byte the process moves for any reason. That was my own itch more than anything else: once I knew the reduction was going over PCIe, I wanted to know how much of the traffic was actually it. Getting that number means running a control that does the same work without AllReduce.
Four arms, same model, identical flags, differing only in how the model is split:
- A — one GPU,
-sm none. No AllReduce at all. This is the PCIe floor. - B — two GPUs,
-sm layer. Each card owns whole layers, so there is one handoff at the layer boundary and still no AllReduce. - C — two GPUs,
-sm tensor. Weight matrices are sliced, so both cards compute a piece of every layer and reconcile twice per layer. - C' — C plus
--spec-type draft-mtp --spec-draft-n-max 3, the production config from Part 14.
C minus B is the net AllReduce cost. C's absolute value is not; it still contains all the ordinary traffic that B also has.
Model: Huihui Qwen3.8-27B abliterated, Q4_K, 16.8 GB. It fits on one card, which is the only reason arm A can exist at all. Shared flags across all four:
-ngl 99 -c 16384 --parallel 1 --jinja -fa on --metrics -fit off
KV cache left at f16, no vision model loaded. Context is 16K rather than the 262K I run in production, because one card cannot hold 262K of KV and arm A has to be the same as the others. That is safe for this question: the AllReduce payload scales with hidden size, not with context length.
Three reps per arm. Eight seconds of idle before each measurement, to confirm the baseline was actually zero. All twelve reps passed and none were discarded.
Across all four arms, PCIe never gets past 8% of the Gen3 x16 ceiling
The column to look at is decode rx and prefill rx — those are per card, not the two summed.
| arm | decode tok/s | decode rx | prefill tok/s | prefill rx |
|---|---|---|---|---|
| single GPU | 24.1 | 31 MB/s | 567.3 | 10 MB/s |
| dual, layer | 25.6 | 22 MB/s | 944.8 | 72 MB/s |
| dual, tensor | 37.7 | 89 MB/s | 844.9 | 1,045 MB/s |
| dual, tensor + MTP | 44.3 | 146 MB/s | 797.9 | 1,068 MB/s |
Net AllReduce cost, tensor minus layer: 67 MB/s per card at decode, and 973 MB/s per card at prefill. The ratio is a separate number, and worth not confusing with the first one: the tensor arm carries 4.0× as much total traffic as the layer arm at decode (89 vs 22 MB/s), and 14.5× as much at prefill (1,045 vs 72 MB/s).
Those multipliers look dramatic until you put them against the bus. This is PCIe Gen3 x16, 15,750 MB/s per direction. Decode uses under 1% of it. Prefill uses about 6.6%. Counting transmit as well as receive, the heaviest cell anywhere in the four arms is 1,265 MB/s, which is 8%. The production config, measured in the next section, nudges that to 8.2% and no further.
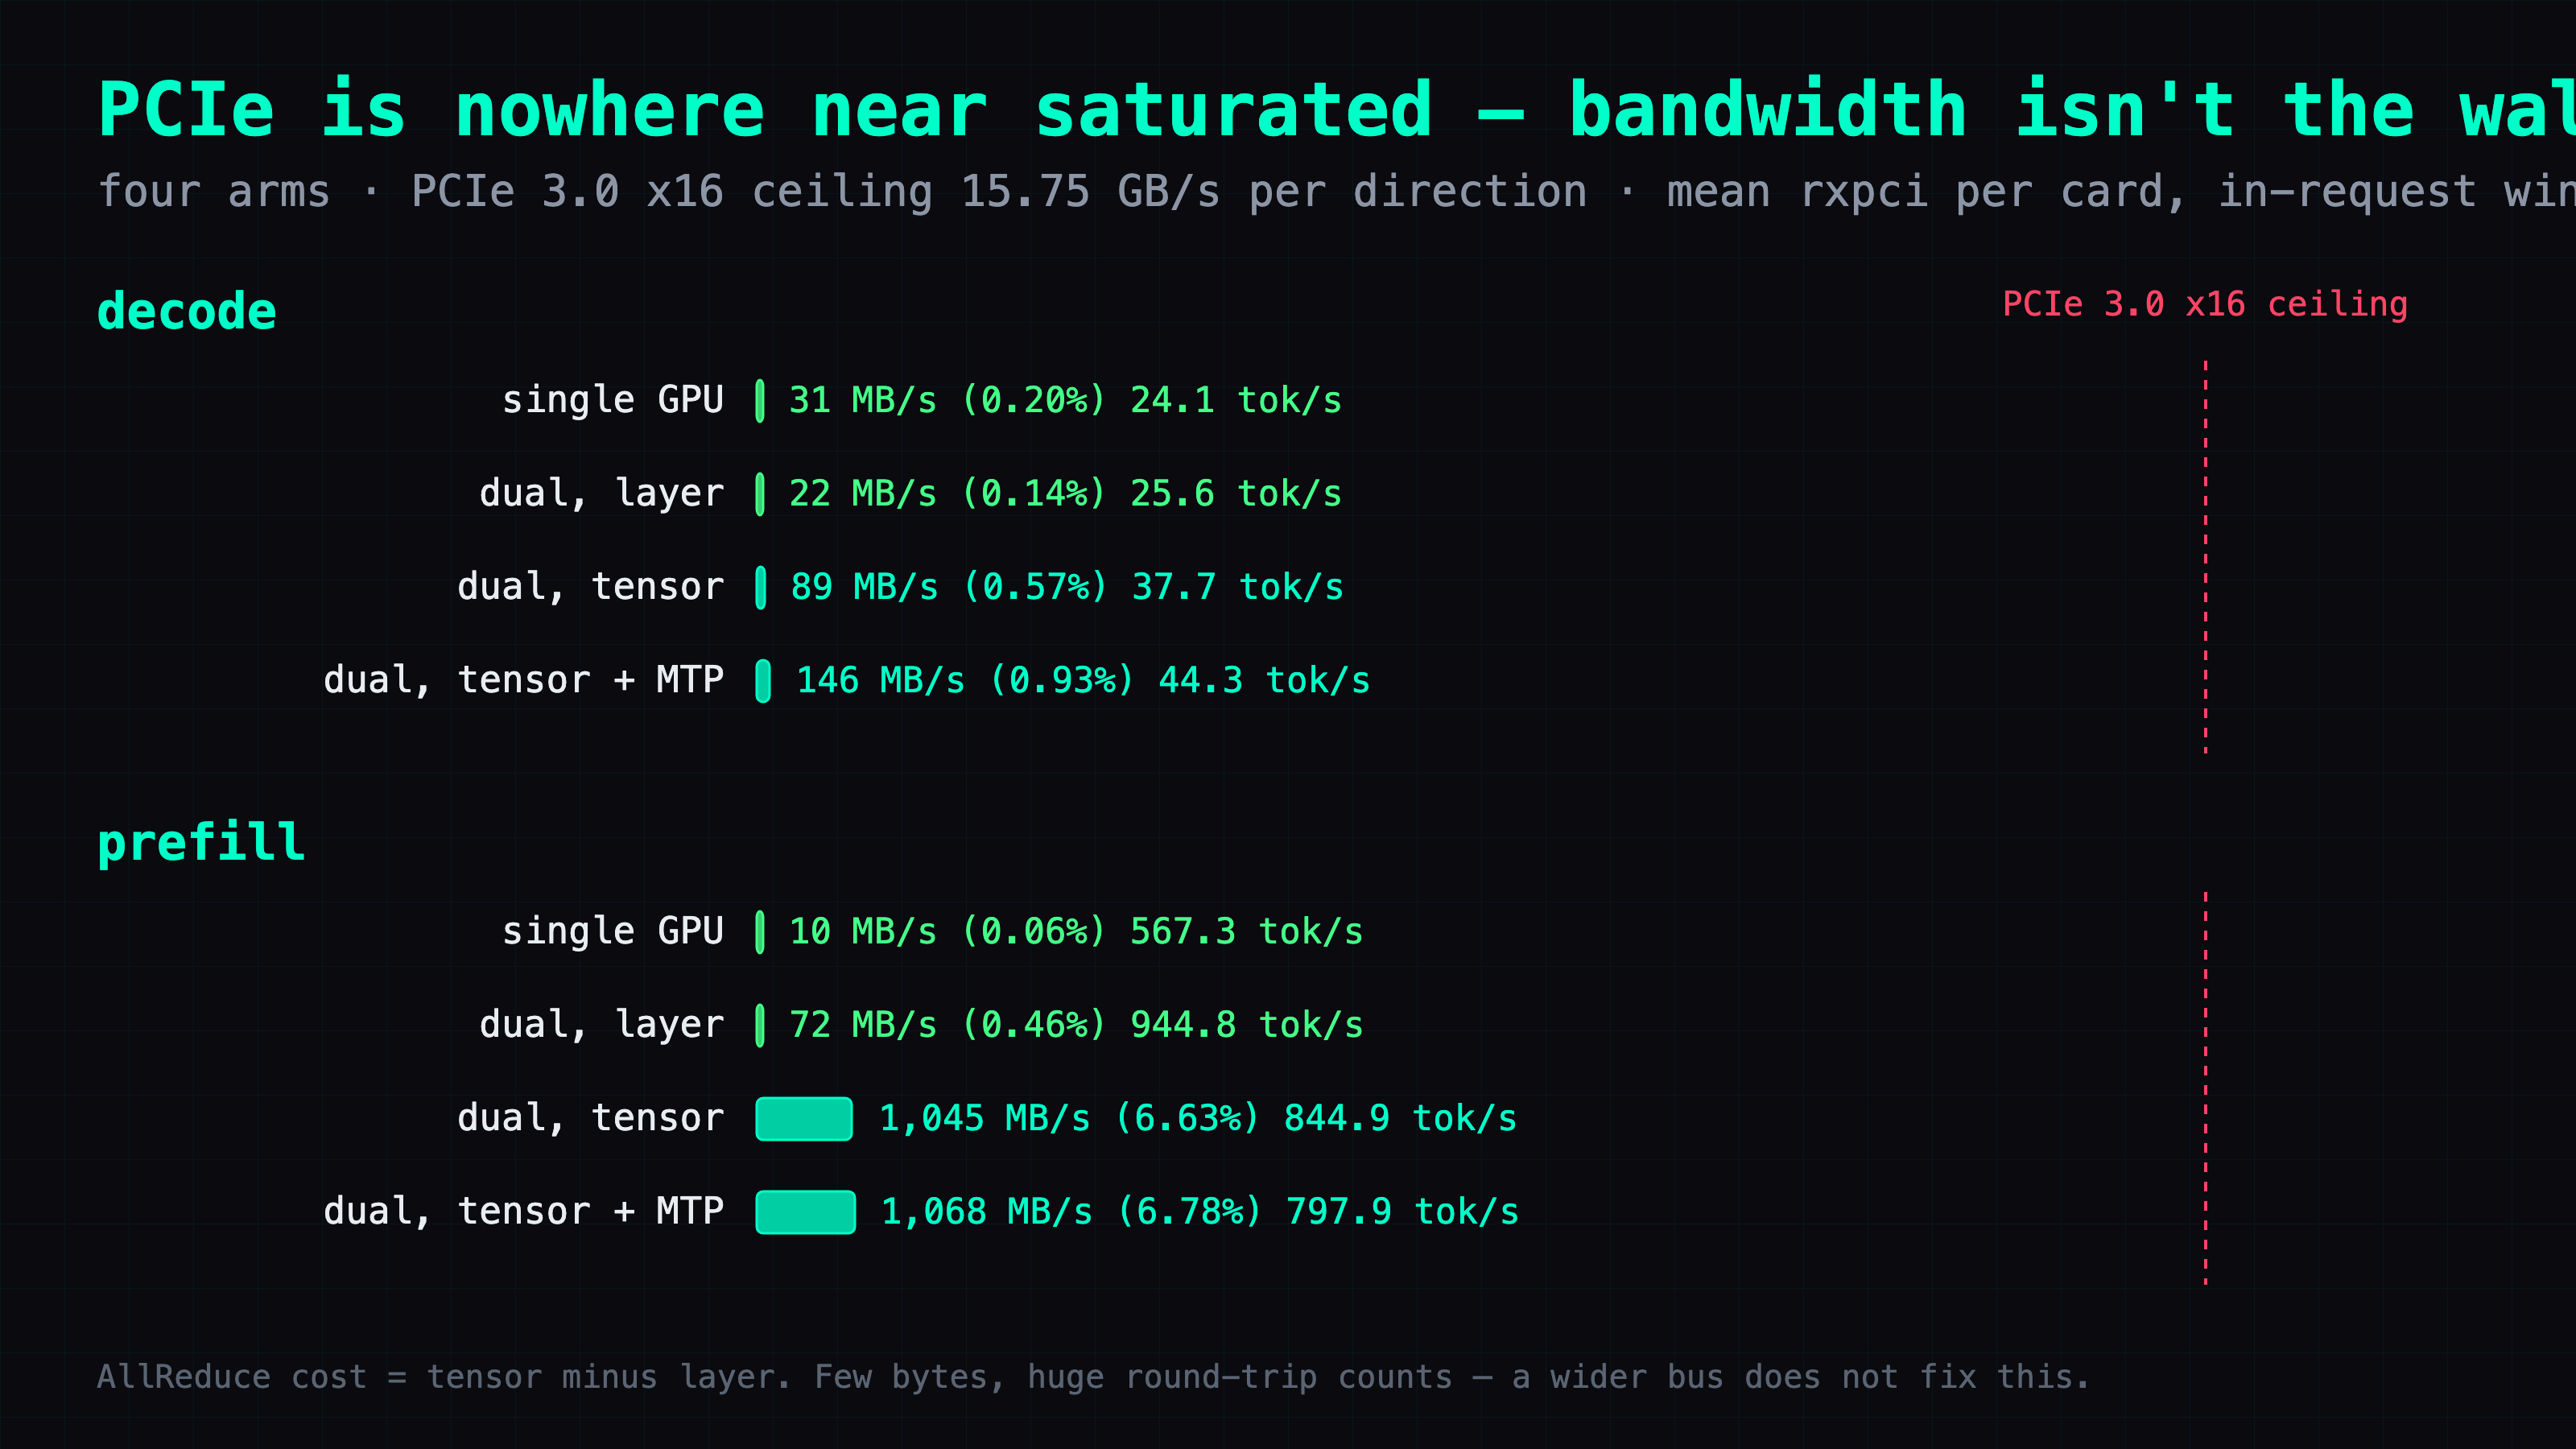
The practical takeaway, and it applies only to the internal backend: if you are on it and eyeing a Gen4 board upgrade specifically to make llama.cpp tensor parallel go faster, that money buys nothing. There is no bandwidth wall here to lift, and the bridge isn't on the path being measured. Don't extend that verdict to a build running a different AllReduce implementation — this data doesn't cover those.
How each number was computed. For each rep I kept only the samples inside the actual request window, aligning the server's reported start and end against the
dmontimestamps, took the mean inside that window, then the median across the three reps.Mean, not median, because this traffic is bursty. A real layer-split prefill window, second by second:
13, 13, 12, 11, 13, 15, 13, 0, 1111, 10, 0, 70. The median calls that 13 MB/s. But the second that read 1111 really did move 1.1 GB, and "how much of the bus got used" is total bytes over time. The median throws the bursts away.My first pass used the median and produced "80×" for prefill AllReduce amplification. That number was wrong — the denominator was understated.
The real production config tops out at 8.2% of the bus
The box was already quiesced for the four arms, so while it was quiet I ran the production config too — the one that actually serves traffic, the Part 14 command verbatim: -sm tensor, 262K context, --parallel 2, MTP at n=3, mmproj attached, KV left at f16. Three reps, same dmon method.
It couldn't have been one of the arms. Every arm has to fit on a single card for arm A to exist, which costs you 262K context, the second slot and the vision projector. Run on its own it keeps every production setting, so these numbers come from the real serving config rather than a stripped-down control.
The column that matters is the last one.
| phase | tok/s | rx per card | tx per card | share of Gen3 x16 |
|---|---|---|---|---|
| decode | 54.9 | 97–129 MB/s | 244–379 MB/s | rx 0.6–0.8%, tx 1.5–2.4% |
| prefill | ~801 | 1,132–1,166 MB/s | 1,282–1,290 MB/s | rx 7.2–7.4%, tx 8.1–8.2% |
The busiest single cell across every measurement in this article is that 8.2%, and it turns up here rather than in the controls. So "PCIe isn't saturated" isn't an artifact of a rig assembled to be measurable. The same result holds for the workload that actually serves traffic.
VRAM usage is a useful sanity check that the rerun really did reproduce the original config: 18,890 MiB on GPU0 and 17,752 MiB on GPU1, against 18,888 and 17,738 published in Part 14. Near-identical, which is what you want to see before trusting anything else in the row.
Decode came in at 54.9 tok/s here versus 59.632 in Part 14, about 8% lower. Different prompt, different measurement window. I'd read those as two independent measurements of the same configuration rather than as a regression, and I'm not going to massage them into agreeing.
Prefill is 11% faster on layer split than on tensor split
This one I did not expect. Look at the prefill column again: the fastest arm is the plain layer split at 944.8 tok/s, not tensor at 844.9. Tensor parallel is about 11% slower at prefill.
The reason is what prefill is. It feeds a large batch through the model, so both cards already have plenty of work in front of them. Parallelism was never the constraint there. What tensor parallel adds at that point is reconciliation on every layer — the ~1 GB/s measured above, plus the two cards waiting on each other to arrive. You pay the tax and get nothing back for it.
Decode is the mirror image. One token at a time doesn't come close to filling a single card's compute units, so slicing each layer across both cards is worth doing: 37.7 vs 25.6 tok/s, a 47% gain. Adding MTP on top takes it to 44.3.
So there is no single right answer to "which split mode should I use". A long-prompt, short-answer workload — dump in a document, ask one question about it — is prefill-heavy, so layer split is the better deal there. Long chatty generation is tensor parallel's home ground. Pick per workload, not once.
One caveat that has to be said plainly: the 44.3 tok/s here is not comparable to Part 14's 59.632. This run used 16K context, one slot, and a different prompt, all so the four arms would stay identical to each other. Part 14 was the 262K production configuration. Different measurement windows. Don't put the two numbers on the same line.
What limits dual-card decode is round trips, not bytes
At decode, tensor parallel moves 89 MB/s per card on a bus that does 15,750. If bandwidth were the constraint, there would be more than a hundredfold headroom left over. There plainly isn't, since decode only reached 37.7 tok/s.
The time goes into round trips. Every token, every layer, two AllReduces. Each one: write your half to host memory, wait for the peer to write theirs, read theirs back. Very few bytes each time, but dozens of waits per token.
The internal backend's small-tensor path busy-waits for exactly this reason — the kernel spins on a host-memory flag until the peer's token number matches. The source says this keeps "launch overhead low for the latency-sensitive token-generation case". That path was written to minimize latency, not to maximize bandwidth, and the counters agree with the source.
Which tells you what actually speeds up dual-card decode: fewer round trips, not a wider bus. MTP is precisely that. One forward pass yields several tokens, so the same round-trip cost gets amortized over more output. That's where 44.3 vs 37.7 comes from, a 17% gain that has nothing to do with bandwidth.
Advanced: the measurement rig, and the three traps in it
Skip this section if you only wanted the numbers — nothing below changes them. What's here is how the four arms were built, the two flags that nearly invalidated the comparison without saying anything, and the full per-GPU data with its spread.
The full four-arm config
Copy-pasteable. Everything above the split-mode lines is identical across all four arms.
# shared by all four arms, identical
-ngl 99 -c 16384 --parallel 1 --jinja -fa on --metrics -fit off
--chat-template-kwargs '{"enable_thinking":false}'
--temp 0.7 --top-p 0.80 --top-k 20 --min-p 0.0
--presence-penalty 1.5 --repeat-penalty 1.0

# A  single card
CUDA_VISIBLE_DEVICES=0                                    -sm none
# B  dual, layer split
CUDA_VISIBLE_DEVICES=0,1 GGML_CUDA_ALLREDUCE=internal      -sm layer
# C  dual, tensor
CUDA_VISIBLE_DEVICES=0,1 GGML_CUDA_ALLREDUCE=internal      -sm tensor
# C' dual, tensor + MTP
CUDA_VISIBLE_DEVICES=0,1 GGML_CUDA_ALLREDUCE=internal      -sm tensor \
  --spec-type draft-mtp --spec-draft-n-max 3
Trap 1: --fit is on by default, and -sm tensor ignores it
The problem. I built the four arms by writing one shared flag string and appending the split mode. That felt airtight, so my working assumption was that the arms were identical by construction and the only thing left to worry about was measurement noise.
What I did. Started arm C and read the server's startup output instead of skipping straight to the benchmark. It printed this:
common_fit_params: failed to fit params to free device memory:
llama_params_fit is not implemented for SPLIT_MODE_TENSOR, abort
What that means. --fit auto-adjusts parameters you didn't explicitly specify so the model fits in available VRAM, and it is on by default. -sm tensor doesn't support it, so it gives up at startup. Consequence: arms A and B get auto-tuned, arms C and C' don't. The four arms stop being one condition, and nothing tells you they've diverged — the numbers still come out, and they still look reasonable.
The fix. -fit off explicitly, on all four arms.
Where my assumption was wrong. I thought "identical flag string" was the same thing as "identical condition". It isn't, once a flag makes decisions on your behalf. The general rule I took from this: in a controlled comparison, any flag that decides something for you has to be turned off — not because it decides badly, but because it decides differently for different arms, which is the one thing a control cannot tolerate.
Trap 2: --help still lists -sm row, but the code is gone
The problem. I wanted a third control. Row split seemed ideal: another way of dividing the model, another traffic pattern to compare against. The help output backs that up:
-sm, --split-mode {none,layer,row,tensor}
All four modes, right there.
What I did. Started the server with -sm row on b10064. Model load died.
Why. The CUDA implementation of row split was deleted upstream in PR #24216, merged 2026-07-06, titled "CUDA: remove -sm row, refactor cuBLAS". The help text was never updated. So the flag parses, and then there is nothing behind it.
Where my assumption was wrong. I treated --help as a statement about the build I was running. It's a statement about the string table in that build. Listed in help does not mean implemented, and that inverts the normal instinct, which is to trust the tool's own documentation over your memory. Part 14 has more on this one; it cost me a whole evening there, and here it only cost a third arm.
Trap 3: the median threw away the bursts
The problem. I had twelve reps of per-second samples and needed one number per arm per phase. Reflexively I reached for the median, on the standard reasoning that it's robust against outliers and I didn't want one weird second dominating a result.
What I did. Computed it, and got a prefill AllReduce amplification of 80×. That felt too large, so I went back and printed the raw window instead of just its summary. Arm B, prefill, GPU1 rxpci in MB/s, one sample per second through the request window:
  t+0     13
  t+1     13
  t+2     12
  t+3     11
  t+4     13
  t+5     15
  t+6     13
  t+7      0
  t+8   1111
  t+9     10
  t+10     0
  t+11    70
What that proves. Both statistics are computed correctly. The median of that window really is 13 MB/s, and the mean really is about 106. The 1111 is not an artifact — that second genuinely moved 1.1 GB across the bus, and the zeros around it are the copy engine idle between bursts.
Where my assumption was wrong. I picked a statistic that answers a different question than the one being asked. "What is a typical second" is what the median answers. The question here is "how much of the bus got used", which is total bytes over elapsed time, and that is the mean by definition. Robustness against outliers is a virtue only when the outliers are noise. Here the outliers were the signal — the bursts are the entire transfer.
How thin the decode sampling really is
Stating this plainly rather than burying it: the decode numbers are weak, and I don't want them quoted as though they aren't.
dmon tops out at one sample per second. Each decode run only lasted 3 to 7 seconds. That gives 4 to 10 samples per rep, and it shows: arm C GPU0's three reps spread from 51 to 175 MB/s. Prefill is in much better shape at 13 to 22 samples per rep, and the reps converge — arm C GPU0 came in at 1033, 1176, 1038.
So: prefill numbers are citable, decode numbers are order-of-magnitude only. Measuring decode properly needs finer sampling than dmon offers, which is a different tool and a different article.
It does not change the headline, though. Even the single largest decode sample in the entire dataset — arm C' GPU1 at 209 MB/s — is 1.3% of the ceiling.
Full data, all four arms
Per rep: mean inside the request window. Across reps: median. Parentheses show the spread across the three reps.
| arm | phase | GPU | rx MB/s | tx MB/s | samples per rep |
|---|---|---|---|---|---|
| A | decode | 0 | 31 (26–38) | 23 | 10, 10, 6 |
| A | prefill | 0 | 10 (9–45) | 6 | 21, 22, 22 |
| B | decode | 0 | 22 (21–26) | 5 | 6, 8, 6 |
| B | decode | 1 | 22 (22–29) | 34 | 6, 8, 6 |
| B | prefill | 0 | 33 (10–99) | 3 | 13, 14, 13 |
| B | prefill | 1 | 110 (14–117) | 108 | 13, 14, 13 |
| C | decode | 0 | 115 (51–175) | 56 | 5, 4, 6 |
| C | decode | 1 | 63 (48–72) | 50 | 5, 4, 6 |
| C | prefill | 0 | 1038 (1033–1176) | 1265 | 14, 15, 15 |
| C | prefill | 1 | 1052 (1030–1087) | 1240 | 14, 15, 15 |
| C' | decode | 0 | 97 (86–235) | 154 | 4, 6, 5 |
| C' | decode | 1 | 195 (182–209) | 245 | 4, 6, 5 |
| C' | prefill | 0 | 1071 (989–1169) | 1118 | 15, 15, 14 |
| C' | prefill | 1 | 1064 (1048–1335) | 1215 | 15, 15, 13 |
One pattern in there is worth pointing at, because it confirms the two split modes are doing what they claim. Under layer split, GPU0 barely transmits at all — 3 to 5 MB/s — while GPU1 carries everything, 34 to 108. That asymmetry is the pipeline fingerprint: the last layers and the output head live on the second card, so data flows one way and doesn't come back. Tensor split is far more symmetric on both columns, which is what you'd expect when both cards have to reconcile on every layer.
The NVLink counters these cards don't report
For completeness, since this is the fact the whole article depends on:
nvidia-smi nvlink -gt d -i 0
Data Tx: N/A
Data Rx: N/A
Same output on all three cards in the box. Don't read that as a rule about consumer versus datacenter hardware — NVIDIA documents this per device and there's no clean line to draw; an RTX A6000 returns real values. It's a fact about these 2080 Tis, and it has a consequence worth stating: this article is only measurable because the reduction goes over PCIe. Put it on the bridge instead, on cards that report nothing, and it's invisible on PCIe and unreadable on NVLink at once — no counter anywhere to read.
Quiescing: verify the baseline is zero, don't assume it
The problem. My first casual attempt at this, before I'd designed the arms, just started dmon and fired a request at the running server.
What I saw. A steady ~1 GB/s that looked, at a glance, like a beautiful result:
02:41:41   0   963   367
02:41:41   1  1119   349
02:41:42   0  1390   316
What it actually was. Not mine. Another client was hitting the same server, and roughly 150 MB/s kept flowing after my own request had finished — which is what gave it away.
The fix. For the real run the serving instance was stopped entirely, and every single measurement was preceded by 8 idle seconds confirming a zero baseline on both cards.
Where my assumption was wrong. I assumed nobody was using the box because I hadn't asked anyone to. That's not evidence of anything. Verify the baseline is zero; don't reason your way to it.
Takeaways
nvidia-smi dmon -s tanswers this in one line, read-only, without slowing the run down. Align the samples to your request's start and end, or you can't separate your traffic from anyone else's.- There is no single right dual-GPU split mode. Prefill-heavy work favors layer split, 11% faster. Generation-heavy work favors tensor split, 47% faster. The workload picks, not the config file.
- One flag can sit on top of completely different implementations.
-sm tensoris the same flag either way, but the AllReduce underneath it is selectable, and everything here was measured onGGML_CUDA_ALLREDUCE=internal— where the reduction goes through host memory and the bridge isn't on the path, so a bridge buys nothing for tensor parallel. Before carrying any benchmark's numbers onto your own box, mine included, check which implementation it actually measured.
Also in this series: Part 14: Two Modded 2080 Tis Reach 59.6 tok/s on Qwen3.8-27B With llama.cpp Tensor Parallel
FAQ
- Does llama.cpp tensor parallel use NVLink?
- Not on the backend measured here. Under GGML_CUDA_ALLREDUCE=internal, both reduction strategies in ggml/src/ggml-cuda/allreduce.cu stage data through pinned host memory, so both legs of every reduction cross PCIe rather than the bridge. Two qualifications. llama.cpp still enables peer access at init, and ordinary cross-device tensor copies use cudaMemcpyPeerAsync, which does ride the bridge. And llama.cpp ships more than one AllReduce implementation, so do not generalize this answer to a build running a different one.
- How do I measure the PCIe bandwidth a multi-GPU inference run actually uses?
- nvidia-smi dmon -s t -i 0,1 -d 1 -o T, in a second terminal. The t group prints rxpci and txpci per GPU in MB/s, one line per second. The -o T timestamp column is the part people skip and then need: without it you cannot align samples to your request's start and end, and you cannot tell your traffic from another client's.
- Should I use -sm layer or -sm tensor in llama.cpp on two GPUs?
- It depends on the shape of your workload, and there is no single right answer. In my four-arm run, prefill was 11% faster on layer split (944.8 vs 844.9 tok/s) because a big batch already saturates both cards and tensor parallel only adds reconciliation. Decode was 47% faster on tensor split (37.7 vs 25.6 tok/s) because one token at a time cannot fill one card. Long prompt with a short answer favors layer; long generation favors tensor.
- Would a PCIe Gen4 board or an NVLink bridge speed up llama.cpp tensor parallel?
- Not on the backend measured here. The heaviest single measurement anywhere in this article was 1,290 MB/s against a 15,750 MB/s per-direction Gen3 x16 ceiling, so there is no bandwidth wall to lift, and decode is limited by round-trip count rather than bytes. That holds for GGML_CUDA_ALLREDUCE=internal specifically. llama.cpp has other AllReduce implementations that route data differently, and this data says nothing about them, so check which one your build selects before spending money.
Read next
- 2026-08-23[Benchmark] Fixing NCCL's Stub-Library Error Cut PCIe Traffic 99% and Barely Moved Speed
NCCL died on two modded 2080 Tis with 'CUDA driver is a stub library'. Building v2.31.2 from source fixed it: PCIe traffic down 99%, code generation unchanged.
- 2026-08-22[Benchmark] Two Modded 2080 Tis Reach 59.6 tok/s on Qwen3.8-27B With llama.cpp Tensor Parallel
Two modded 22GB RTX 2080 Tis hit 59.6 tok/s on Qwen3.8-27B using llama.cpp's -sm tensor split mode plus MTP, after -sm row was deleted upstream. Config, gotchas and the failed routes included.
- 2026-09-21Ternary Bonsai 2 on One RTX 2080 Ti: Qwen3.8-27B in 7.2 GB Scores 130 of 140
Ternary Bonsai 2 27B scored 130/140 on one modded 2080 Ti vs 131 for Qwen3.8-27B Q8_0 on two cards. Build steps, the flag that matters, why smaller is slower.
- 2026-08-28[Benchmark] A 177B MoE on Three Modded 2080 Tis: 23 tok/s at 128K, 77 on a File Edit
Qwen3.8-Flash-Next (176.94B, arch qwen4exp) runs on 3× modded 2080 Ti 22G at 23.14 tok/s at 128K context — and 3.51× that on a file edit, with no draft model.
Don't miss the next one
Subscribe, and you won't.
One-click unsubscribe anytime.