改裝 2080 Ti 22G · part 3
[Just for Fun — Advanced] I Maxed Context to 256K, It Loaded Fine — Then Crashed in Real Use: A VRAM Detective Story on a 22GB Frankencard
❯ cat --toc
- The short version: "context the model supports" isn't "context your card runs stably"
- Picking up from that 503 in the last post
- The math: 22GB minus 15.7GB — aren't there gigabytes just sitting there?
- The 503 runaround: no OOM in the log, just a lone 0xc0000409
- Suspect one: I blamed the context checkpoint — then read the source and found it isn't in VRAM at all
- Suspect two: free-VRAM-vs-context is nonlinear (the main chart)
- Mystery solved: the 128K sweet spot survives the stress tests
- The honest twist: 128K still threw one crash, and I won't pretend otherwise
- The mechanism: why this brain's checkpoints are both large and quick to invalidate
- Rules you can carry to another card
- What's next
TL;DR
The model card says n_ctx_train=262144 (256K). The card has 22GB. The 27B's Q4 weights are only 15.7GB. The math looks obvious: max it to 256K, gigabytes to spare. -c 262144, launch — loads fine, no error. A few turns of real conversation later: 503, and the service restarts itself. No tidy out of memory in the log, just a lone Windows Event 0xc0000409. nvidia-smi: free VRAM down to ~170 MiB. Where did the gigabytes go? This post chases it down. Three leads: (1) the real VRAM eater is the KV cache (it grows linearly with context) — I first blamed context checkpoints, then read the llama.cpp source and found checkpoints actually live in host RAM (std::vector<uint8_t>, read back off the GPU), not VRAM; (2) free-VRAM-vs-context is nonlinear — 256K=170 / 200K=164 / 128K=~2GB, so dropping 56K does nothing but dropping to 128K opens it up; (3) why those checkpoints are so large and quick to invalidate traces to the hybrid architecture (llama.cpp issue #22746, Open, against Qwen 3.6 27B exactly; precedent #20225 is 3.5 and closed) — that's the next post's TTFT thread. After the hunt, 128K is the one stable sweet spot — but I won't pretend it's flawless: 128K still threw one crash, root cause still open, with the crash-log armed for next time.
The short version: "context the model supports" isn't "context your card runs stably"
Buy a modded 22G card and nine out of ten people do the same thing: see "supports up to 256K context" on the model card and try to max it out. I did too. The math sounds airtight — a 22GB card, 15.7GB of Q4 weights, several gigabytes left over, so of course 256K loads.
-c 262144, launch. It loaded fine — not a single error. That's the trap: in this game, "it loaded" isn't a green light, it just means you haven't hit the wall yet. A few turns of real conversation in, the service crash-restarts itself and the client gets a 503 Loading model. I check VRAM and the whole 22G card has 170 MiB free — a razor-thin margin. Those leftover gigabytes weren't eaten by the weights. My first suspect was the context checkpoint — but the hunt ends in a reversal: the real culprit is the KV cache growing linearly with context, and the checkpoint doesn't live in VRAM at all (I had to read the llama.cpp source to be sure).
Picking up from that 503 in the last post
When the last post explained why I run a slow Qwen 27B as the agent brain, I left a thread dangling: the log had a 503 Loading model line that I said maps to "context blows up, the brain crash-reloads," a subject for a later hard-core post. This is that post.
The setup carries over from the first two parts: a second-hand 22GB-modded RTX 2080 Ti (Turing sm_75, ~616 GB/s memory bandwidth) in a cheap old desktop with just 16GB of RAM and a six-core CPU, running llama.cpp to serve an abliterated Qwen3.6-27B Q4_K (~15.7GB) as a resident agent brain.
First, the model's own metadata, pulled live from forge's /v1/models:
n_ctx_train  = 262144   # the model was trained out to 256K
n_ctx        = 131072   # what I actually run now: 128K
n_vocab      = 248320
n_params     = 27.32B
size         ≈ 16.8 GB  # the Q4_K weights on disk
n_ctx_train=262144 is "the model supports 256K," in black and white. The n_ctx=131072 underneath is the spoiler: what I run now is 128K, not 256K. Why I dropped from 256K to 128K is the whole post.
The math: 22GB minus 15.7GB — aren't there gigabytes just sitting there?
The intuitive ledger goes like this:
- Card: 22528 MiB (modded 22G)
- Weights: Q4_K, ~15.7GB
- Left over: ~6GB
"Six gigs for KV cache, plenty to run at 256K, right?" That's exactly how I thought about it, and the intuition is wrong in a very reasonable way — it counts the weights and forgets the whole pile of runtime scratch.
At launch, llama.cpp even drops a helpful warning (verbatim):
n_ctx_seq (131072) < n_ctx_train (262144) -- the full capacity of the model will not be utilized
(This line is from running 128K now, so it's complaining that I'm not maxing the model out. Back when I ran 256K I did set -c to 262144 — and that, too, loaded cleanly with no error. That's the first trap: n_ctx_train is the model's capability, not your card's, and "it loaded" is even less of one.)
The 503 runaround: no OOM in the log, just a lone 0xc0000409
A few turns into a 256K conversation, things went wrong. I tried again — 503. Once more — another 503. The service had restarted itself.
What first drove me up the wall: there was no tidy out of memory anywhere in the log. No CUDA OOM, no ggml alloc-failure message — just one cryptic line in the Windows Event Log, 0xc0000409, the status code for a fail-fast abort (via ucrtbase, which looks like llama.cpp aborting itself, possibly a GGML_ASSERT or some uncaught exception; that attribution is a guess — all I can confirm is "fail-fast abort plus an auto-restart").
Then I checked nvidia-smi and saw the number that made me wince: free VRAM down to ~170 MiB.
A 22GB card, weights taking only 15.7GB, and 170 MiB free? Where did the rest go?
Suspect one: I blamed the context checkpoint — then read the source and found it isn't in VRAM at all
The first suspect is the thing my ledger never accounted for: the context checkpoint.
In short: to avoid re-processing the entire prompt every turn, llama.cpp caches the intermediate compute state of a conversation so the next turn can warm-restore from it. That cache is the context checkpoint — and it isn't small.
How big? On forge I pulled a string of checkpoint events, verbatim:
created context checkpoint 1 of 8 (... size = 298.773 MiB)
restored context checkpoint (... size = 268.442 MiB)
erased invalidated context checkpoint (... size = 268.646 MiB)
The samples land between 248 and 299 MiB, growing as the conversation position advances. ~280 MiB each, with a fairly large default pool — and my gut said the obvious thing: "that's what ate the VRAM." (I also corrected my old note's "~200 MiB" to the live 250-300 while I was here.)
Then I read the llama.cpp source, and the case flipped. The checkpoint struct common_prompt_checkpoint (in common/common.h) holds its actual state mainly in two host buffers (target / draft):
std::vector<uint8_t> data_tgt;
std::vector<uint8_t> data_dft;
std::vector<uint8_t> is host RAM, not VRAM. Building a checkpoint goes through llama_state_seq_get_data — it reads the KV/recurrent state back off the GPU into a host buffer; the size = 298 MiB the log prints is the host-RAM footprint, not card memory. In other words, the checkpoint pool eats that box's 16GB of system RAM (a real pressure of its own, more later) — but it never touches a single byte of VRAM. My gut was wrong, and wrong in a very understandable way: it's got "context" in the name and the log prints MiB, so of course you assume it's on the card.
⚠️ Self-correction: my notes (and this post's first draft) called the checkpoint VRAM-resident. Reading the source settled it — it's host RAM. That reversal swaps out this section's culprit: not the checkpoint, but the next thing.
So what does eat the VRAM? The KV cache. The KV cache is genuinely VRAM-resident and grows linearly with the context you set. That ~6GB of "free space" — at 256K the KV cache eats up almost the entire budget and leaves me ~170 MiB. Short conversations look fine. But the moment real load needs a little more VRAM for runtime scratch (the compute buffer for a forward pass, especially when full-reprocessing a long prompt), a razor-thin 170 MiB sliver can't absorb it → abort → restart → the client gets a 503. Crash loop solved — just with a different culprit.
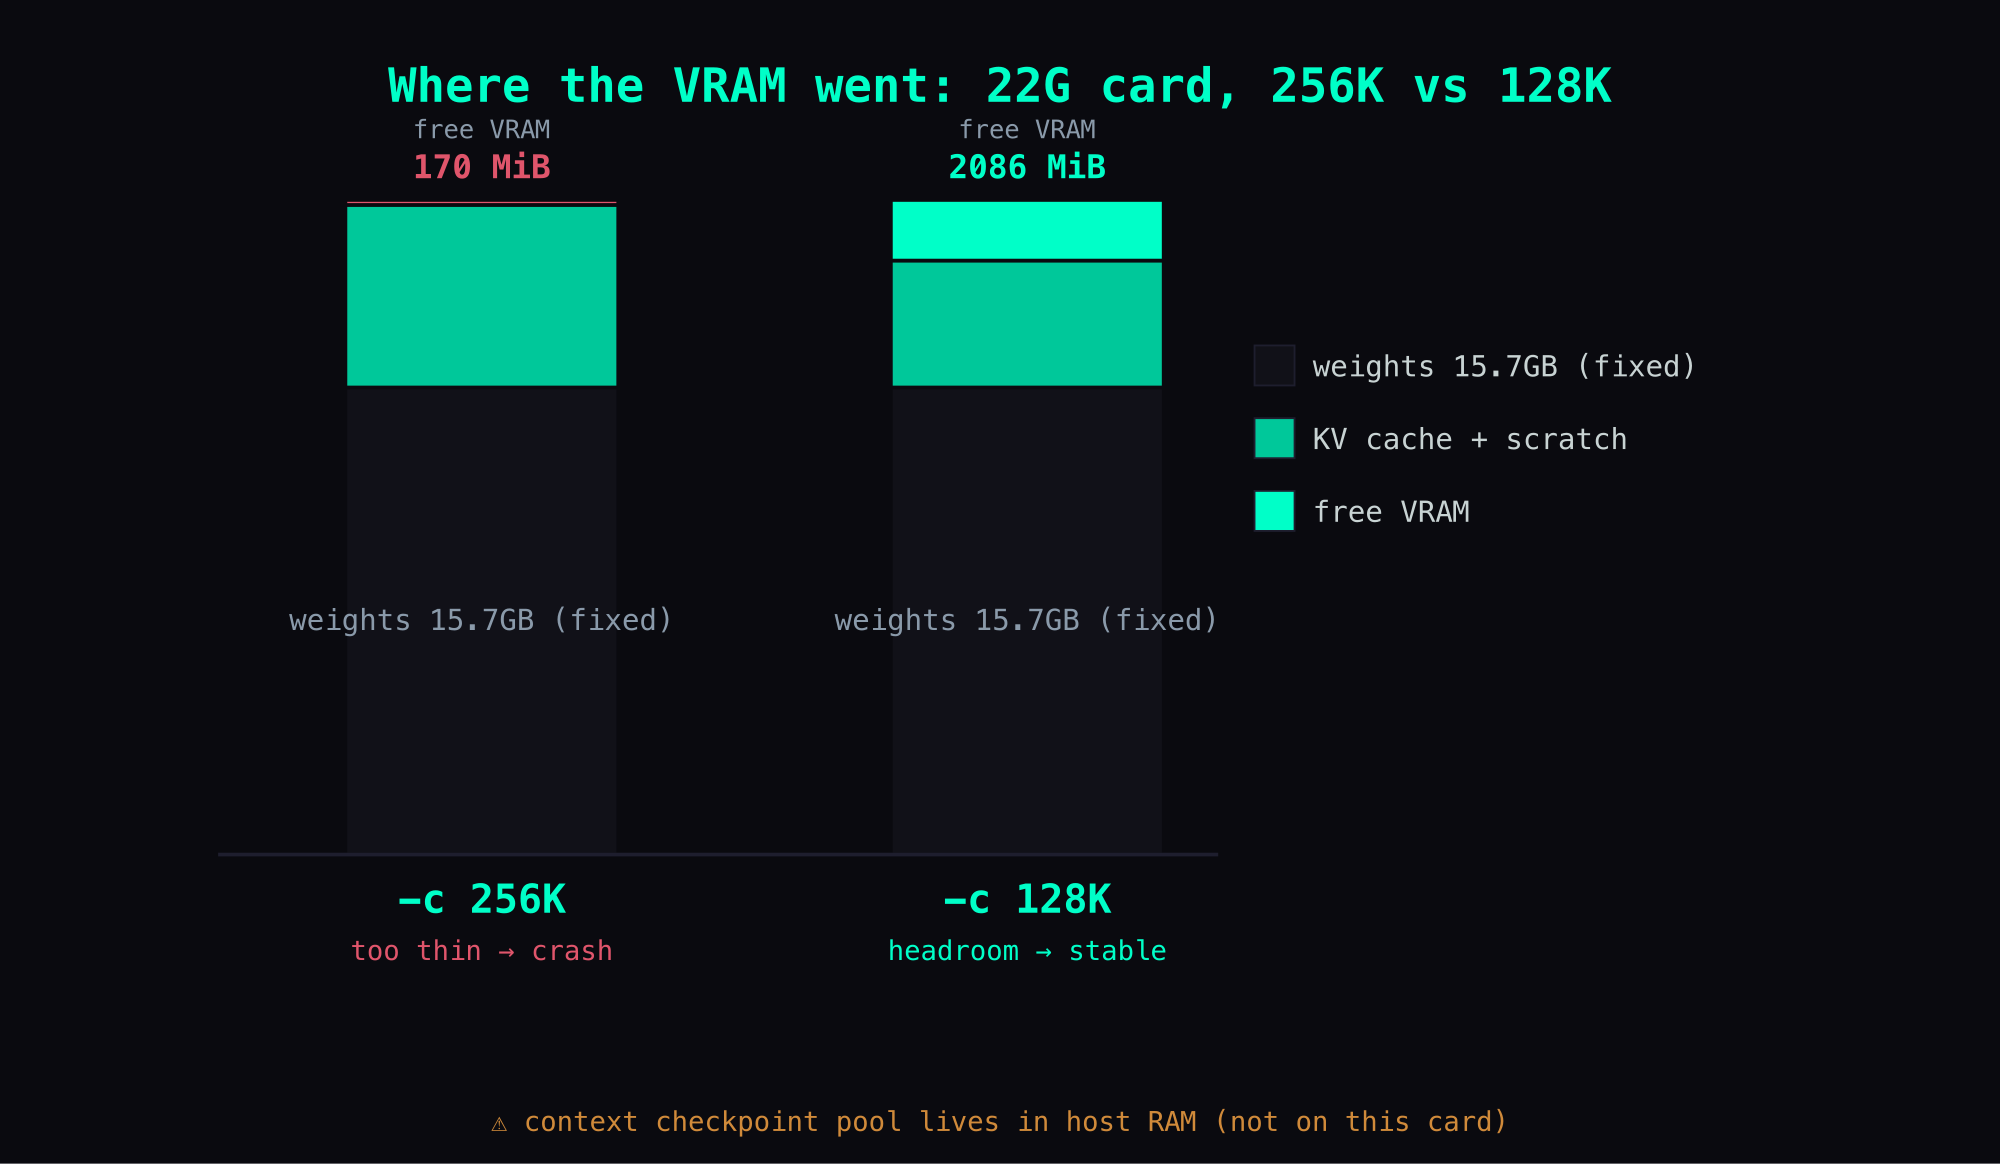
Suspect two: free-VRAM-vs-context is nonlinear (the main chart)
Having pinned the KV cache as the VRAM eater, I figured the fix was simple: step back, don't run 256K, run 200K — less KV, so surely dropping 56K squeezes out some headroom?
The actual numbers killed that theory. Free VRAM across three context settings:
context (-c) | free VRAM | note |
|---|---|---|
| 256K (262144) | 170 MiB | loads, but crashed reliably under my load once the conversation grew |
| 200K | 164 MiB | dropped 56K, headroom barely moves (lower, even) |
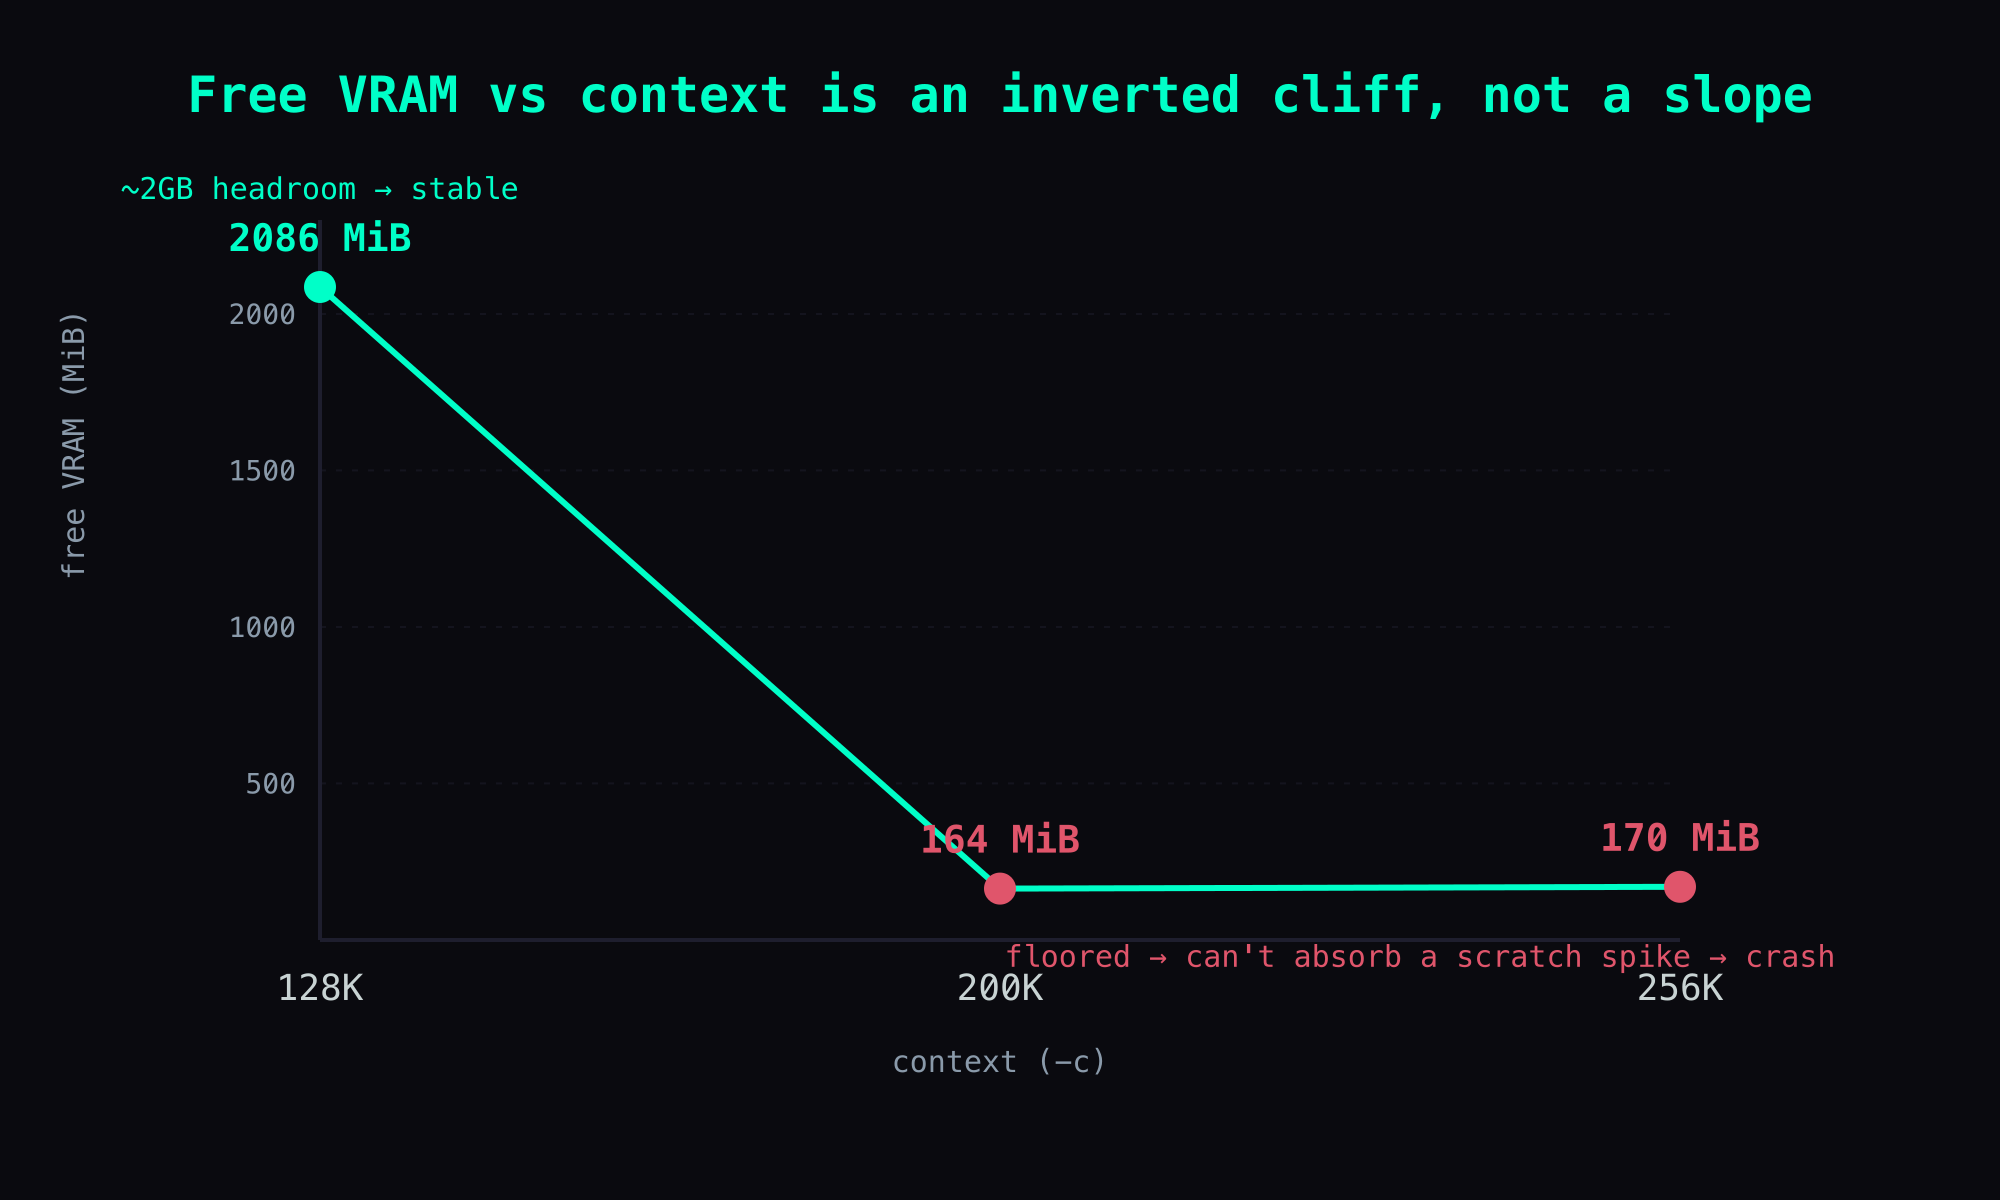
| 128K (131072) | ~2GB (live re-measured at 2086 MiB) | the only stable one; ample headroom for runtime scratch |
The table is a jolt: 256K → 200K, a 56K drop, and free VRAM goes from 170 to 164 — no headroom gained at all. But 200K → 128K, only 72K more, and free jumps from 164 straight to ~2GB. This curve isn't a sloped line, it's a cliff: 200K and 256K have both flatlined near the floor, and only at 128K does it leap up.
Why nonlinear? Because the KV cache you free by shrinking context, in that 200-256K band, gets quietly eaten back by other VRAM scratch (compute/graph buffers, draft state, plus the allocator's alignment and reservations) — you think dropping context returns headroom, but you're really just moving VRAM from one pocket to another (note: the checkpoint pool is not in that list — it's in host RAM). Only once you drop low enough to clear those scratch demands does free actually open up.
⚠️ Caveat: the
256K=170and200K=164numbers are single measurements with no live re-run;128K=2086is live, double-confirmed. To be rigorous you'd re-measure each-con forge. But the shape of the nonlinearity — 128K opens up while 200K/256K stay floored — is solid.
Mystery solved: the 128K sweet spot survives the stress tests
With 128K being the only setting with real headroom, I moved my daily setup back to 128K and ran a battery of stress tests against it (2026-06-22) to confirm it was genuinely stable and not just lucky:
| test | what | result |
|---|---|---|
| concurrency | 4 requests (--parallel 1, queued) | all returned OK |
| checkpoint flood | 10 × 8K back to back | LRU evicts cleanly (erased invalidated → created), no crash |
| near-limit prefill | one 110K shot | no crash |
| VRAM stability | watched throughout | rock-steady, ~2086 free |
The checkpoint flood one is especially telling: feed it ten 8K segments and you can watch the checkpoint pool do LRU eviction in the log — created context checkpoint N of 8 paired with erased invalidated context checkpoint. That proves one thing: the checkpoint pool is bounded (--ctx-checkpoints 8, down from the default), LRU-dropping the oldest when full, not growing without bound. But remember the reversal from the last section: that pool is in host RAM, not VRAM — 8 × ~280 MiB ≈ 2.2GB is a host-RAM peak, a line worth watching on a 16GB box (which is why I dropped it from 32 to 8), but it has nothing to do with this card's VRAM free.
128K is stable on the VRAM side: the KV cache is shorter, which leaves ~2GB of real VRAM headroom to absorb the scratch spikes of a forward pass. 256K crashes for the opposite reason — only 170 MiB free, too thin to absorb any spike at all.
The honest twist: 128K still threw one crash, and I won't pretend otherwise
Ending the post here would make for too clean a story. But there's a twist, and I think it's worth more than a perfect bow on top.
128K isn't crash-free. After all the stress tests passed, I still saw one crash under real load (input ~54K): the same Windows Event 0xc0000409, a fail-fast abort. I'd armed the crash-log by then (keeping .prev-<timestamp> stderr captures plus a service-events log), but this time it caught no fresh ggml error line — the events log only recorded two clean restart timestamps:
2026-06-22T01:45:29 starting qwen-128k
2026-06-22T02:12:45 starting qwen-128k
Two restarts about 27 minutes apart, both auto-recovered — but I haven't 100% confirmed the root cause of that crash.
So the accurate framing is: 128K turns the crash from "blows up every few turns at 256K" into "a rare one-off, root cause still open" — not "fixed." For a resident agent, "a rare one-off plus auto-restart" is acceptable (the client takes an occasional 503 and a retry brings it back); "blows up every few turns" is not. That's the difference. I'm laying the limits out in the open — I'm not hiding that 128K crash.
The mechanism: why this brain's checkpoints are both large and quick to invalidate
The last piece: why are this brain's checkpoints so large (in host RAM), and so quick to invalidate and force a recompute? The clues point at the architecture.
Qwen3.5/3.6 are hybrid models — not pure-transformer full attention, but linear/recurrent attention (Mamba2/SSM-style recurrent memory) mixed with some full attention. That hybrid design explains the whole chain of symptoms above.
And it isn't just my own oddity. There's an open llama.cpp issue filed against the exact same model — #22746, "Eval bug: Qwen 3.6 27B forcing full prompt re-processing due to lack of cache data" (Open) — the model named in the title and the error message both match, word-for-word, what I see in my live log.
There's an earlier issue in the same model family, on Qwen 3.5: #20225, "Eval bug: Qwen 3.5 Full prompt re-processing on every conversation turn" (filed 2026-03-08, closed as completed the same day): every turn of a multi-turn conversation is forced into full prompt re-processing, so a 15k-token conversation re-computes ~8 minutes per turn. The cause cited there is "the recurrent memory's pos_min always exceeding the SWA-based pos_min_thold threshold" — in plain terms, the checkpoint logic was designed for SWA (sliding-window attention) and doesn't correctly handle the recurrent-memory semantics of a hybrid model, so checkpoints get marked invalid at the drop of a hat and the whole segment recomputes.
⚠️ On versions: this brain runs 3.6, and the live issue that matches it is #22746 (open, same model). #20225 is filed against 3.5 and is already closed — I cite it as a same-family precedent because it spells out the
pos_mincause most clearly, not as the 3.6 issue.
And the live log does catch full-reprocessing happening (verbatim — the same line as #22746's title):
forcing full prompt re-processing due to lack of cache data
(likely due to SWA or hybrid/recurrent memory, ...)
To sum up the mechanism: the hybrid architecture makes checkpoints both large (they have to store recurrent-memory state) and quick to invalidate (the checkpoint logic isn't aligned with hybrid semantics). "Large" is what pressures your host RAM (a real line on a 16GB box); "quick to invalidate" is what makes a single miss recompute the whole segment and spike TTFT into the minutes. Note this is a separate thread from the VRAM culprit: VRAM ran out because of the KV cache (this post); checkpoints invalidating → recompute → why 30 tok/s feels slower than 14 is the next post. And I frame this as the mechanism that explains the symptoms, not the single confirmed root cause of that crash — the latter (0xc0000409) I already flagged above as still uncaught.
Rules you can carry to another card
The post, distilled into a few rules:
- "Context the model supports" ≠ "context your card runs stably." The real ceiling is whether VRAM headroom can hold the KV cache (which grows linearly with context) plus its runtime scratch (compute buffer / draft state), not whether the weights fit.
- "It loaded" is not a green light, just a wall you haven't hit. A hybrid model's KV cache grows with context; stress-test under real long conversations + concurrency + checkpoint flood, not just a cold start that didn't error.
- Free-VRAM-vs-context can be nonlinear. Don't assume dropping context trades linearly for headroom; measure the curve, because it may take a whole tier (here, 200K → 128K) to move.
- Budget VRAM and system RAM separately, with headroom for each. VRAM goes to the KV cache + compute buffer that grow with context (that's where 256K blew up); host RAM goes to the context-checkpoint pool (~280 MiB each,
8 × ~280 ≈ 2.2GBat--ctx-checkpoints 8, especially tight on a 16GB box). The easiest trap is conflating the two — I myself mistook a host-RAM pool for the VRAM culprit. Size your card for "weights + KV + VRAM scratch," and don't forget system RAM when you size the box.
What's next
This post tracked that 170 MiB sliver all the way down: the real culprit is the KV cache eating VRAM (the checkpoint turned out to live in host RAM — I read the source to be sure), free-VRAM-vs-context is nonlinear, and the reason those checkpoints are large and quick to invalidate is the hybrid architecture. But half the story is still untold — a checkpoint miss forces a full recompute, and that's the culprit behind "30 tok/s of decode that feels slower than 14 tok/s on another box": what you're feeling isn't decode, it's TTFT. That's the next hard-core post.
This post and the GTX 970 series are the same lesson at opposite scales: there it was "small-card context economics" on 4GB Maxwell + SWA; here it's 22GB Turing + hybrid. The card is an order of magnitude bigger, but "context isn't however big you set it" hasn't budged at all.
Also in this series:
- (previous) I gave up 100 tok/s for 30: fast Gemma 12B walks away when it's done, slow Qwen 27B actually closes the loop (that 503 was planted there)
- Series opener: an NT$11k modded card hosts a 27B agent (how this brain got here)
- (next · hard-core) Why 30 tok/s feels slower than 14: checkpoint misses, full reprocessing, and TTFT
Prequel:
- GTX 970 series, Part 3: on an old card, Flash Attention nearly doubles long-context decode (the same "small-card context economics" theme)
FAQ
- The model supports 256K context, so why can't my 22GB card run it at 256K?
- Because "context the model was trained to support" and "context your card can run stably" are two different things. At 256K this card *loads* (it's not a load-time OOM), but once loaded it has only about 170 MiB of free VRAM. The real ceiling isn't whether the weights fit — it's whether there's headroom for the KV cache, which grows linearly with context. At 256K the KV cache eats nearly all of that ~6GB and leaves ~170 MiB — thin enough that any runtime-scratch spike can tip it over. (I first blamed context checkpoints; reading the source, checkpoints actually live in host RAM, not VRAM — covered in the post.)
- Is the context checkpoint the thing eating my VRAM?
- No. A context checkpoint is how llama.cpp avoids re-processing the whole prompt every conversation turn: it caches the intermediate state so the next turn can warm-restore from it. But reading the llama.cpp source (`common_prompt_checkpoint`), it's stored in host RAM (a `std::vector<uint8_t>`, read back off the GPU), not VRAM — ~250-300 MiB each, taken from that 16GB box's system memory. It's large and easy to invalidate on a hybrid model, which makes it the star of the next post (why TTFT blows up) — but it is not what starves your VRAM here. The KV cache is.
- So dropping context from 256K to 200K frees up headroom, right?
- Barely. In my tests, 256K leaves ~170 MiB free and 200K leaves ~164 MiB — dropping 56K bought almost no headroom (the KV you shrank gets eaten back by other scratch). Free-VRAM-vs-context is nonlinear: you have to drop all the way to 128K before free opens up to about 2GB. Don't assume dropping context trades linearly for headroom — measure the curve, because you may need to drop a whole tier before it moves.
- Is 128K guaranteed never to crash?
- No, and I won't claim that. 128K turns the crash from "blows up every few turns" into "a rare one-off, root cause still open": the battery of stress tests (concurrency, checkpoint flood, near-limit prefill) all passed with VRAM holding rock-steady at ~2GB free, but I still saw one crash under real load (0xc0000409), which auto-recovered, and I haven't 100% pinned the root cause. 128K is the only stable sweet spot so far — not a zero-crash guarantee.