改裝 2080 Ti 22G · part 8
[Just for Fun — Advanced] I Doubled My Agent's Decode Speed and It Got Slower: TTFT Is the Number You Actually Feel
❯ cat --toc
- The short version: you don't feel "how fast tokens come out" — you feel "how long until they start"
- The 27B brain's first hidden cost
- The vanity metric: tok/s measures the second half, not the first
- The receipts: Hina's own log — 2.6s warm vs 216s cold
- The root cause: why a miss is so brutal — hybrid re-prefills everything
- How expensive is a cold start? Prefill gets slower as the prompt grows
- Salt in the wound: multi-tool turns multiply the tax
- Decode is bandwidth-bound — the only lever is cache
- The bottom line
- What's next
TL;DR
I swapped my agent's brain from 14 tok/s to 30-40 — and it felt slower. The speed you actually feel is TTFT (how long until the first token), not tok/s (how fast they come after that). Hina's brain (Qwen3.6-27B) is a hybrid architecture, and mainline llama.cpp can't reuse the prefix cache on hybrids — one cache miss re-prefills the whole prompt. Same box, same brain: 2.6s warm, 216s cold — an 83x swing that never shows up in the decode number. This is a case study, not a benchmark; read it as a story.
The short version: you don't feel "how fast tokens come out" — you feel "how long until they start"
Picking a local model, everyone looks at tok/s first — tokens per second. I did too, for almost a year. So when I swapped my home agent's brain from one that spat out 14 tokens a second to one that does 30-40, I expected it to feel obviously faster.
It felt slower.
It took me a full day to work out why. The problem wasn't decode — token for token, the new brain really is twice as fast. The problem was the wait between hitting send and the first token appearing. That wait has a name — TTFT, time-to-first-token — and the tok/s number I'd been worshipping doesn't measure it at all.
Worse, on this brain that wait can explode. The architecture (hybrid) has a quirk: on any cache miss, it has to re-read everything you've said so far before it can answer. When the cache is warm, that wait is a couple of seconds. The moment the cache is gone — a service restart wiped it, or another conversation took the slot — the wait on the same message can stretch to three minutes.
This post is that lesson in full: why tok/s is a vanity metric, why TTFT is the number to watch, and the root cause underneath it all — a hybrid brain that can't reuse its cache.
The 27B brain's first hidden cost
The earlier posts covered how this brain got here (#1: a second-hand 22GB-modded 2080 Ti) and why I chose it (#2: the slow Qwen 27B holds a procedure better than the fast Gemma 12B). Later posts shipped the fixes — the disk-KV restore and the tool-definition tax — but I never wrote up the failure mode that sent me hunting for them: the first counterintuitive problem I hit after putting the card into service. This is that post.
Here's the setup. I actually run two agent brains:
- ds4 (DeepSeek-V4-Flash, abliterated), running on another machine (a GB10), decoding at ~14 tok/s — slow.
- Hina (Qwen3.6-27B Q4_K), the one this modded 2080 Ti hosts, decoding at ~30-40 tok/s — more than twice as fast.
By tok/s, Hina is the "faster" brain. In actual use, the slow one — ds4 — feels smoother.
⚠️ Let me nail this down: this is not a benchmark. The 14 runs on a GB10 (Blackwell), the 30 on a 2080 Ti (Turing) — two different models on two different GPUs, and the 14 figure is from older notes, not a same-hardware paired re-measurement. This is a real lived experience, not a controlled experiment. Read it as a case study.
So why does the slow one feel better? Because I was watching the wrong number.
The vanity metric: tok/s measures the second half, not the first
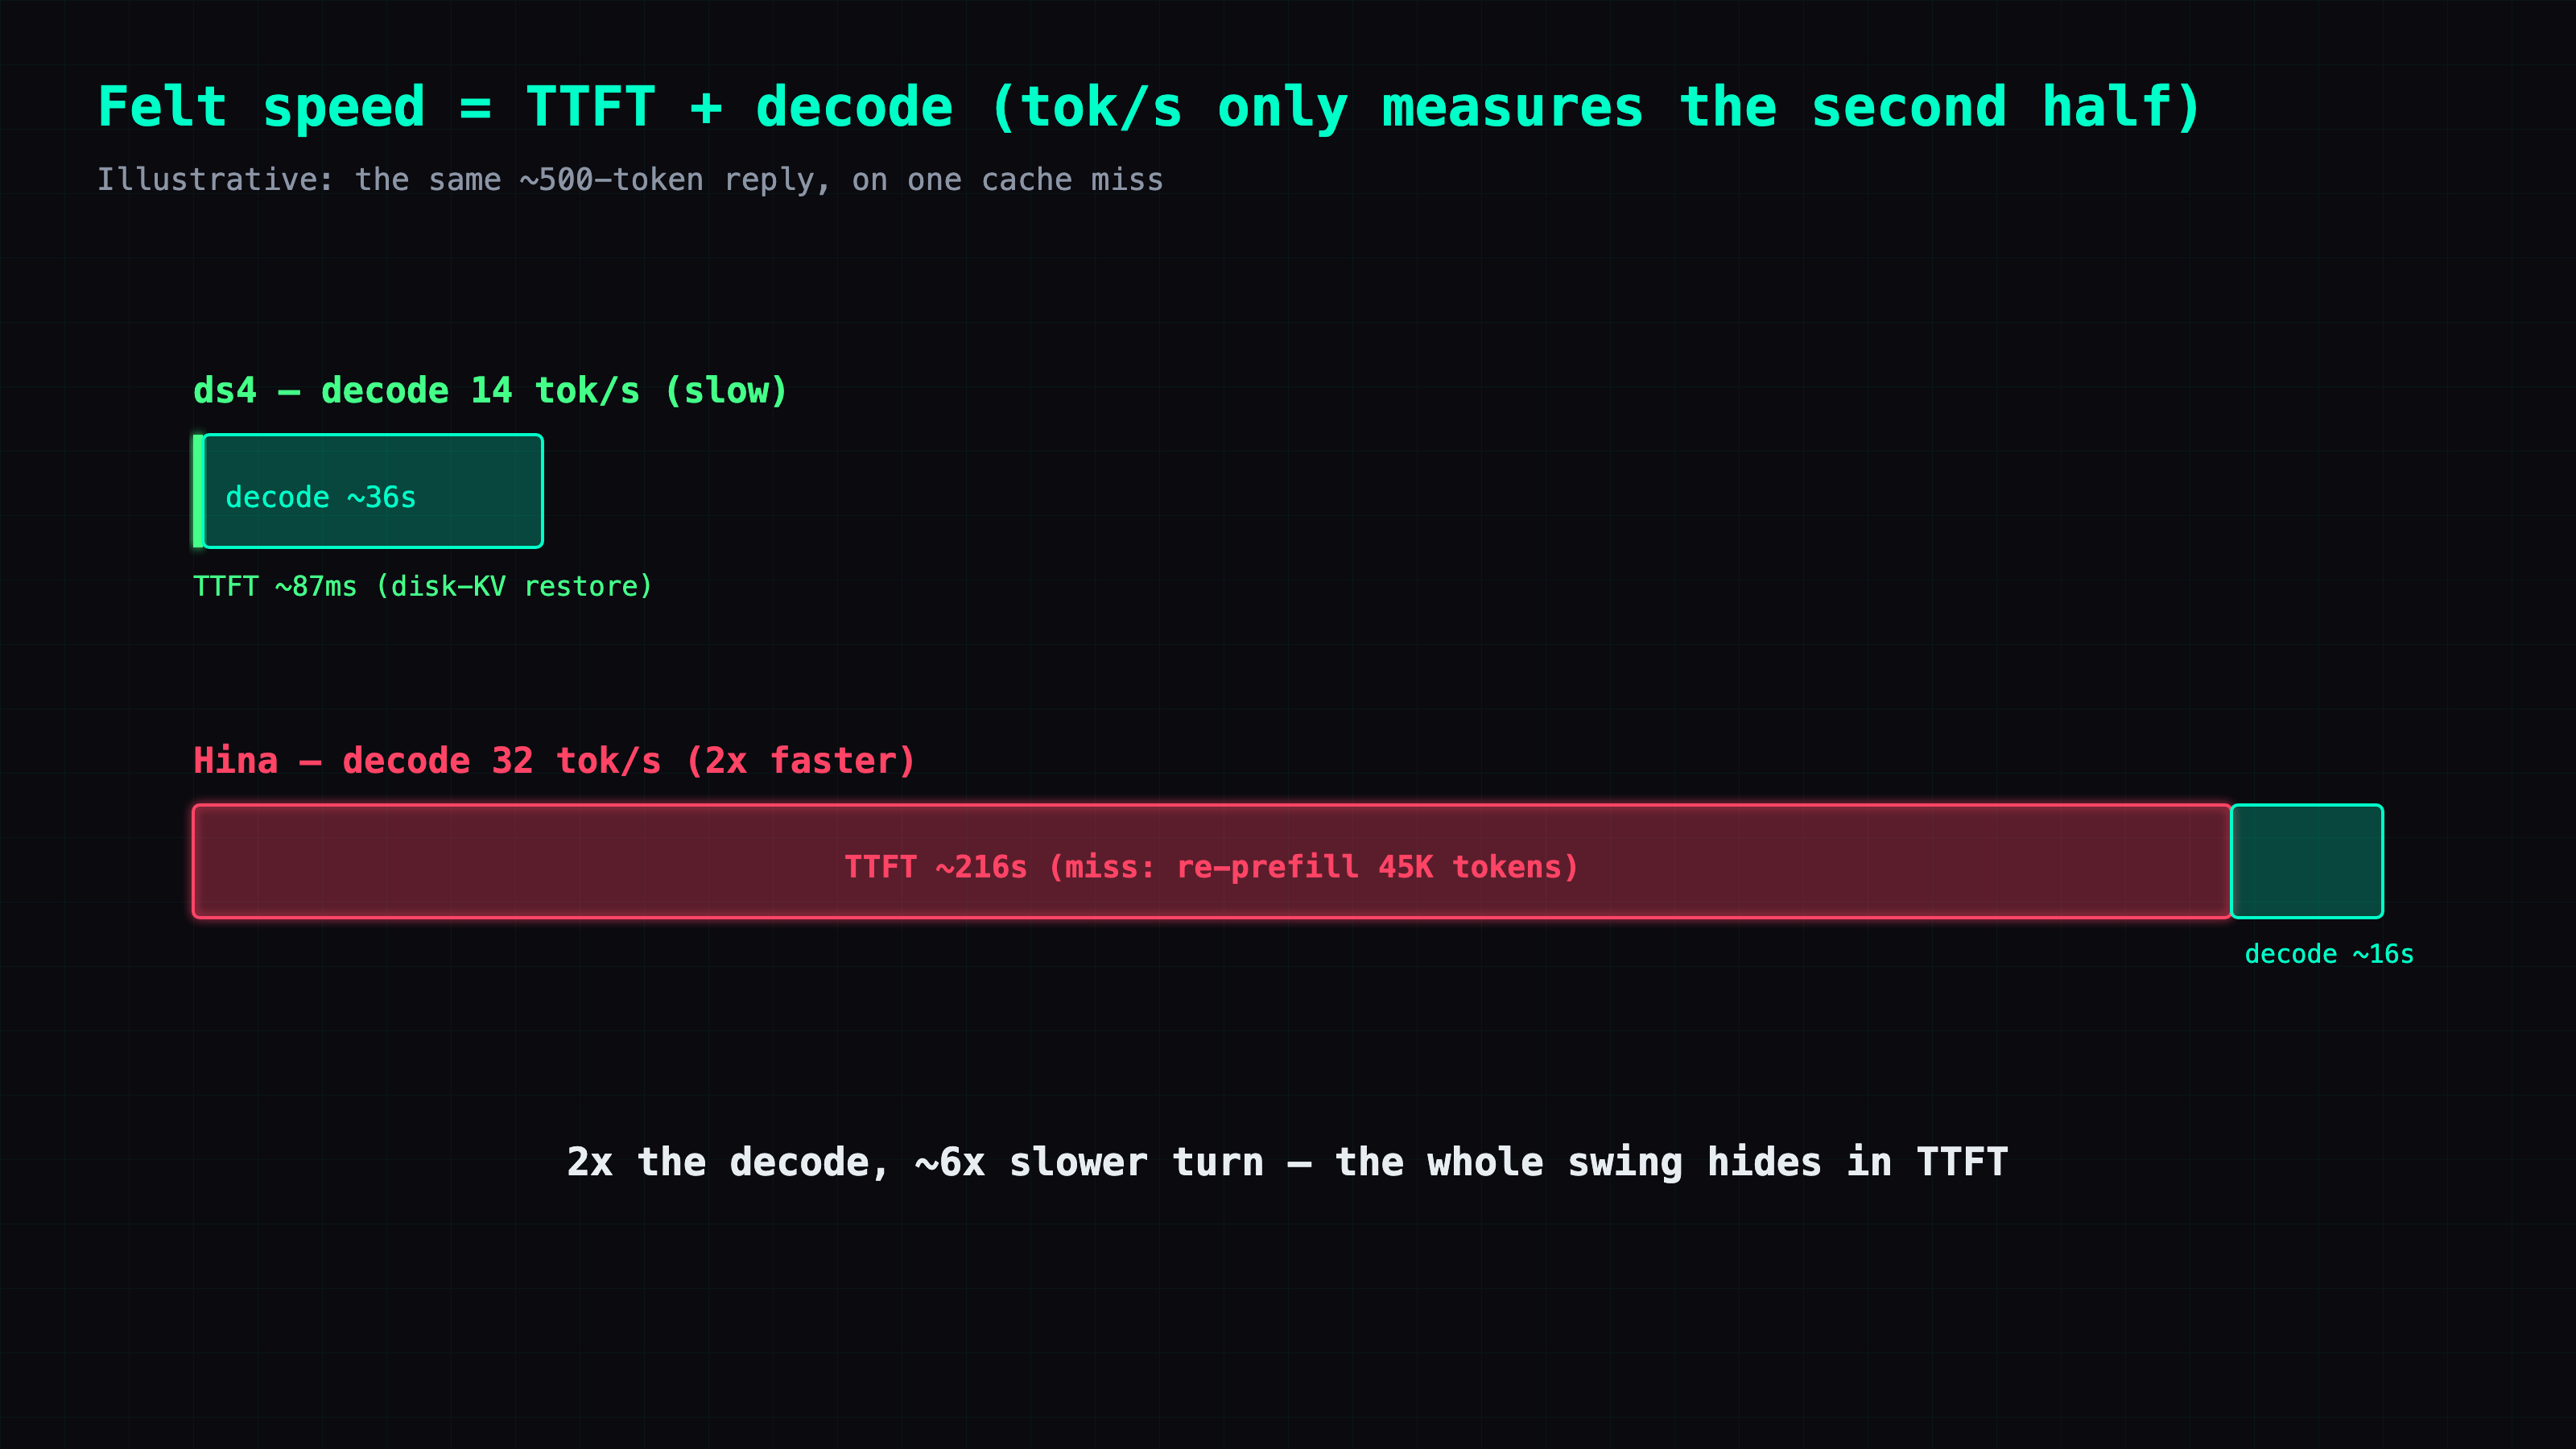
A single turn — from when you hit send to when you've read the whole reply — actually splits into two phases:
- TTFT (time-to-first-token): from sending to the first token appearing. In this window, the model has to read the entire prompt (system message + tool definitions + your prior conversation + the new line), compute its state — an operation called prefill. The longer the prompt, or the worse the cache hit, the longer this takes.
- Decode: after the first token, how fast the rest come out. This is what tok/s measures.
Note: tok/s only measures phase two. It tells you nothing about how long phase one takes.
For pure chat — short prompts, fast prefill — TTFT is negligible, so tok/s roughly equals felt speed. That's why I leaned on it so confidently for a year: I was mostly chatting. But for an agent, the prompt is anything but short. The tool definitions alone eat seventeen thousand tokens off the top (the bill the tool-definition tax post itemizes), and with a long conversation the prompt routinely runs to 30-50K tokens. At that point TTFT isn't just non-negligible — it dominates the whole turn.
That's exactly where my "fast" Hina falls down.
The receipts: Hina's own log — 2.6s warm vs 216s cold
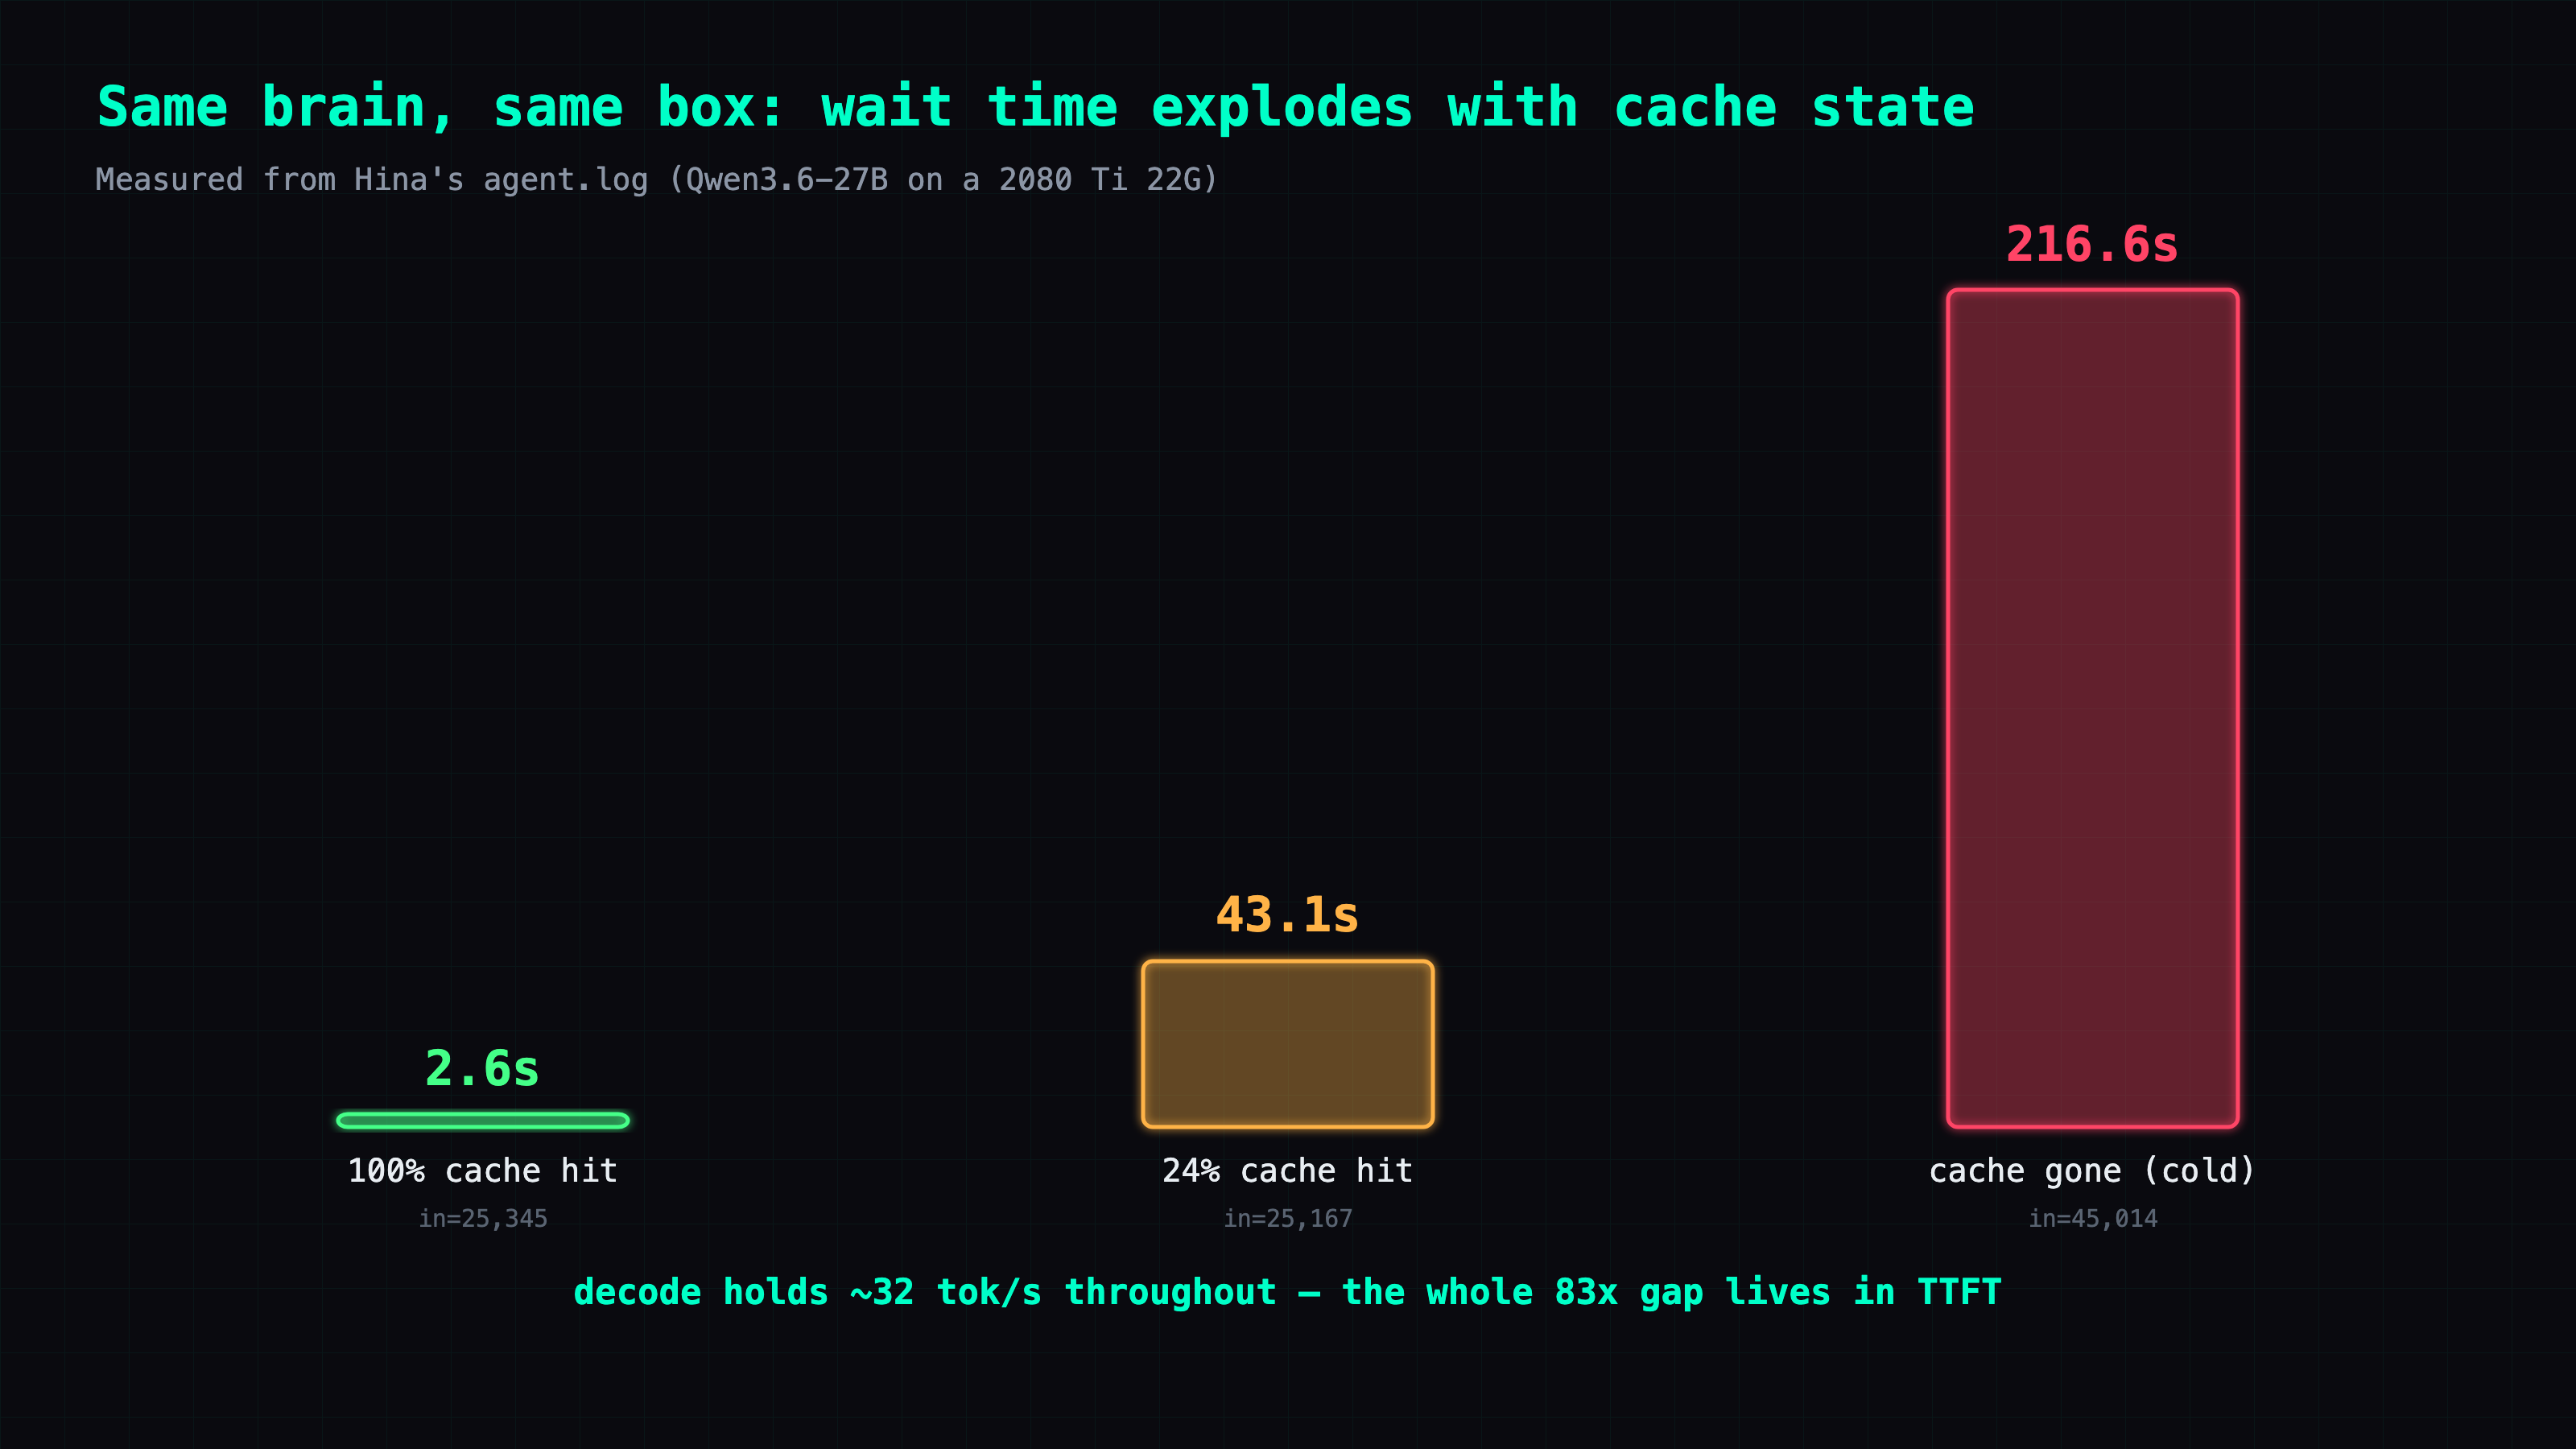
Reasoning about it only gets you so far, so here are the consecutive API calls Hina's agent framework actually logged. These are all [live] from the log — same Qwen brain (model=qwen36-27b), same stretch of time. in= is prompt tokens, cache= is how much of the prefix hit cache this turn, latency is the wall-clock wait for the whole turn:
| prompt tokens (in=) | cache hit | wait | what happened |
|---|---|---|---|
| 25,345 | 100% | 2.6s | warm — prefix fully cached |
| 46,101 | 100% | 11.4s | warm, longer context |
| 47,928 | 98% | 185.2s | 98% hit, deep context — still a 3-minute wait |
| 25,167 | 24% | 43.1s | big miss |
| 45,014 | (no cache line) | 216.6s | cold — server no longer had this conversation's cache |
| 49,796 | (cold) | 230.6s | cold, full re-prefill |
| 48,953 | (cold) | 211.2s | cold, full re-prefill at ~49K |
The contrast is the whole point: same brain, same box — the warm turn takes 2.6 seconds, the cold turn takes 216.
An 83x swing. And that 83x is completely invisible in the decode tok/s number — decode stays at ~32 tok/s throughout; the whole swing hides in TTFT.
One detail from the log: those "cold" rows (in= 45-50K but no cache-hit line, waiting 200+ seconds) didn't come from nowhere — each one is the first call of a fresh conversation loop, and the server no longer held that conversation's computed state. Where did the state go? The serving chain restarted more than once that night: the llama-server service log on forge rotated at 01:45 and 02:12 (a llama-server restart wipes the in-RAM prompt cache), and the gateway on the fleet host got stopped by a signal at 02:11:49 (log verbatim:
Gateway stopped by an unexpected signal→02:11:51 Starting Hermes Gateway). And even with nobody restarting anything, another conversation grabbing the cache slot does the same thing. Once the state is gone, a hybrid has nothing to resume from — it re-reads all 45-50K tokens. That's the cache-loss tax made visible — and it's exactly the problem the disk-KV post later solved.
The root cause: why a miss is so brutal — hybrid re-prefills everything
Waiting 200 seconds for a single turn sounds absurd. A normal model shouldn't do this — it should only re-process the line you just added and pull the prior tens of thousands of tokens from cache. So why can't Hina?
Because Hina's brain is a hybrid architecture: Qwen3.6 mixes standard attention with Gated DeltaNet linear-attention layers that carry recurrent state — llama.cpp treats those as recurrent memory. And mainline llama.cpp can't reuse the prefix cache on hybrid + SWA models. That's not my guess; the llama-server log says so explicitly. The lines below are [live] from forge, verbatim:
slot update_slots: id  0 | task 282 | forcing full prompt re-processing
  due to lack of cache data (likely due to SWA or hybrid/recurrent memory,
  see https://github.com/ggml-org/llama.cpp/pull/13194#issuecomment-2868343055)
slot update_slots: id  0 | task 282 | erased invalidated context checkpoint
  (pos_min = 44, pos_max = 44, n_tokens = 45, ... size = 62.813 MiB)
Read the two lines together (both [live] from forge, verbatim): the first says "forcing a full prompt re-process because there's no cache data (likely due to SWA or hybrid/recurrent memory)"; the second says it marked a context checkpoint invalid and erased it (erased invalidated). In other words, even with a previously-computed state on hand, the hybrid architecture leaves no way to continue from it — it gets invalidated, discarded, and recomputed from scratch.
llama.cpp's PR discussion states the trade-off plainly:
- PR #13194 ("kv-cache : add SWA support," merged) spells it out: SWA / hybrid models get "no prefix cache in llama-server, no context shift, no context reuse" — "when the window slides, we 'forget' the old KV stuff and there is no way to recover it without recomputing it." That's what triggers the log line above.
- Issue #20225 ("Qwen 3.5 Full prompt re-processing on every conversation turn," a closed eval-bug report) confirms it's this exact model family — "Qwen 3.5 27B (hybrid attention + Mamba2/SSM) forces full prompt re-processing on every conversation turn," with a 15K-token conversation taking "~8 minutes per turn instead of seconds." (⚠️ The title says Qwen 3.5; forge runs 3.6 — same hybrid family, same bug. "Mamba2/SSM" is the reporter's wording; Qwen's model card calls the linear-attention layer Gated DeltaNet. I cite it as a hybrid limitation confirmed in practice rather than splitting hairs over its open/closed status.)
So the root problem here isn't "too much context" and it isn't "too many tools" — it's that hybrid models can't reuse the cache. With a stable prefix and a warm cache, a normal transformer doesn't hit this: it prefills the prefix once and reuses that cache turn after turn. Keep that straight, or you'll fix the wrong thing.
How expensive is a cold start? Prefill gets slower as the prompt grows
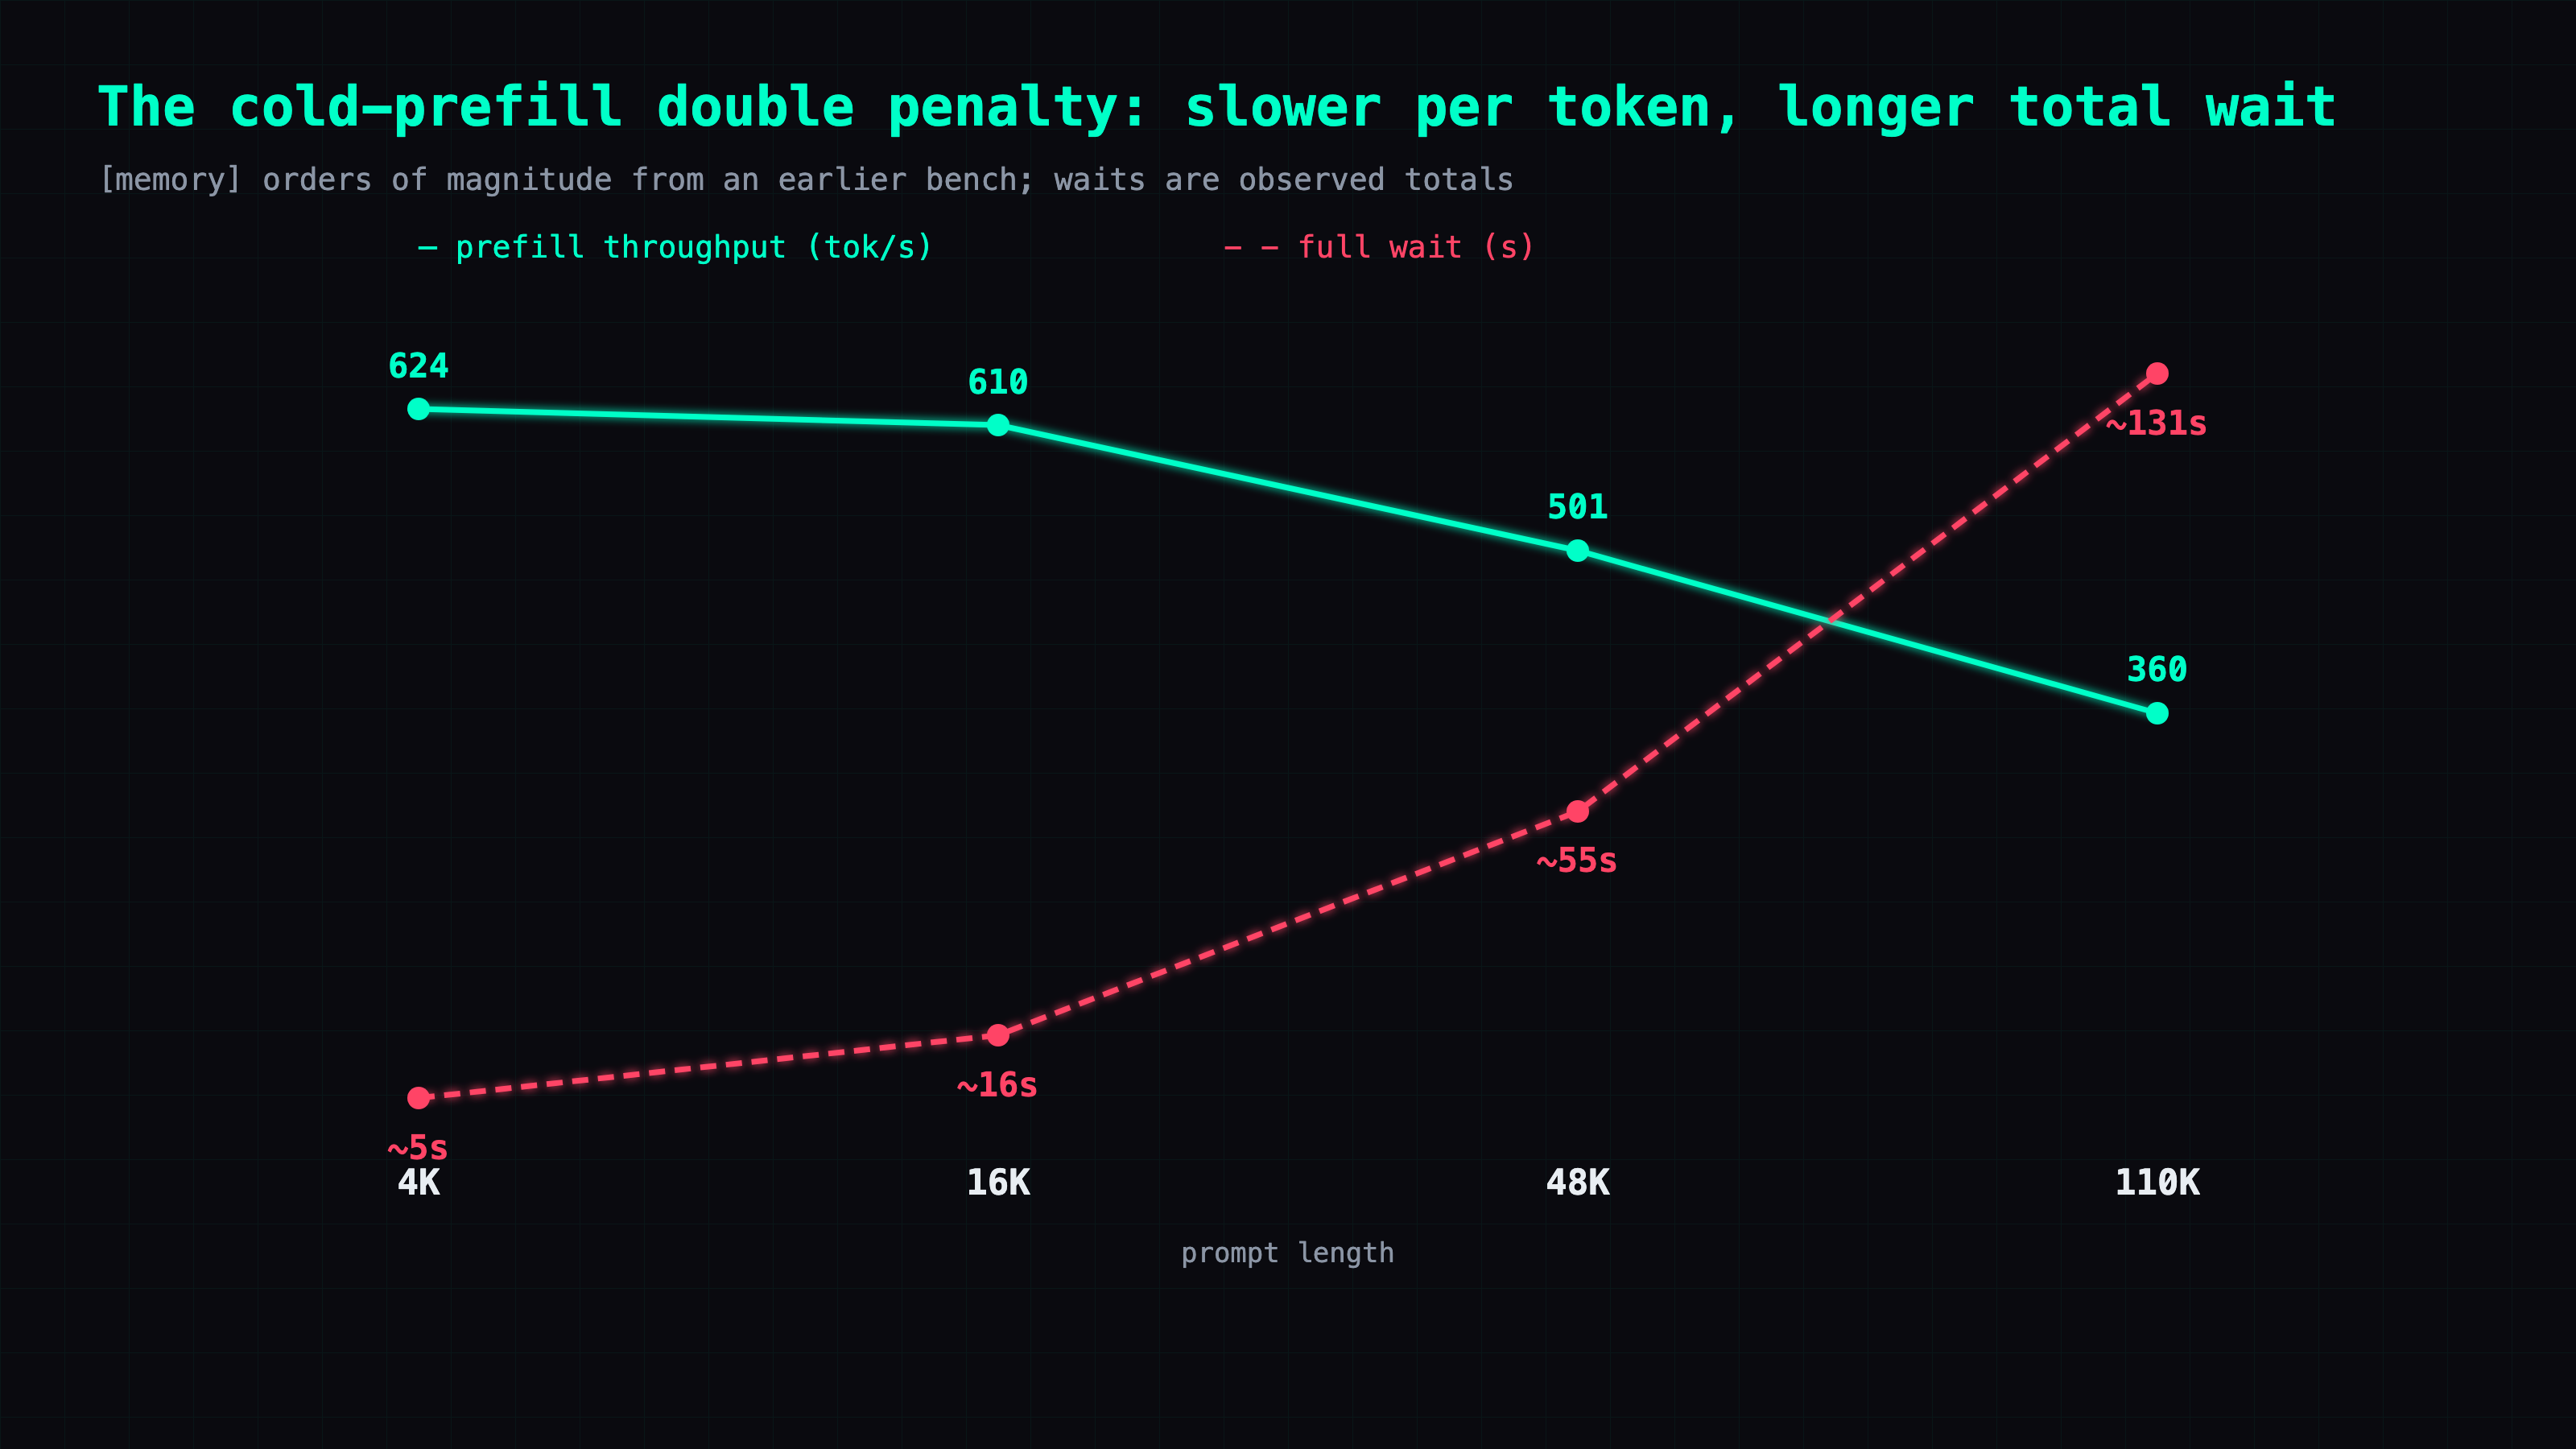
So how expensive is a full re-process? It's just prefilling the whole prompt again, and prefill's cost climbs with prompt length — and, worse, the throughput drops as the prompt grows:
| prompt length | cold prefill throughput | cold full wait |
|---|---|---|
| 4K | 624 tok/s | ~5s |
| 16K | 610 tok/s | ~16s |
| 48K | 501 tok/s | ~55s |
| 110K | 360 tok/s | ~131s |
⚠️ This 4K→110K scaling curve is from [memory] (measured in an earlier bench session), not re-measured on the same hardware this session — treat it as orders of magnitude (the wait column is the observed full wait at the time, not a tokens-divided-by-throughput calculation). It's worth distinguishing two kinds of prefill: the warm append kind (it only processes the short new turn and pulls the prefix from cache) is cheap — warm bulk prefill was measured at ~496-540 tok/s at 31-43K context [memory]; the expensive kind is the full cold re-prefill that crawls like the table above. Decode held at ~34-38 tok/s live on forge this session [live], consistent with the ~32-40 figure.
Line the table up against the log table and it all clicks: a 45-50K-token conversation, cold-started and fully re-processed, simply takes one to two-plus minutes — which matches the 200+ second cold rows in the log. When warm and hitting cache, continuing the same conversation takes two or three seconds.
Salt in the wound: multi-tool turns multiply the tax
Agents have one more amplifier. A single "user turn" often isn't one API call — the model calls a tool, gets a result, thinks, calls again, back and forth. Each tool round-trip sends a fresh, longer prompt; on a hybrid, each miss is another full re-prefill.
In Hina's logs, tool round-trips per user turn (tool_turns) routinely land between 2 and 13 — tool_turns=13 alone shows up 14 times, and busy turns spike as high as 39. A turn with 9 tool round-trips that each miss = 9x the re-prefill tax. That's the bill the tool-definition tax post itemizes — those 17K of tool definitions get re-read, round after round, in turns like these.
Decode is bandwidth-bound — the only lever is cache
Finally, let me put decode back in its place.
Decode itself is bandwidth-bound: whether context is 4K or 110K, memory bandwidth stays pinned (mem clock at 6800MHz), so decode sits at ~32 tok/s pretty much regardless of length. Which means: you can't make the agent feel snappier by shrinking context to speed up decode — decode doesn't move with context at all.
So where's the lever for responsiveness? Entirely on the TTFT / cache side. Hit cache warm, TTFT is two or three seconds; miss cold, TTFT is two hundred. Making it feel faster means getting more turns to hit cache and keeping that cache from being wiped. That's exactly why this series has a post on the 17K tool-definition tax (can those definitions avoid being re-processed every round?) and one on where the KV cache should live (how do you keep it from evaporating?).
And why does the "slow" ds4 feel smoother? Because its setup (a DeepSeek custom build with automatic disk-KV) can pull a 50K-token prefix back off disk in ~87ms — it barely pays the re-prefill tax at all.
⚠️ Full disclosure: ds4's 87ms is measured on a DeepSeek custom build with automatic disk-KV, not stock llama.cpp — that's an uneven infrastructure comparison, but it's exactly the point: what decides the feel is whether you pay the re-prefill tax, not how fast you decode. One side barely pays it; the other pays 200 seconds the moment it misses. That 2x decode gap doesn't come close.
The bottom line
To boil this post down to one line:
Decode tok/s is a vanity metric; the speed you actually feel is TTFT + decode. On a hybrid brain, a single cache miss re-processes the entire prompt, and at 45-50K context that TTFT can blow past 200 seconds — at which point twice the decode speed is something you'll never feel. I swapped my agent's brain from 14 tok/s to 30 and it felt slower, not because the new brain is bad, but because I was measuring the wrong thing.
| ds4 | Hina (2080 Ti) | |
|---|---|---|
| decode tok/s | ~14 | ~32 |
| TTFT on a cache miss | ~87ms (disk-KV restore) | full re-prefill, ~200-230s in this batch |
| felt speed | smooth | bursty: snappy warm, stalled cold |
Pick a GPU by VRAM and judge chat by tok/s — but if you're hosting an agent, the number to watch is TTFT.
What's next
This post covered "why a miss hurts so much." The cures are already up in this series: the tool-definition tax itemizes the 17K-token bill that gets re-prefilled on every miss, and the disk-KV proxy shows how to make the cache survive a crash and restore 7x faster than re-prefilling. And this slow brain has one more felt-speed trap — it responds so slowly that merely turning on progressive streaming got the bot rate-limited by Telegram's flood control.
Also in this series:
- (previous) Progressive streaming on a slow model got my bot rate-limited by Telegram
- Gemma 12B vs Qwen 27B: why I gave up 100 tok/s for 30
- The tool-definition tax: 17K tokens before I say a word
- llama.cpp won't persist KV cache to disk — so I put a 60-line proxy in front of it
Prequel:
- GTX 970 series, Part 3: on an old card, Flash Attention nearly doubles long-context decode (last series I found FA flips the intuition about what's in the KV cache; this series, the intuition that flips is decode tok/s itself)
FAQ
- If decode tok/s is higher, why does it feel slower?
- Because the speed you actually feel is TTFT (time-to-first-token — from sending to the first token appearing) plus decode (tokens per second after that). tok/s only measures the second half. My Hina brain (Qwen3.6-27B, ~30-40 tok/s) genuinely decodes more than twice as fast as the other box's ds4 (~14 tok/s) — but the moment Hina misses cache, it re-processes the entire prompt from scratch, and at the ~45-50K context I measured, TTFT blows past 200 seconds. Once the first half explodes, no amount of fast decode in the second half can save the turn. tok/s is a vanity metric.
- Why does a single cache miss re-process the whole prompt? Don't other models avoid that?
- Because Hina's brain is a hybrid architecture (Qwen3.6 = standard attention mixed with Gated DeltaNet linear attention, which carries recurrent state). Mainline llama.cpp can't reuse the prefix cache on hybrid + SWA models — when the window slides, the old token information is lost, so it can't just append the new tokens; it re-prefills everything. llama.cpp says so itself, right in the server log (with a PR link). A normal transformer with a stable prefix doesn't do this: it prefills the prefix once and reuses that cache turn after turn. So this isn't a 'too much context' problem — it's a 'hybrid can't reuse cache' problem.
- So the 30-40 tok/s decode is a lie?
- Not a lie — misapplied. Decode is bandwidth-bound: whether context is 4K or 100K, memory bandwidth stays ~616 GB/s, so decode sits in roughly the same range regardless of length. The problem is it only reflects how fast tokens come out once you're warm. When a turn's time is dominated by TTFT, fast decode can't salvage the experience. The only lever for how responsive it feels is cache / TTFT, not decode.
- Is this a benchmark? Is 14 vs 30 an apples-to-apples comparison?
- No — it's a case study. The 14 tok/s ds4 runs on a GB10 (Blackwell); the 30 tok/s Hina runs on a modded 2080 Ti (Turing) — two different models on two different GPUs, and the 14 figure is from older notes, not a same-hardware paired re-measurement. So this isn't a controlled comparison; it's a real lived experience: a brain that decodes slowly but never re-prefills can feel faster than one that decodes fast but re-prefills the whole prompt. Read it as a story, not a paper.
Read next
- 2026-06-26[Just for Fun — Advanced] llama.cpp won't persist KV cache to disk — so I put a 60-line proxy in front of it (7× faster restore)
On a long conversation, every message makes the model re-read the whole thing (re-prefill) before it answers — worst right after a restart or a cache eviction. Stock llama.cpp can save the KV cache to disk (--slot-save-path) but won't do it on its own — the auto-persist feature request is closed as not planned. A tiny stdlib reverse-proxy restores instead of re-prefilling: 9.9s → 1.4s on a 5K chat (7×). Mechanism, proxy design, and why I haven't shipped it yet.
- 2026-06-27[Just for Fun — Advanced] The Tool-Definition Tax: 17K Tokens Before I Say a Word, Re-Billed on Every Cache Miss
I added up what my home agent pays before it reads a single word from me: ~23K tokens of overhead, and 17K of that is just the instruction manuals for its tools. Worse, it runs a hybrid model — on a cache miss it re-processes all 17K from scratch, and a single user turn can do that a dozen-plus times. This is context economics, badly underestimated. The fix isn't cutting tools; it's loading them on demand, the way skills already do.
- 2026-06-25[Just for Fun — Advanced] Quantizing the Draft Cache Backfired — A Counterintuitive Look at Qwen MTP (f16 ran 34% faster than q4)
Quantizing the main KV cache to q4 to save memory is fine. So I quantized the MTP draft cache too — it's just a little draft, surely a free win. It wasn't: q4 draft cache ran 29.6 tok/s, the un-quantized f16 ran 39.7, and f16 used less VRAM on top of that. The draft cache is one of the few places where quantizing is a net loss — here's the triple penalty.
- 2026-06-24[Just for Fun — Advanced] I Maxed Context to 256K, It Loaded Fine — Then Crashed in Real Use: A VRAM Detective Story on a 22GB Frankencard
The model card says n_ctx_train=262144. The card has 22GB. The 27B's Q4 weights are only 15.7GB. The math looks obvious: max it to 256K, plenty to spare. -c 262144, launch — loads fine, no error. A few turns of real conversation later: 503, the service restarts itself. No tidy out-of-memory in the log, just a lone 0xc0000409. nvidia-smi: free VRAM down to ~170 MiB. Where did the gigabytes go? This is the hunt: I first blamed context checkpoints, but the llama.cpp source says they live in host RAM — the real VRAM eater is the KV cache; free-VRAM-vs-context is nonlinear, and the one stable sweet spot isn't 256K — it's 128K.
Don't miss the next one
Subscribe, and you won't.
One-click unsubscribe anytime.