改裝 2080 Ti 22G · part 10
[Just for Fun — Advanced] Two Identical 2080 Tis, One 3.4× Slower — the Culprit Was a Single dtype Log Line
❯ cat --toc
- The short version: same card, one dtype line, 3.4×
- Two identical 2080 Tis, one 3.4× slower on the same job
- The three suspects I cleared
- The break: two log lines
- The one-flag fix: `--force-fp16` → 3.37×
- What it does NOT do: save VRAM
- Why video got nothing: the speedup is model-family-specific
- Takeaways
- The checklist: chasing a "slow card" that isn't
TL;DR
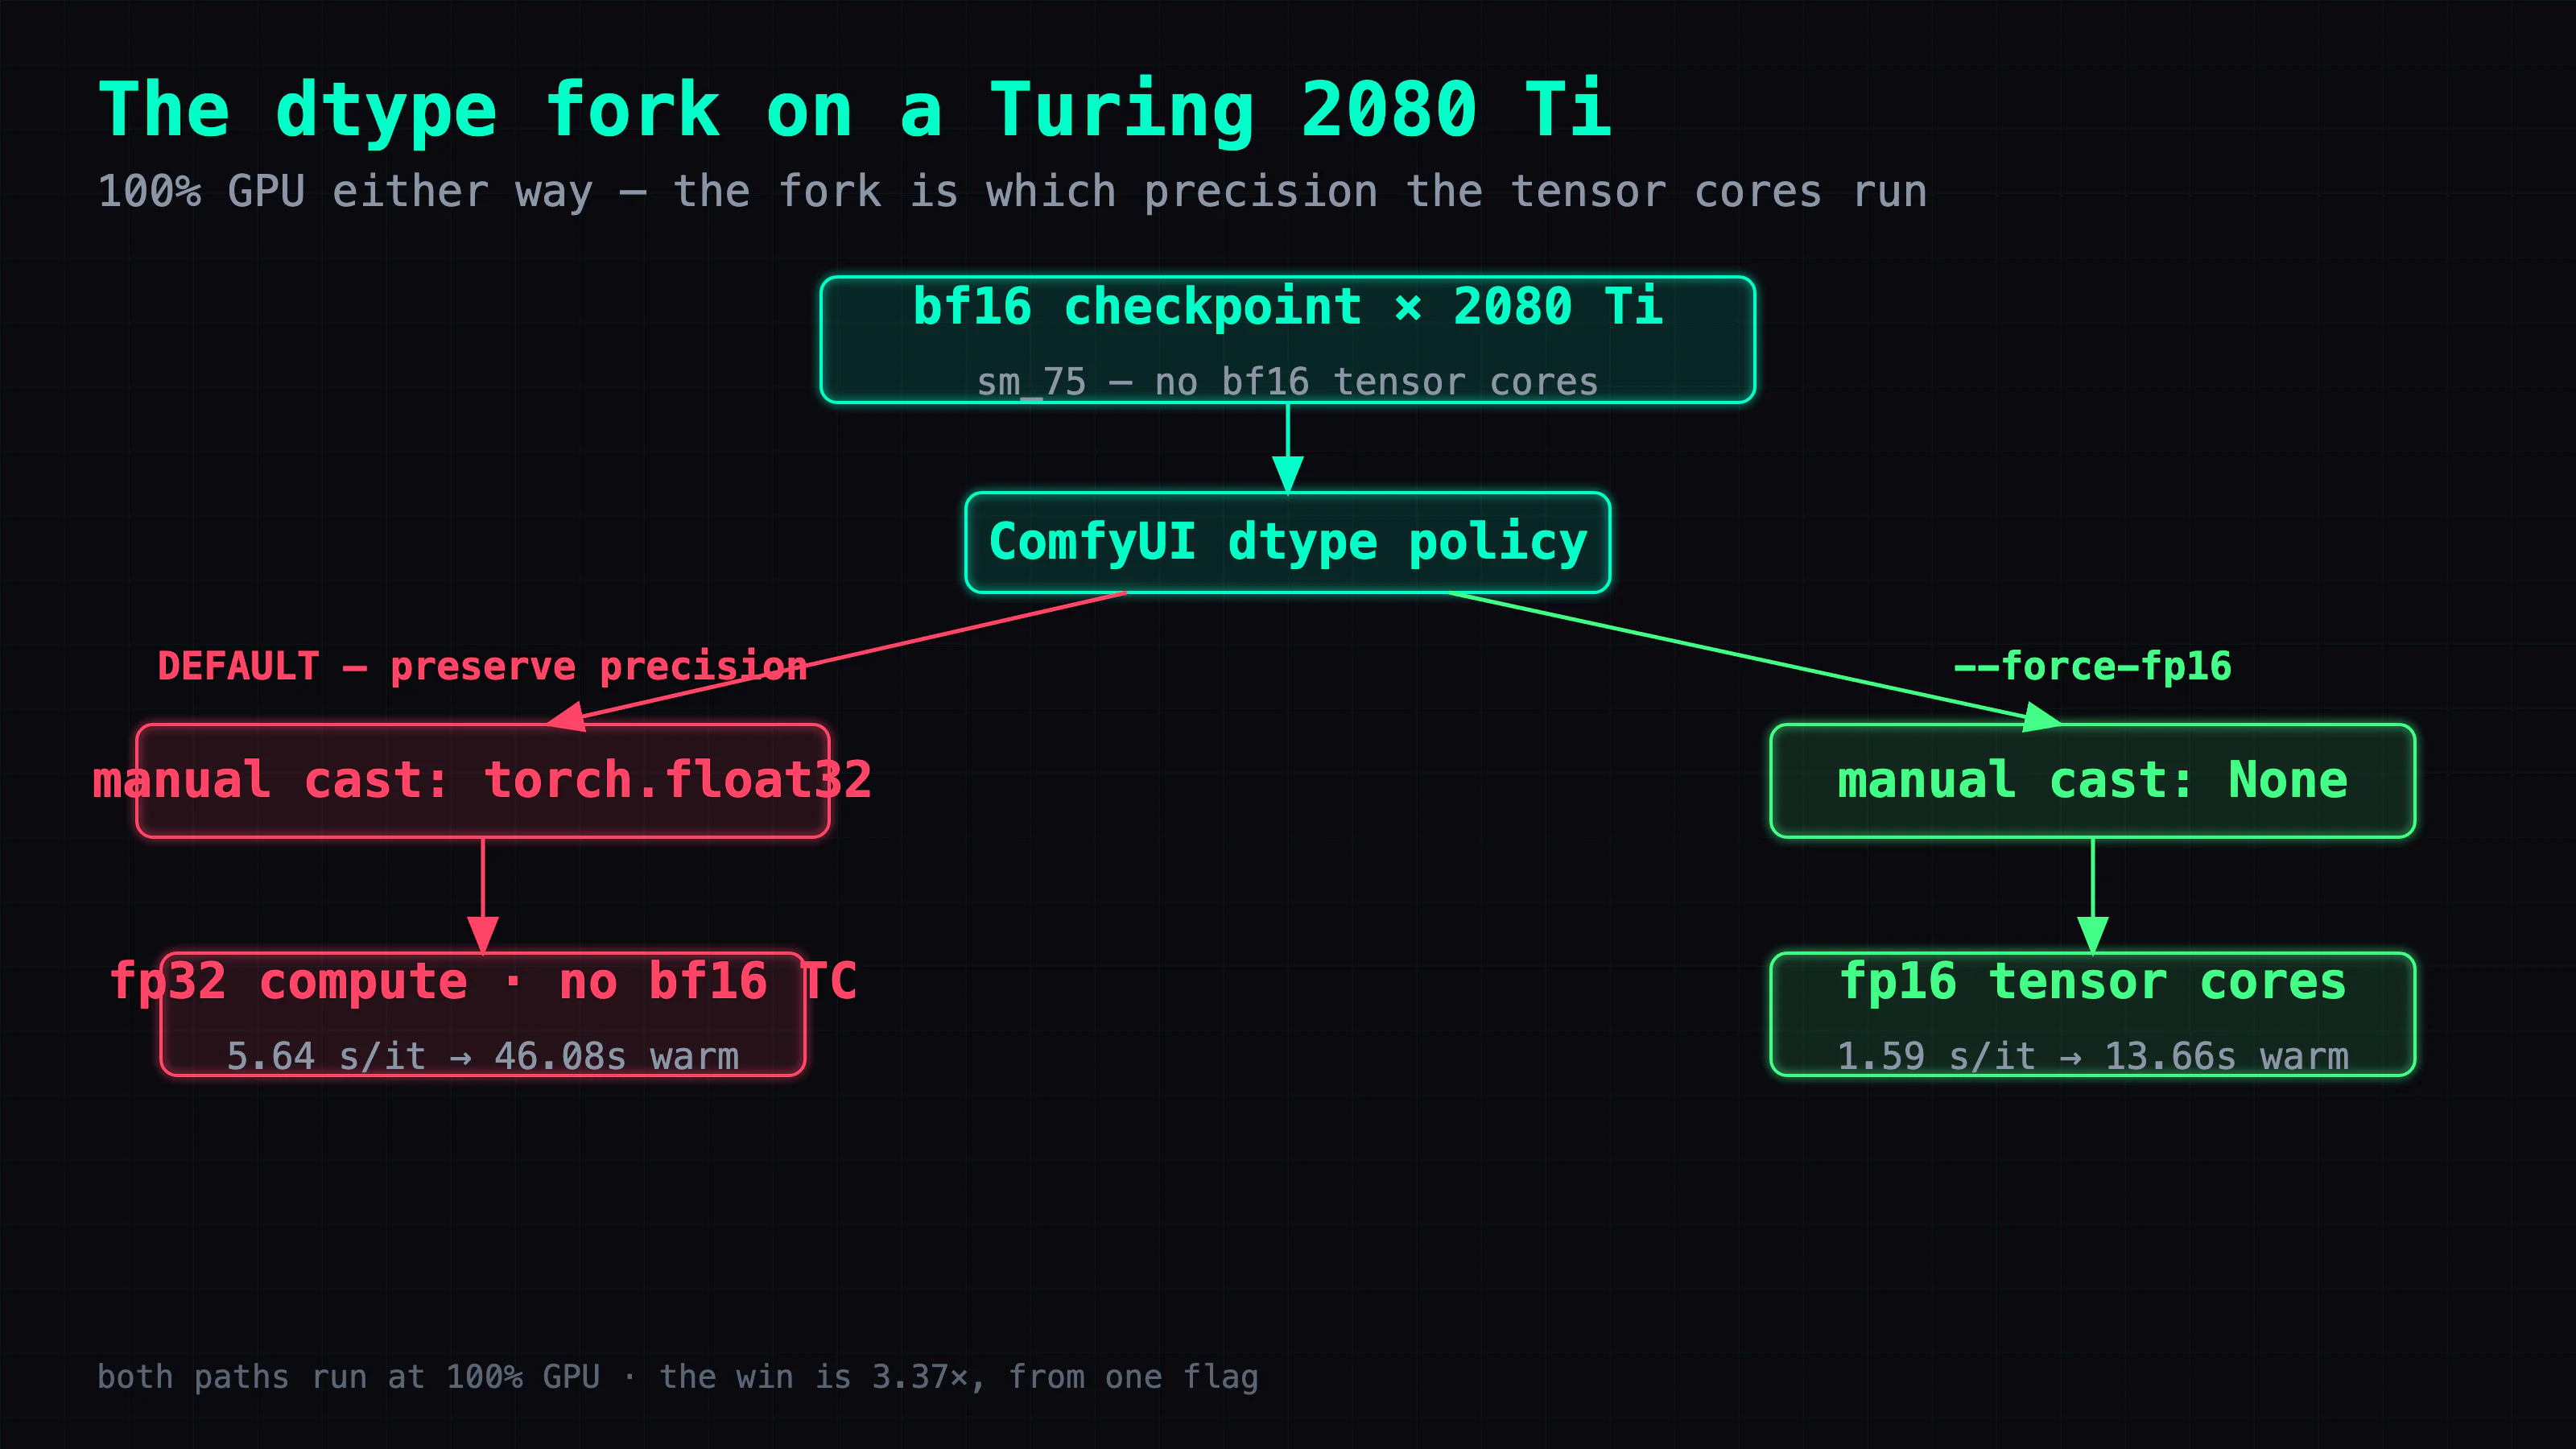
The same modded 2080 Ti 22G ran Z-Image 3.4× slower on one machine than an identical card on another. Not the hardware, the OS, or a missing package — the slow box was Linux with a newer toolchain. The culprit was one log line: manual cast: torch.float32. Turing (sm_75) has no bf16 tensor cores, so ComfyUI kept this checkpoint in a precision-preserving fp32 cast — 3.4× slower, at 100% GPU the whole time. One flag, --force-fp16, flips it to manual cast: None and drops the warm median from 46.08s to 13.66s. Now in production. Two caveats worth stating: it saves no VRAM (costs +0.5 GB), and the same flag did nothing for an LTX-2 video model — the speedup depends on the model family.
The short version: same card, one dtype line, 3.4×
Two of my machines have the same modded 2080 Ti 22G in them. One generated a Z-Image at a warm ~9.5s; the other, at ~46s. Even after correcting for a resolution difference, one card was doing the identical work 4–5× slower than the other. That gap had nothing to do with the silicon. It came down to a single line in the startup log — a precision fallback that Turing quietly triggers and nobody warns you about — and a one-flag override that took the warm median from 46s to 13.66s. This is the hunt for that line, including the three suspects I cleared on the way, and the two caveats that come with the win.
Two identical 2080 Tis, one 3.4× slower on the same job
Here's the thing: the AI and I weren't looking at the same reality. That morning the benchmark record looked conclusive — my Linux box ran Z-Image at a warm median of 46.08s per 1024² image, apparently the 2080 Ti's compute ceiling, not a misconfig. Nothing wrong with that read: the GPU sat at 100% the whole run, the model was resident, it was the right card — and the agent running the numbers had never measured anything faster, so 46s was reality.
Except I remembered something that wasn't in the records: "I'm pretty sure my other box does this in about 10 seconds." I'd run this same model on forge — an old Windows machine with the same 2080 Ti — and watched it finish that fast. That session never made it into the knowledge base, so the AI had no way to know about it; I was the only one who still remembered it. And I wasn't misremembering: forge's surviving log said Prompt executed in 9.49 seconds end-to-end — warm, at 768²/8 steps, with the sampler logging a steady 1.01 s/it (≈8s of stepping; the rest is VAE/text-encode overhead). My Linux box was running 1024², so some of the gap is just more pixels. But not 4–5×. Two identical cards, the same generator, and one was several times slower on equivalent work. The number on record was honest — it was just missing a piece.
The three suspects I cleared
Before the real cause showed up, I burned through three plausible ones — each killed by a single cheap test, because the fastest way to make progress is to find the one observation that separates two hypotheses and run only that.
- The OS. Windows-vs-Linux is the obvious guess, and my prior was that pure Linux should be faster. Wrong direction: the slow box was the Linux one. If Linux were the advantage, the fast box wouldn't be the Windows portable install. OS: cleared.
- A missing package. Maybe the fast box had some accelerator the slow one lacked —
comfy-kitchen, say. I checked. The slow box hadcomfy-kitchen 0.2.20; the fast box,0.2.10. The slow machine's toolchain was newer, not missing anything. A missing dependency doesn't explain a machine that's ahead on versions. Package: cleared. - The attention backend. Earlier that day I'd A/B-tested xformers on the slow box and gotten −0.85% — it was fractionally slower, so I rolled it back and moved on. What I didn't notice: that A/B was measuring attention on the wrong compute path. The lever wasn't broken; I was pulling it on a path that was already the problem. xformers: cleared, but it left a clue I'd walk back to.
Three dead ends, and each one narrowed it: not the OS, not a package, not the attention kernel. Whatever it was, it lived in how the model was being run, not what was installed.
The break: two log lines
The whole case turned on two lines in the ComfyUI startup log, and I only had them because forge's log had survived at all — a 6,743-byte stderr fragment covering the last 15 minutes before that card got pulled. (The 22 GB card is now out of that machine; a GTX 970 sits in its place. That log is the only witness left.)
The first fingerprint was Prompt executed in <N> seconds — the line that let me line up warm-vs-cold on both boxes and confirm the gap was real, not a staging artifact. The second was the one that broke it open:
- forge (fast):
model weight dtype torch.float16, manual cast: torch.float16 - Linux (slow):
model weight dtype torch.bfloat16, manual cast: torch.float32
Same checkpoint. Same card. The fast box was running the model in fp16; the slow box had silently cast it to fp32. That's the whole mystery in one word: float32.
Here's the mechanism. Turing (sm_75) has fp16 tensor cores but no bf16 tensor cores — bf16 acceleration didn't arrive until Ampere. ComfyUI doesn't blanket-cast every bf16 model to fp32; it picks a compute dtype from what each model class declares it supports. For this Z-Image checkpoint on Turing, that default landed on a precision-preserving fp32 manual cast instead of downcasting to fp16 — a defensible choice, but on this card fp32 compute runs about 3.4× slower than the fp16 tensor-core path. (That the pick is per-model-class is exactly why the same flag does nothing for a different model later.) The GPU is pegged at 100% the entire time, which is exactly why "it's the ceiling" felt true. 100% busy is not the same as at the ceiling — the card can be 100% busy doing the slow kind of math.
The one-flag fix: --force-fp16 → 3.37×
The override is a single startup flag. --force-fp16 tells ComfyUI to ignore the precision-preserving policy and load the checkpoint as fp16 weights. The slow log line changes from manual cast: torch.float32 to manual cast: None, and the fp16 tensor cores finally get used. In a clean single-variable A/B (the only difference being that flag):
| baseline (bf16 → fp32 cast) | --force-fp16 (fp16) | |
|---|---|---|
| warm median (1024²/8-step) | 46.08s | 13.66s |
| sampler | 5.64 s/it | 1.59 s/it |
| GPU util | 100% | 100% |
3.37× wall-clock, free, from one flag. The output was intact — a real PNG, non-black, no NaNs, quality indistinguishable from the fp32 run. The flag is now baked into that box's production ComfyUI service, so every generation gets it by default.
And that xformers A/B from earlier? It came in at −0.85% because it was measuring attention on the fp32 path. Right lever, wrong path. Once the path is fixed, the attention backend barely matters — the 3.4× was never going to come from a kernel swap; it was one policy decision upstream of the kernel.
What it does NOT do: save VRAM
Here's the caveat I have to state plainly, because it's the intuitive thing to assume and it's wrong: --force-fp16 saved no VRAM. The fp16 run used slightly more — 15,982 MiB vs 15,498 MiB, about +0.5 GB. The reason is boring: bf16 and fp16 weights are both 2 bytes each, so there's no weight-size saving to be had, and whatever activation memory dropped was hidden by the allocator's pool behavior. An older notion I'd had — that this checkpoint saved 5 GB — was a stale self-report from a long-running session; the clean benchmark showed the opposite. The win is speed. It is not memory. If you go in expecting headroom, you'll be disappointed and you'll mis-size your next model.
Why video got nothing: the speedup is model-family-specific
The obvious next move was to point the same flag at video. I did — an LTX-2 model (Sulphur-2, a distilled 3-second clip) on the same card, same single-variable A/B — and got 1.00×. No change at all: 140.29s → 140.93s warm, identical VRAM, identical utilization.
The log explains it. With the flag on, the weight dtype did flip to fp16 — but the manual cast line stayed pinned at torch.float32. LTX-2's model class doesn't list fp16 among its supported dtypes, so the cast stays fp32 regardless of the flag and the compute path never actually switched. Z-Image (a Lumina2-family model) honors the flag; LTX-2 ignores it. Whether fp16 helps depends on the model family, not the card.
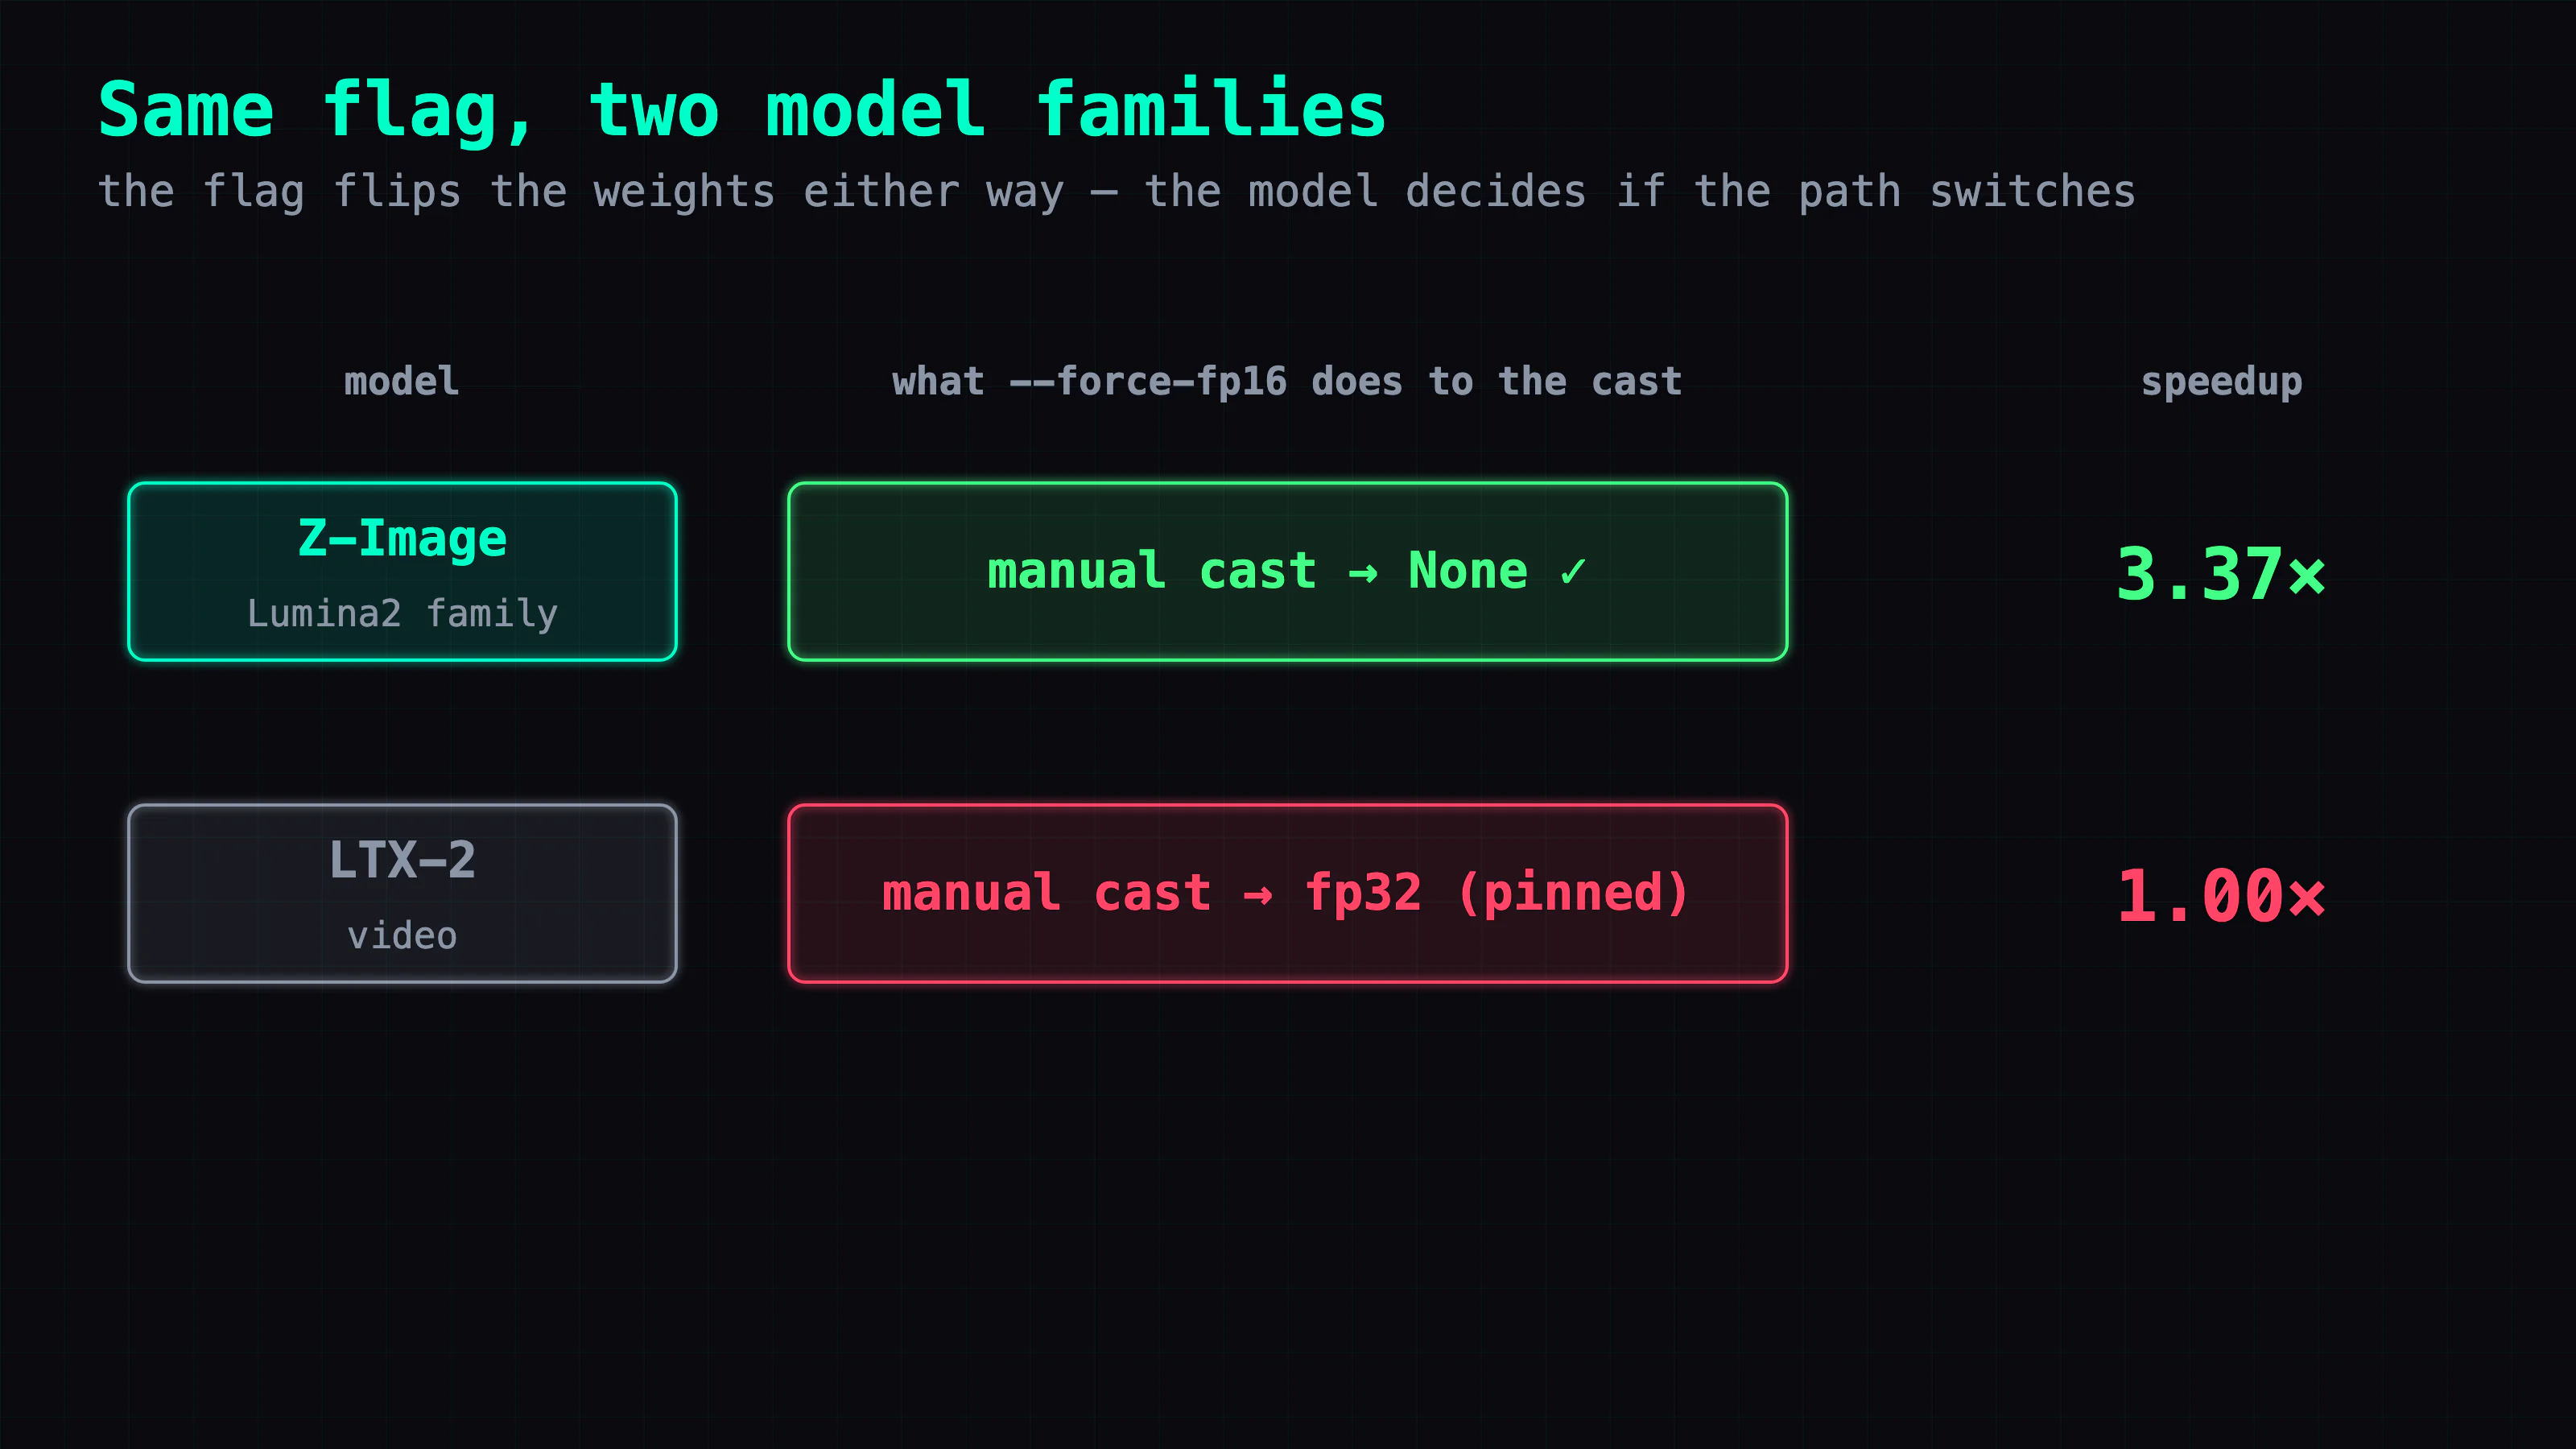
On Turing, that video model genuinely only has an fp32 path to run on — and now I have a clean control group proving 140s is its real floor, not a misconfiguration I should keep chasing.
Takeaways
Where the time went. Not the fix — the fix is one flag. The hours went into not believing the ceiling. "100% GPU, resident model, right card" is a very convincing story for "this is as fast as it gets," and it was wrong. The gap between an identical fast card and this one was the only evidence that the ceiling was fake.
Reusable diagnostics. Diff the boring lines: two identical machines, one startup-log diff (weight dtype / manual cast) held the entire answer. Treat "100% GPU" as "busy," not "maxed" — utilization tells you the card isn't idle, not that the path is optimal. Run the one decisive test per hypothesis (the OS guess died the instant I noticed the slow box was Linux). And when a knowledge base tells you "this machine never did better," trust the machine's own local log over the summary — forge wasn't a synced node, so my notes twice insisted its fast run "never happened." The offline box's log was the authority.
One bench trap worth naming. Re-running with a fixed seed makes ComfyUI cache-hit and print Prompt executed in 0.00 seconds — your "warm" numbers become fiction. Force a real recompute by feeding an input the graph ignores (a nonce) while keeping the seed and real inputs fixed. Otherwise you'll benchmark the cache.
The checklist: chasing a "slow card" that isn't
- Diff the startup log first. On two machines with the same card,
model weight dtypeandmanual castare the lines that matter.manual cast: torch.float32on a bf16 checkpoint + a pre-Ampere card is the prime fallback suspect (confirm per model — the pick is per-model-class). - Don't trust 100% GPU as a ceiling. It means busy, not optimal. A card can be fully occupied running the slow precision path.
- On Turing, try
--force-fp16for bf16 checkpoints — it's a 3× class win if the model family honors it. Verify the log flips tomanual cast: Noneand the output isn't NaN. - Don't expect VRAM savings from it. fp16 ≈ bf16 in bytes; budget for speed only.
- Confirm per-model-family. The flag helped Z-Image and did nothing for LTX-2. Re-run the A/B for each model instead of assuming.
FAQ
- Why is a bf16 model slow on an RTX 2080 Ti / Turing GPU?
- Turing (sm_75) has no bf16 tensor cores. ComfyUI doesn't blanket-cast every bf16 model to fp32 — it picks a compute dtype from what each model class supports — but for this Z-Image checkpoint on Turing that default landed on a precision-preserving fp32 manual cast instead of fp16. And fp32 compute is ~3.4× slower than the fp16 tensor-core path. The card is 100% busy the whole time; it's just busy doing fp32 math. Forcing fp16 weights (so the fp16 tensor cores are used) removes the fallback for the models that support fp16.
- What does --force-fp16 do in ComfyUI, and how much faster is it on a 2080 Ti?
- It overrides ComfyUI's dtype policy so a bf16 checkpoint loads as fp16 weights (the log line changes from 'manual cast: torch.float32' to 'manual cast: None'), which uses the fp16 tensor cores. On my 2080 Ti, Z-Image-Turbo went from a warm median of 46.08s to 13.66s per 1024² image — a 3.37× speedup, free, from one flag. Quality was unchanged (no NaNs, same output).
- Does --force-fp16 save VRAM on a 2080 Ti?
- No. In a clean A/B it used slightly MORE — 15,982 MiB vs 15,498 MiB, about +0.5 GB. bf16 and fp16 weights are both 2 bytes, so there's no weight saving, and any activation saving was hidden by the allocator. The win is speed, not memory. (An earlier 'nvfp4 saves 5 GB' claim was a stale self-report the clean benchmark disproved.)
- Does forcing fp16 speed up video generation on Turing too?
- Not necessarily — whether it helps depends on the model family. The same flag gave Z-Image (a Lumina2-family model) a 3.4× speedup, but an LTX-2 video model got 1.00× (no change). LTX-2's model class doesn't list fp16, so its manual cast stays pinned at fp32 regardless of the flag and the compute path never switches. On Turing, that video model genuinely only has an fp32 path to run on.
Read next
- 2026-08-06[Just for Fun — Advanced] Wait, a 2080 Ti Can Run MiniMax-H3? 1080p With Audio on a 2018 Card
The four files are 38 GiB on disk; the card has 22. A modded 2080 Ti 22G still renders 15s of 1080p with audio in 23 minutes. Full config, measured speed and quality, then how it got there.
- 2026-08-20[Just for Fun — Advanced] Why Isn't Your 4-Bit Quant Faster on a 2080 Ti? I Tore Open the CUDA Backend to Find Out
Quantized weights are half the file size on a 2080 Ti but the speed doesn't move. Dumping the CUDA backend's .so with nm -D shows why, and which quant format is actually accelerated.
- 2026-09-14[Benchmark] Two-stage MiniMax-H3 + LTX-2.5 on a 2080 Ti: 1344x768 with audio in 165s
A modded RTX 2080 Ti 22G renders 1344x768 with audio in 165 s using MiniMax-H3 to draft and LTX-2.5 to refine. Six departures from the Blackwell workflow.
- 2026-09-28NVFP4 Without FP4 Hardware: Qwen3.8-27B on Two RTX 2080 Tis at 151.7 tok/s
No FP4 hardware, still faster: a self-converted NVFP4 Qwen3.8-27B on two 2080 Tis runs code at 151.7 tok/s (was 116.1) and serves 4 requests at once.
Don't miss the next one
Subscribe, and you won't.
One-click unsubscribe anytime.