改裝 2080 Ti 22G · part 9
[Just for Fun — Advanced] 0xc0000409: When My AI Service Died Silently and the Log Ate the Evidence
❯ cat --toc
- The short version: a self-restarting service is the best at burying the reason for its own crash
- The setup: a resident brain on a headless old desktop
- The first mistake: I stared at the truncated stderr for ages
- Catching the culprit, part one: the log was truncated by its own restart
- Catching the culprit, part two: the Event Log is the real source of evidence
- What 0xc0000409 actually is: a fail-fast abort, not an OOM
- Two fixes: preserve the crash log, then reduce checkpoint pressure
- An open investigation: 128K turned it into "a rare one-off," but didn't cure it
- Rules I'd reuse for any auto-restarting service
TL;DR
My resident 27B Windows service kept dying silently: one brief 503, auto-restart, clean app log. The culprit was partly my own log config — restart truncated stderr and wiped the crash line. Windows Event Viewer kept the OS-layer clue: 0xc0000409 in ucrtbase, a fail-fast abort, not a clean CUDA OOM. Root cause is still open. Mitigations now preserve old stderr and lower context-checkpoint pressure so the next crash can leave evidence.

The short version: a self-restarting service is the best at burying the reason for its own crash
This post is about a counterintuitive trap that anyone running a resident "auto-restart" service hits eventually: the service buried the reason for its own crash.
The symptom looks innocent: my always-on home AI brain would occasionally "hiccup" — the client caught one 503, then everything was fine a few seconds later. I went to the service's own log to see why it died, and it was blank — nothing but a clean startup banner, as if nothing had happened.
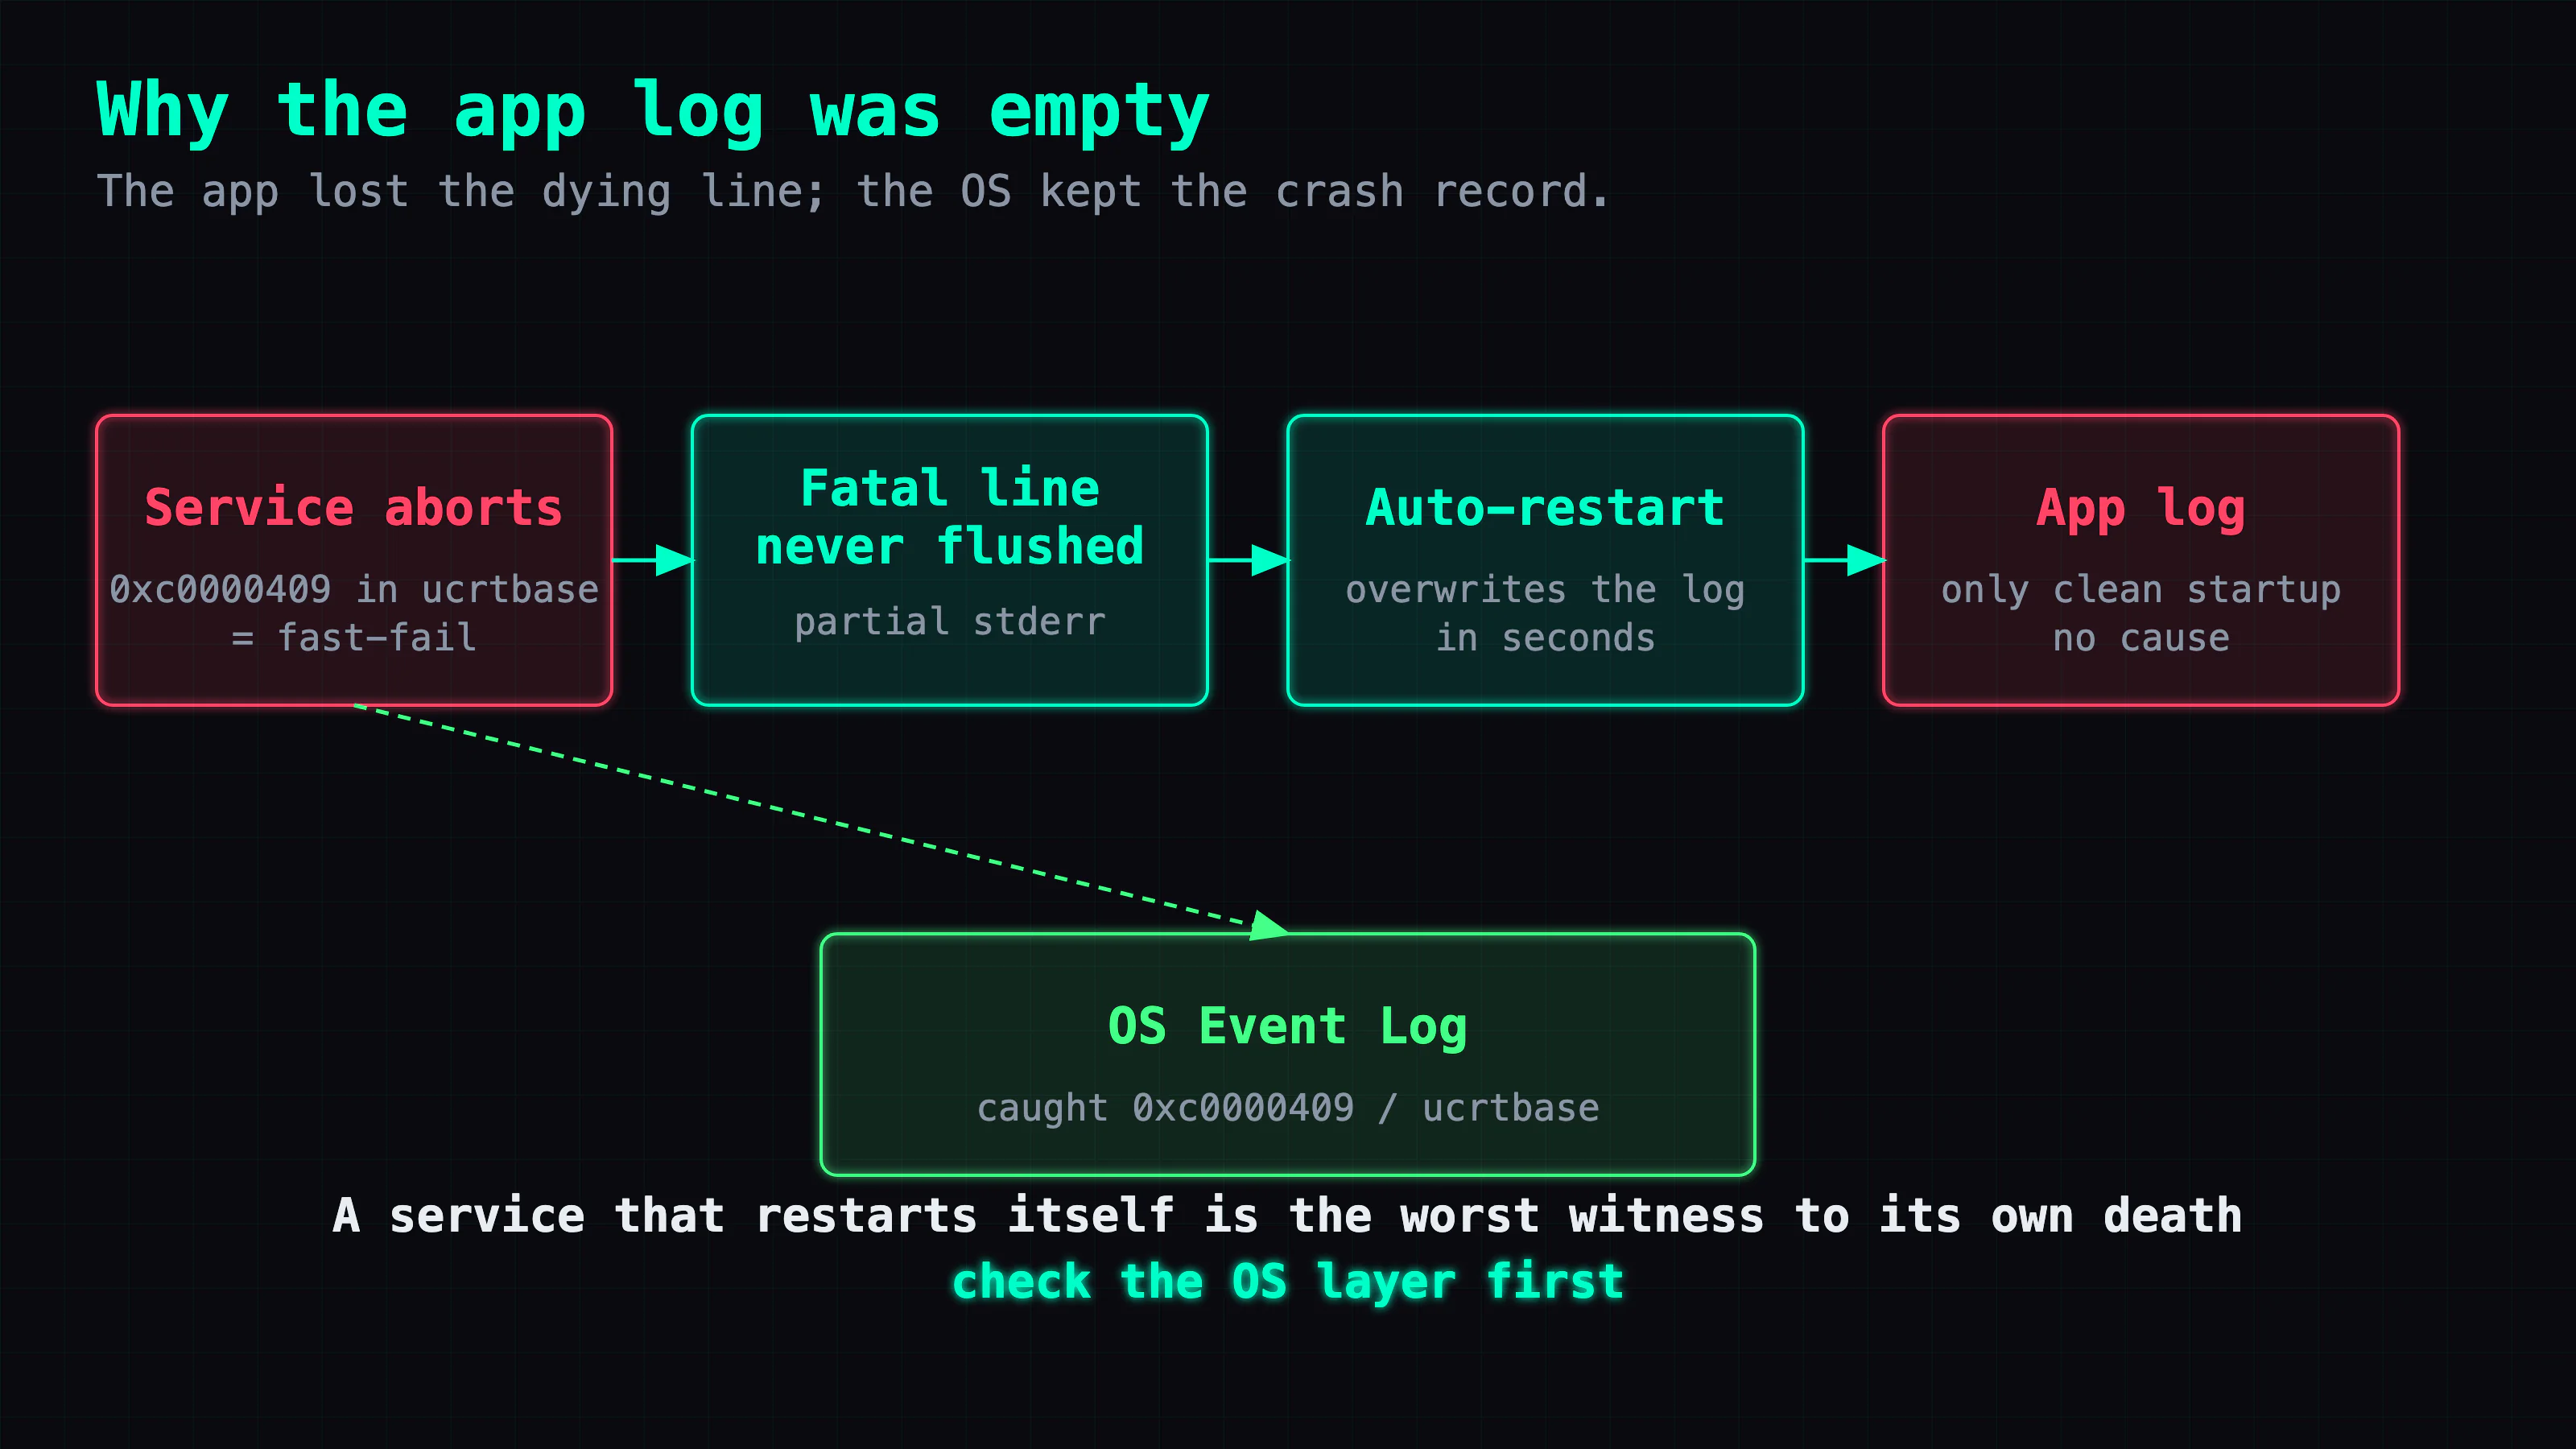
That "as if nothing had happened" is exactly the trap. The service auto-restarts after a crash, and it writes its error output to a fixed file — at the instant of restart, that file gets truncated and overwritten, so the last few lines printed at the moment of the crash (the part that explains it) get wiped along with it. By the time I look, I always see the clean post-restart startup banner, never the dying words.
So this post has two takeaways: one, go to the OS layer first for the cause, don't just stare at the application's own log; two, a log-retention policy matters more than the log itself — a log that eats the reason for its own crash is the same as no log.
The setup: a resident brain on a headless old desktop
The setup is the same as earlier in the series: a second-hand 22G-modded RTX 2080 Ti serves as the agent brain, in a cheap old desktop with just 16GB of RAM and a six-core CPU — no monitor, fully headless, and I always remote in from another machine. It runs llama.cpp to serve an abliterated Qwen3.6-27B Q4_K as a resident brain, context set to 128K (there's a whole story behind that 128K — see the previous hard-core post), watched by a Windows boot-time service that restarts it whenever it dies.
The keywords are headless + auto-restart. Put those two together and you get the perfect breeding ground for this bug: no monitor, so nobody sees a crash dialog in the moment; auto-restart, so a few seconds after a crash it's alive again and you don't even notice it died — unless you happen to send a request during that brief window and catch the 503.
The first mistake: I stared at the truncated stderr for ages
Here's how it started. After reloading this brain and feeding it a longish real conversation (input around 54K tokens), the client caught a 503. I figured "oh, probably something context-related blew up again" (earlier in this series I covered how maxing context to 256K causes an OOM), so I reflexively went to the service's stderr log to find that damned error line.
And — nothing.
The log had only the service's restart messages, spotlessly clean: no CUDA OOM, no ggml alloc failure, no stack trace, nothing. For a moment I doubted myself — "did it even crash, or did some request just time out?" (this series also covered how this brain's more common failure mode under overload is timeout from single-slot queue starvation, not an actual crash).
But the 503 was real and the restart was real. A service that demonstrably restarted, with a log saying it never died — that itself is the clue. It was telling me: it's not that there's no cause, it's that the cause got eaten.
Catching the culprit, part one: the log was truncated by its own restart
Going back to the service config, the problem dawned on me: it redirects stderr to a fixed log file. On Windows the default behavior of that redirect is to truncate the file on every (re)start — overwrite the old contents with an empty file.
Lay out the timeline and it's obvious:
T+0.0s   the brain is processing a ~54K reload
T+0.1s   some internal fail-fast path trips → abort → the process dies
         (if stderr emitted the crash reason here, it had a 0.1s lifespan)
T+0.2s   the resident service notices the process is gone → spawns a new one
T+0.2s   new process opens the stderr log → truncates the old file → that last moment is overwritten by an empty file
T+...    I open the log → all I see is a "clean restart"
If the crash reason was emitted at all, it had a 0.1-second lifespan before its own restart overwrote it. (Caveat: I didn't manage to preserve that line, so I can't prove it was emitted — but this setup makes the stderr unreliable either way, and that's what needs fixing.) That "blank log" I was staring at wasn't blank because there was no cause; it was blank because I was always one step late — what I saw was always the post-restart version.
That's the concrete mechanism. The restart gives the service resilience (the client only catches one 503 and recovers), but that same restart destroys the evidence of every crash. Resilience and observability are at odds here, and the default config picked resilience at observability's expense.
Catching the culprit, part two: the Event Log is the real source of evidence
With the application's own log untrustworthy, I went a layer deeper: OS-layer crash reporting.
Windows Event Viewer → Windows Logs → Application has a pair of events you must check first in any "process died silently" situation:
- Event ID 1000 (Application Error): logged when the OS detects a process crash. It lists the faulting application (which exe died), the faulting module (which module it died in), and the exception code.
- Event ID 1001 (Windows Error Reporting): the WER counterpart.
The key difference: OS-layer crash reporting isn't your application's to manage, so it isn't affected by your self-truncating log. Your stderr can be overwritten a thousand times; that Event 1000 is still sitting fine in the Event Viewer. When the app log is blank, it's the most reliable place to start.
And what I saw there was:
- exception code =
0xc0000409 - faulting module = ucrtbase (the Universal C Runtime)
Put the two together and the case points at "not the GPU throwing an OOM, but the program aborting itself at the C-runtime layer."
What 0xc0000409 actually is: a fail-fast abort, not an OOM
This code deserves its own explanation, because it's easy to misread.
0xc0000409's official name is STATUS_STACK_BUFFER_OVERRUN. The name alone makes you think "stack buffer overflow," some memory-safety attack — but in practice the modern C runtime (ucrtbase) uses it as a general fail-fast abort code: when the program detects a state that "shouldn't happen, and once it does we can't continue," it takes the fail-fast path, aborts itself, and throws this code.
So in a native C++ program like llama.cpp, common candidates for the combination 0xc0000409 + ucrtbase are:
- a
GGML_ASSERT/ assert failure (the program caught a broken invariant and runsabort()), or - an uncaught exception that bubbled to the top of the runtime and tripped a fail-fast.
(I still don't know which one actually fired; it stays a candidate, not a verdict, until I recover the line that says so.)
The code itself proves a fail-fast, not a CUDA OOM — when GPU memory runs out you see CUDA's own error message or a ggml alloc failure, and 0xc0000409 isn't CUDA's OOM code. But to be precise: that only rules out "Windows logged it directly as an OOM," not "VRAM/memory pressure was the upstream trigger that finally aborts at the C-runtime layer" — and the stderr line that would tell those two apart is exactly the evidence that got eaten. So my earlier "it's probably context blowing up" instinct isn't refuted, just demoted to "an upstream hypothesis still to prove": I expected to see an OOM and saw an abort, and those are signals at different layers.
⚠️ Let me be clear about what I do and don't know: what I can confirm 100% is the externally observable fact: "fail-fast abort (0xc0000409 via ucrtbase) plus an auto-restart." Whether it maps to a
GGML_ASSERTor an uncaught exception is my hypothesis — I haven't yet rescued the actual ggml/assert line before the restart. The mitigations below exist precisely so I can grab it next time.
Two fixes: preserve the crash log, then reduce checkpoint pressure
Once I realized the restart was overwriting the evidence, I split the fix into two parts.
First fix: stop the log from eating the cause. Change that "truncate on restart" behavior — before each (re)start, rename and keep the old stderr file (add a timestamped suffix) instead of letting the new process overwrite it. Keep the most recent few (I keep 15), so the next time it crashes, the dying lines freeze in the renamed file and aren't wiped by the next restart. I also have the resident service write "restarted Y at time X" events into a separate events log, kept apart from the application's stderr — so even if the app side really leaves nothing behind, I at least have a restart timeline to cross-reference.
This is the real fix — it doesn't fix the crash, but it makes the crash visible. For an intermittent, hard-to-reproduce bug, "can I capture evidence when it happens" matters far more than "can I guess the cause right now."
Second fix: ease the most likely trigger (a mitigation, not a cure). Since the hypothesis points at "a hybrid model's recurrent checkpoint / some long-context runtime pressure path," I lowered the context-checkpoint count ceiling (--ctx-checkpoints, down from the default) to ease the checkpoint pool's overall pressure. This is the same long-context-pressure story as the previous hard-core post on the 256K OOM — checkpoints grow with the conversation, and this hybrid brain's checkpoints are especially large and especially quick to invalidate. Lowering the ceiling leaves a little more runtime slack.
⚠️ One correction: Context-checkpoint snapshots are host-side
std::vector<uint8_t>buffers.--ctx-checkpointscaps how many live per-slot checkpoints exist;--cache-rambudgets the server's prompt-cache entries (whose size can include copied checkpoint data). That's not the same as the active KV cache living in host RAM.
But I have to flag this clearly: the second fix is a "hypothesis-driven mitigation," not a "verified cure." I can't claim "after lowering the checkpoint ceiling it stopped crashing" — the bug is intermittent and hard to reproduce, and I haven't yet reached the point of "ran long enough after the change to confirm it really doesn't recur." It only narrows down one likely trigger.
An open investigation: 128K turned it into "a rare one-off," but didn't cure it
Tying this back to the caveat in the previous hard-core post: at 256K it blew up every few turns; dropping back to 128K plus the mitigations above turned it into a rare one-off that auto-recovers. That's a big difference — for a resident agent, "a rare one-off plus auto-restart plus the client retries and it's back" is an acceptable operating state; "blows up every few turns" is not.
But "turned into a rare one-off" ≠ "cured." At 128K I still saw that one 0xc0000409 under real load (input ~54K), and what I caught after the mitigations went live was still only two clean restart timestamps — I haven't yet reached "the next crash, and this time the log holds the cause." In other words: the trap is set, but the bug hasn't reproduced again.
So this post is still an open investigation. I've confirmed the fail-fast abort (0xc0000409 via ucrtbase), the auto-restart, the blank app log, and the live mitigations. I still need the actual ggml/assert line, which layer the pressure hits, and proof that lowering the checkpoint ceiling is a real cure. For the surrounding long-context-pressure story, see the 256K OOM post and the TTFT hard-core post.
Rules I'd reuse for any auto-restarting service
The post, distilled into a few rules you can carry to any "auto-restart resident service":
- Process died silently + app log blank → go to the OS layer. On Windows, check Event Viewer Application Events 1000/1001 (grab the faulting module + exception code); on Linux,
dmesg/journalctl/ coredumps. OS-layer crash reporting isn't affected by your application's log policy — it's the most reliable place to start. - A self-restarting service is the best at burying the reason for its own crash. The restart gives you resilience but destroys the evidence at the same time. Preserve (rename) the old error output before restarting; don't let it be truncated and overwritten — a log-retention policy matters more than the log itself.
0xc0000409+ucrtbase= a fail-fast abort, not an OOM. Don't let the name STATUS_STACK_BUFFER_OVERRUN send you hunting a memory attack; the modern C runtime uses it as a general abort code, and on a native program it's usually a failed assert or an uncaught exception. Running out of memory shows up as CUDA's or ggml's own message instead.- Intermittent bug: fix observability before chasing the crash itself. For a crash that's hard to reproduce, the value of "being able to capture evidence when it happens" far outweighs "guessing a cause right now." Set the observability trap first and let the next crash speak for you.
Also in this series:
- 256K crash detective: free-VRAM-vs-context is nonlinear, and why 128K is the sweet spot (the same long-context-pressure family; that post also mentions this
0xc0000409) - Why 30 tok/s feels slower than 14: checkpoint misses, full reprocessing, and TTFT (another face of the same hybrid brain)
- Series opener: an NT$11k modded card hosts a 27B agent (how this brain got here)
FAQ
- What does 0xc0000409 mean? Is it an OOM?
- It's not out-of-memory. 0xc0000409 is Windows STATUS_STACK_BUFFER_OVERRUN, and in practice it's the status code that surfaces when the C runtime (ucrtbase) takes a fail-fast abort path — the program decides its state is corrupt and can't continue, so it aborts itself. In a native program like llama.cpp it commonly maps to a failed assert or an uncaught exception, not a CUDA OOM from the GPU. That's why the log shows no tidy 'out of memory' — just this cold hex code.
- Why couldn't the application's own log catch the cause?
- Because the service is set to auto-restart after a crash, and it redirects stderr to a fixed file. The default behavior truncates (overwrites) that file on every (re)start, so the last few lines printed at the moment of the crash — the part that explains it — get wiped by the startup banner a second later. A self-restarting service is the best at burying the reason for its own crash. The fix is to rename and keep the old stderr before restarting, instead of letting it be overwritten.
- Where do you find the cause, then?
- Go to the OS layer first. On Windows: Event Viewer → Windows Logs → Application, look for Event ID 1000 / 1001 (Application Error / Windows Error Reporting). That records the faulting executable, the faulting module (here, ucrtbase), and the exception code (here, 0xc0000409). OS-layer crash reporting isn't affected by your application's log-rotation policy, so when the app log is blank, it's the most reliable place to start.
- Did you find the root cause?
- Not 100%, and I won't pretend the case is closed. The leading hypothesis: under certain real long-running loads (e.g. a reload with input around 54K), a hybrid model's recurrent checkpoint or some runtime pressure path tripped an assert/abort inside llama.cpp — but that attribution is a guess. The only fact I can confirm is 'fail-fast abort plus auto-restart' — I haven't yet caught the actual ggml error line. So this is 'investigate, mitigate, and wait for final confirmation': the mitigations (preserve the crash log, lower the checkpoint ceiling) are live, and the root cause waits on capturing the Event Log on the next recurrence.
Read next
- 2026-07-03[Just for Fun — Advanced] I Doubled My Agent's Decode Speed and It Got Slower: TTFT Is the Number You Actually Feel
I swapped my home agent's brain for one that decodes 30-40 tok/s instead of 14, and it felt slower. The number I'd stared at for a year — tok/s — only measures how fast tokens come out, not how long before they start. On a hybrid model, a single cache miss re-prefills the entire prompt: same box, same brain, 2.6s warm vs 216s cold. Here's the live log.
- 2026-07-02[Just for Fun — Advanced] Progressive Streaming on a Slow Model Got My Bot Rate-Limited by Telegram
To ease the wait on a pokey local agent, I turned on Telegram streaming — which, the way this bot did it, means rewriting the same message every fraction of a second. On a 14 tok/s brain, a single 175-second reply works out to an estimated couple hundred edit requests, which slammed into Telegram's flood control and got the whole bot benched for four minutes — final answer included. The short, ugly lesson: slow models should not fake streaming with edits. Send the finished answer once. Live logs inside.
- 2026-06-27[Just for Fun — Advanced] The Tool-Definition Tax: 17K Tokens Before I Say a Word, Re-Billed on Every Cache Miss
I added up what my home agent pays before it reads a single word from me: ~23K tokens of overhead, and 17K of that is just the instruction manuals for its tools. Worse, it runs a hybrid model — on a cache miss it re-processes all 17K from scratch, and a single user turn can do that a dozen-plus times. This is context economics, badly underestimated. The fix isn't cutting tools; it's loading them on demand, the way skills already do.
- 2026-06-26[Just for Fun — Advanced] llama.cpp won't persist KV cache to disk — so I put a 60-line proxy in front of it (7× faster restore)
On a long conversation, every message makes the model re-read the whole thing (re-prefill) before it answers — worst right after a restart or a cache eviction. Stock llama.cpp can save the KV cache to disk (--slot-save-path) but won't do it on its own — the auto-persist feature request is closed as not planned. A tiny stdlib reverse-proxy restores instead of re-prefilling: 9.9s → 1.4s on a 5K chat (7×). Mechanism, proxy design, and why I haven't shipped it yet.
Don't miss the next one
Subscribe, and you won't.
One-click unsubscribe anytime.