改裝 2080 Ti 22G · part 21
Dual RTX 2080 Ti FastLLM: 16% Faster Decoding and No More Head-of-Line Blocking
❯ cat --toc
- Same two cards: 16% faster, two requests at once, and no more 39-second waits
- What changed: code at 116.1 tok/s, 2 requests at once, 1.13 s instead of 39.5 s
- Change 1: newest FastLLM, one commit reverted, NVFP4 draft: code 100.3 → 116.6
- Change 2: dropping --tokens makes --max_batch 2 real: 186 tok/s combined
- Change 3: yielding between prefill chunks: a short request waits 1.18 s instead of 37.4 s
- Building it: a2bf07fd, one revert, two PR merges
- Launching it: --tokens removed, two env vars added, 222,080 tokens per session
- Four gotchas that silently cost speed or concurrency
- Capability: 132 of 140 without thinking, 127 with it
- So, can it go faster?
- Deep dive: bisecting 87 commits, why chunking never yields, and two regressions the stress test caught
- Bisecting the code-speed regression down to d4b04876
- Acceptance drops, but the kernel isn't wrong
- The logprobs patch has zero effect on speed
- CUDA Graph: the "deadlock" message is a symptom
- Draft tokens and the SM75 switches: defaults win
- Concurrency took three tries
- Where it blocks in the source
- What I tried before patching: chunk sizes and env vars
- Regression 1: faster short requests broke concurrent throughput
- Regression 2: only one short request got in
- Final 18-cycle regression run
- Three rounds of code review before submitting
- Version pin
- Limitations and next steps
TL;DR
Same two modded 2080 Ti 22G, same Qwen3.8-27B FP8 + DFlash2 in FastLLM. Code goes from 100.3 to 116.1 tok/s, math 118.6 → 135.5, prose 64.8 → 74.2. Two requests now run at once, 175.8 tok/s combined. A short request sent while a 54K-token prompt prefills gets its first token in 1.13 s instead of 39.5 s (p95). How: latest upstream minus one commit that hurts draft acceptance, an NVFP4 draft, no --tokens, and a patch (PR #756) that yields between prefill chunks. Cost: per-request context drops from 262,144 to 222,080, and the patches aren't merged upstream yet, so you build it yourself.
Same two cards: 16% faster, two requests at once, and no more 39-second waits
You're in a grocery store with one open checkout lane, holding a carton of milk, and the person ahead of you has a cart piled to the top. The cashier could ring you up in ten seconds between their items. They don't. You wait for the whole cart.
That was my model server. Part 20 got Qwen3.8-27B FP8 running on two modded RTX 2080 Ti 22G with FastLLM and the DFlash2 draft model, tensor parallel 2, one request at a time. It was fast, but a single 54K-token prompt took about 40 seconds to prefill, and every other request sat behind it.
This part keeps the same cards and the same weights, and changes three things: a newer FastLLM with one commit reverted and a quantized draft (faster), one launch flag removed (two concurrent requests), and a scheduler patch (short requests get served during a long prefill). The first half is the recipe. The deep dive after the divider is the debugging record.
What changed: code at 116.1 tok/s, 2 requests at once, 1.13 s instead of 39.5 s
Same machine, same benchmark script, measured before and after. The third row is the one that changes how the server feels in daily use.
| previous build | this build | |
|---|---|---|
| code / math / prose tok/s | 100.3 / 118.6 / 64.8 | 116.1 / 135.5 / 74.2 |
| concurrent requests | 1 | 2 (175.8 tok/s combined) |
| short request during a 54K-token prefill, first token (p95) | 39.5 s | 1.13 s |
| next request after cancelling a long one, first token (max) | 9.8 s | 0.54 s |
| per-request context limit | 262,144 | 222,080 |
On my 140-question capability set, the score went from 128 to 132 without thinking and from 125 to 127 with thinking at effort low. That comes with the caveats in the capability section below.
Method: real chat requests, temperature 0, 512 tokens per request, three prompts (code, math, prose), three runs each, median, timed on the client. The code prompt here asks for heavy comments and explanation, so its throughput comes out lower than on a pure-code prompt. With Part 20's three prompts, this build does 175.3 on code, 154.1 on math and 64.7 on prose. The latency rows come from a 33-minute stress test: 8 cycles, 112 requests, fixed seed.
Change 1: newest FastLLM, one commit reverted, NVFP4 draft: code 100.3 → 116.6
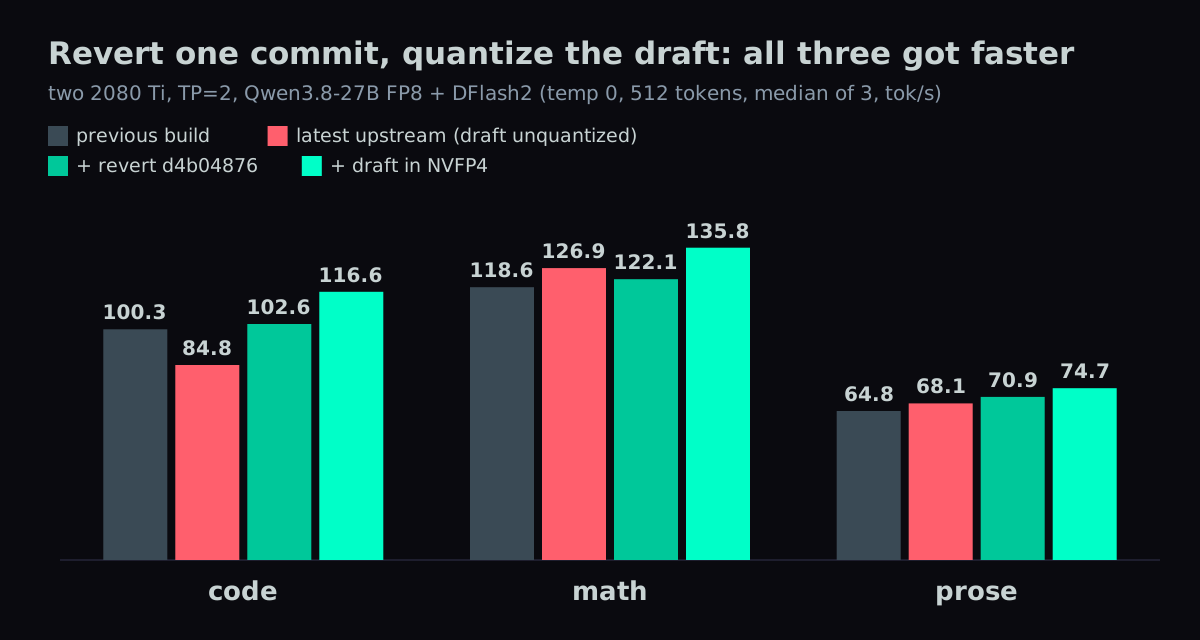
The previous build was FastLLM at 14f849af (2026-09-21). Upstream a2bf07fd (2026-09-25) is 87 commits newer. Dropped in as-is, it made math and prose faster and code about 15% slower.
Bisecting those 87 commits pointed at one: d4b04876, "修复小批量 RMSNorm 归约舍入差异" (fix rounding differences in the small-batch RMSNorm reduction). It changes the RMSNorm kernel for width 5120 and batch sizes 1 to 8. Both the main model and the DFlash2 draft have a hidden size of 5120. With that commit in, the draft's acceptance rate at position 3 drops from 60.9% to 43.5%. Fewer accepted guesses per step means fewer tokens per pass over the weights.
Reverting it restores code speed. The second step is quantizing the draft to NVFP4 with FASTLLM_DRAFT_QUANT=nvfp4, which upstream 7e0d6705 turned on by default. The draft is 5 layers and 3.6 GB, and it runs on every step, so smaller draft weights make the guessing phase shorter. The main model's weights aren't touched, and the main model still verifies every token, so answers don't change.
| build | code | math | prose |
|---|---|---|---|
previous (14f849af) | 100.3 | 118.6 | 64.8 |
upstream a2bf07fd, draft unquantized | 84.8 | 126.9 | 68.1 |
+ revert d4b04876 | 102.6 | 122.1 | 70.9 |
| + draft in NVFP4 | 116.6 | 135.8 | 74.7 |
d4b04876 is upstream's consistency fix, and I don't think it computes anything wrong. I compared both kernels against an FP32 reference and they have the same error. I revert it only because, on this hardware with DFlash2, it lowers acceptance. On another GPU it may make no difference.
Change 2: dropping --tokens makes --max_batch 2 real: 186 tok/s combined
Setting --max_batch 2 alone still serves one request at a time. The only sign is one log line:
explicit-token safety max_batch limited 2 -> 1
Qwen3.8 is a hybrid model. Most of its layers use GDN, a linear-attention variant, and each request carries a sizable recurrent state on top of its KV cache. When you pass --tokens explicitly, FastLLM caps the budget for that state at 25% of the KV space. On these cards that fits one request, so FastLLM silently drops concurrency to 1. The 25% is hard-coded; there's no flag for it.
Remove --tokens and FastLLM sizes the KV pages itself. Concurrency works. Compare the "two at once" column:
| flags | actual concurrency | single request (code) | two at once | context per request |
|---|---|---|---|---|
--max_batch 2 --tokens 262144 | 1 (clamped) | 116.9 | ~117 (taking turns) | 262,144 |
--max_batch 2, no --tokens | 2 | 116.7 | 186 combined | 222,080 |
Single-stream speed doesn't change, and combined throughput goes up about 60%. The cost is context: two requests share one KV pool, so each one gets 222,080 tokens instead of 262,144.
Change 3: yielding between prefill chunks: a short request waits 1.18 s instead of 37.4 s
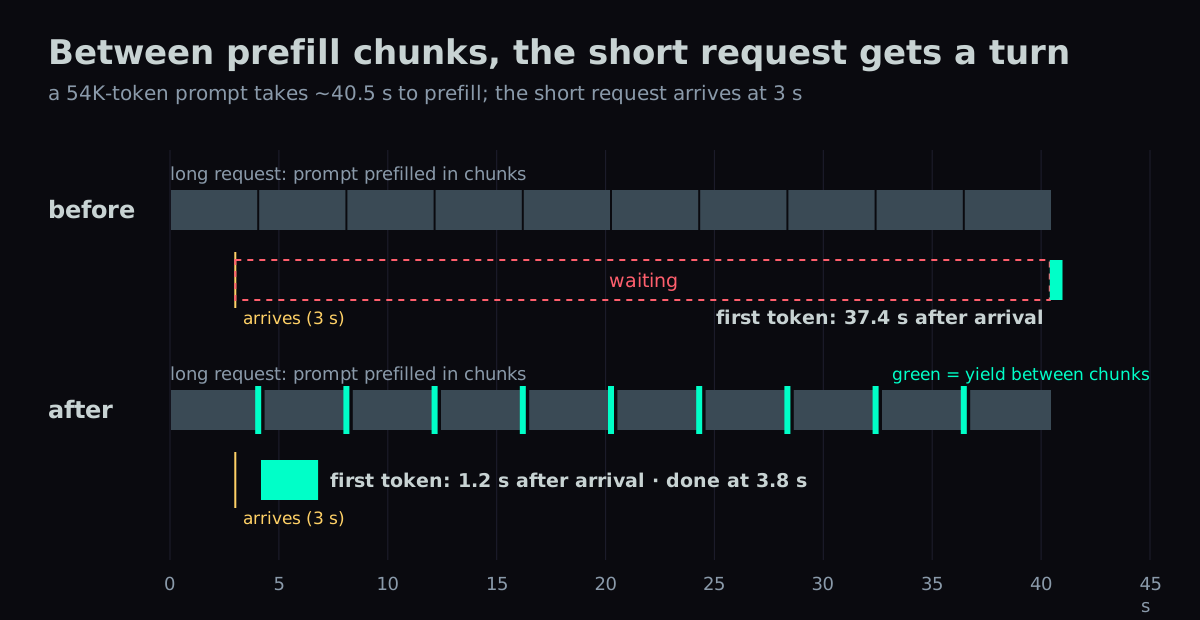
Two concurrent slots don't help if one of them is prefilling a long prompt. A 54K-token prompt takes about 40 s to prefill, and a short request sent during that time waited about 39 s.
With Qwen3.8 plus DFlash, FastLLM uses a dedicated scheduler loop. Once it picks the long request, it runs every prefill chunk in one inner loop and never looks at the queue. --chunked_prefill_size only sets how big each chunk is. I tried three chunk sizes and three related environment variables, and the short request always waited 37 to 41 s.
The fix: after each chunk, release the model's forward lock for a moment so a helper scheduler thread can serve queued short requests, then continue the prefill. It's behind a switch, FASTLLM_COOPERATIVE_LONG_PREFILL=1. With the variable unset, behavior is identical to upstream.
I fixed cancellation along the way. Upstream, cancelling a long request only marks it aborted. The prefill loop never checks the flag, so the GPU finishes the whole prompt and the next request waits 9.8 s. The loop now checks between chunks, and the next request is served in 0.5 s. Chunks that were already prefilled stay in the prefix cache, so resending the same prompt hits them.
All numbers below were measured while a 54K-token prompt was prefilling:
| before | after | |
|---|---|---|
| one short request inserted: first token / done (single run) | 37.4 s / 37.8 s | 1.18 s / 3.8 s |
| two short requests at once: first token | 38.1 / 38.6 s | 1.3 / 2.7 s |
| one short request, stress-test p95 first token | 39.5 s | 1.13 s |
| cancel, then next request's first token (stress max) | 9.8 s | 0.54 s |
| the long request's own prefill (stress p95) | 42.2 s | 42.7 s (+1%) |
A single short request finishes in 3.8 s. Two at once both start within 3 s, but they share the GPU with the prefill and generate slowly, 1 to 2 tokens/s, until the long prompt finishes. A third request waits for one of them, because the limit is 2.
The patches are two upstream PRs: #755 aborts prefill on cancel (small, and useful to anyone running FastLLM), and #756 is the scheduler change, stacked on #755. Neither is merged yet, so you have to build FastLLM yourself.
Building it: a2bf07fd, one revert, two PR merges
The environment is the same as Part 20: two modded 2080 Ti 22G, an NCCL build with sm_75 (my self-built 2.31.2), CUDA 12.4 (nvcc), GCC 13 and a Python 3.14 venv. The model is orcarouter/Qwen3.8-27B-Uncensored-FP8 and the draft is z-lab/Qwen3.8-27B-DFlash2.
Get the source. I checked that these merges apply cleanly on a2bf07fd and that the result compiles.
git clone https://github.com/ztxz16/fastllm && cd fastllm
git checkout -b dual-2080ti a2bf07fd
git revert --no-edit d4b04876                  # the commit that lowers DFlash2 acceptance
git fetch origin pull/749/head:pr749 pull/756/head:pr756
git merge --no-edit pr749                      # custom AllReduce registration cache grows without bound
git merge --no-edit pr756                      # already contains #755
#749 is a fix I sent upstream in September. DFlash2 on two GPUs allocates a pointer table on every step and never frees it, so long conversations eventually fill GPU0.
Build and install:
mkdir build-fastllm && cd build-fastllm
cmake .. -DUSE_CUDA=ON -DUSE_NUMAS=OFF -DCUDA_ARCH=75 -DCMAKE_CUDA_ARCHITECTURES=75 \
  -DCMAKE_CUDA_COMPILER=/usr/bin/nvcc \
  -DCMAKE_CUDA_FLAGS="-D_AMXTILEINTRIN_H_INCLUDED -D_AMXINT8INTRIN_H_INCLUDED -D_AMXBF16INTRIN_H_INCLUDED -D_AMXCOMPLEXINTRIN_H_INCLUDED"
make -j24 fastllm_tools
cd tools && ~/venvs/ftllm-dual/bin/pip install --no-deps --force-reinstall .
The -D_AMX... flags work around a CUDA 12.4 + GCC 13 problem; without them the AMX headers fail to compile. The result is the same ftllm package with the same ftllm server command.
Launching it: --tokens removed, two env vars added, 222,080 tokens per session
export LD_PRELOAD=/home/coolthor/nccl-install/lib/libnccl.so.2   # NCCL with sm_75
export CUDA_VISIBLE_DEVICES=0,1
export FASTLLM_CUDA_GRAPH=0                   # still required for DFlash2 on sm_75
export FASTLLM_DRAFT_QUANT=nvfp4              # default already; explicit for clarity
export FASTLLM_COOPERATIVE_LONG_PREFILL=1     # the PR #756 switch

~/venvs/ftllm-dual/bin/ftllm server \
  -p /mnt/nvme1t/models/qwen38-27b-uncensored-fp8 --model_name qwen38-27b-ud \
  --tp 2 --max_batch 2 --chunked_prefill_size 4096 \
  --gpu_mem_ratio 0.95 --kv_cache_dtype fp4 \
  --speculative_algorithm dflash \
  --speculative_draft_model_path /mnt/nvme1t/models/dflash2-qwen38-zlab \
  --speculative_num_draft_tokens 8 \
  --prefix_cache true \
  --chat_template /mnt/nvme1t/models/qwen-fastllm-low/chat_template.jinja \
  --host 0.0.0.0 --port 8082
Compared with Part 20: --tokens 262144 is gone, --max_batch is 2, --chunked_prefill_size 4096 is new, and there are two new environment variables. The chat template is the one from Part 20, with reasoning effort defaulting to low.
After it starts, check the log. There should be no max_batch limited line, and there should be this one:
Model context window: 222080 tokens per session
Four gotchas that silently cost speed or concurrency
--max_batch 2with--tokensclamps to 1, with only a log line to tell you. Drop--tokens.- Upstream latest drops code from 102 to 85 tok/s on this hardware. Revert
d4b04876. - CUDA Graph stays off. Once the draft is NVFP4, the new version no longer crashes on the first request with the graph on, but it runs 11% slower. Keep
FASTLLM_CUDA_GRAPH=0. --chunked_prefill_sizedoes not let short requests in. You need the #756 build andFASTLLM_COOPERATIVE_LONG_PREFILL=1.
Capability: 132 of 140 without thinking, 127 with it
Same 140 questions as Part 20: GSM8K 50, MATH-500 30, MuSR 20, HumanEval+ 40. Focus on the total column.
| GSM8K | MATH-500 | MuSR | HumanEval+ | total | |
|---|---|---|---|---|---|
| previous, no thinking | 49 | 29 | 15 | 35 | 128 |
| this build, no thinking | 50 | 30 | 16 | 36 | 132 |
| previous, thinking + effort low | 50 | 30 | 9 | 36 | 125 |
| this build, thinking + effort low | 49 | 30 | 12 | 36 | 127 |
The main model's weights didn't change, so I read this as "no worse"; the gains are within noise. These runs used the build before the scheduler patch went in. After adding it, a 20-question smoke test came back 20/20.
So, can it go faster?
So far I've only touched code and scheduling. The main model's weights are still FP8, and generating each token still reads 29 GB. The 2080 Ti has no FP4 hardware, so does squeezing the main model down to 4 bits help at all? Next part.
Deep dive: bisecting 87 commits, why chunking never yields, and two regressions the stress test caught
You can skip this section without losing anything you need to run the setup. It's the full record: the bisect, the source reading behind the scheduler patch, and the stress-test failures that shaped the final version.
Bisecting the code-speed regression down to d4b04876
At each bisect step I built an unmodified upstream revision, started it on a separate port, and ran the code prompt 3 times for a median. At or above 96 tok/s counted as good, at or below 89 as bad. Each step took about 10 minutes.
The endpoints matched my patched builds (100.3 and 84.8), so the regression had nothing to do with my patches.
| commit | note | code tok/s | verdict |
|---|---|---|---|
14f849af | previous base | 100.2 | good |
809d34b6 | SM75 decode tuning | 101.9 | good |
00276210 | DFlash draft buffers, CUDA Graph | 101.9 | good |
b2283cc7 | 102.2 | good | |
2dd79d9d | 102.2 | good | |
90fc11e4 | removed DFlash experiment switches | 102.2 | good |
d4b04876 | RMSNorm reduction | 84.7 | bad |
6023b070 | 84.7 | bad | |
a2bf07fd | current upstream | 84.7 | bad |
Acceptance drops, but the kernel isn't wrong
Draft acceptance for the first three positions, before and after d4b04876: 87.2 / 74.4 / 60.9% became 83.9 / 61.2 / 43.5%. Reverting only that commit on a2bf07fd gives code 102.3, math 121.4, prose 70.3.
To check whether the new kernel is less accurate, I fed both kernels synthetic 8×5120 FP16 inputs at magnitudes 0.01, 0.5, 1, 10 and 100 and compared them against an FP32 reference. Both have a max absolute error of about 0.00195. At most 2 of 40,960 values differ between them, by at most 0.000488. I can't call that a bug, and I can't yet explain why it moves acceptance this much.
The logprobs patch has zero effect on speed
My own build also carries #752, which adds OpenAI-style logprobs to the API. I measured with and without it: 100.3 / 100.3 on the old base, 84.8 / 84.7 on the new one. When requests don't ask for logprobs, it costs nothing.
CUDA Graph: the "deadlock" message is a symptom
With FASTLLM_CUDA_GRAPH=1, the new version crashed on the first request with Resource deadlock avoided. That reads like a lock problem. The real error comes earlier in the log: the first decode during graph replay reports cudaErrorIllegalAddress (700). On the way out, the MTP thread calls pthread_join on itself, which is what produces the deadlock message. The thing to look for is the first CUDA error, not the lock.
With the draft in NVFP4, graph mode no longer crashes, but it measured code 105.9, math 120.2, prose 61.1, about 11% slower.
Draft tokens and the SM75 switches: defaults win
4 and 6 draft tokens were both slower than 8. Anything above 8 is rejected by this draft checkpoint, whose block size is 8.
The README lists three switches relevant to SM75: FASTLLM_DFLASH_ATTENTION, FASTLLM_TP_NATIVE_GREEDY and the SM75 decode tuning. Turning each one off changed speed by less than 2%, so I kept the defaults.
Concurrency took three tries
| config | single (code) | two at once | short request during long prefill |
|---|---|---|---|
--max_batch 2 --tokens 262144 | 116.9 | ~58 each, taking turns | waits; log shows the clamp line |
--max_batch 2, no --tokens | 116.7 | 93 each, 186 combined | still waits |
+ --chunked_prefill_size 4096 | 116.2 | 186.6 combined | still waits (38.6 s) |
Where it blocks in the source
For the Qwen3.5 model family with DFlash, FastLLM uses Qwen35MTPLoop. Once it picks the long request, it runs all the chunks inside the inner loop around lines 24327–24489 of src/models/qwen3_5.cpp, and releases the forward lock only near line 24715 (line numbers are at a2bf07fd). The short requests have already arrived and are registered as pending. The scheduler just never looks at them until the whole prefill is done.
What I tried before patching: chunk sizes and env vars
Before patching, I tried every knob that looked related. Short-request first token and long-request prefill time:
| setting | short request first token | long prefill |
|---|---|---|
| baseline, chunk 4096 | 37.4 s | 40.2 s |
FASTLLM_ACTIVE_PREFILL_TOKEN_LIMIT=1024 | 37.7 s | 40.5 s |
FASTLLM_IDLE_PREFILL_BATCH_WAIT_US / QUIET_US tweaks | 37.8–39.6 s | 40.7–42.4 s |
| chunk 1024 | 40.7 s | 43.6 s |
| chunk 2048 | 38.0 s | 40.9 s |
| chunk 8192 | 38.2 s | 41.1 s |
The source explains why none of them helped: ACTIVE_PREFILL_TOKEN_LIMIT only applies in the generic scheduler loop, and the IDLE_PREFILL_* variables are only read in a branch that isn't enabled in this configuration.
Regression 1: faster short requests broke concurrent throughput
The first prototype got the short request's first token down to 1.26 s. Then a 75-minute A/B stress test (same seed, 18 cycles, 252 requests per arm) showed two concurrent generations dropping from 175.5 tok/s combined to 73.3, with one stream stuck around 41 tok/s in every cycle.
The cause was the test order. In the sequence, "two concurrent generations" runs right after "cancel a long request", and cancel didn't abort the prefill. In the original build, the short request after the cancel waited 9.8 s, by which point the cancelled prefill had finished on its own. The prototype served that request in 0.5 s while the main thread was still prefilling the cancelled request. So when the two concurrent generations started, one of them fought the zombie prefill for the GPU and the other waited.
That's where the cancel fix (#755) came from. Same test, three builds:
| metric | original | prototype | fixed |
|---|---|---|---|
| short-insert first token, p95 | 39.7 s | 1.19 s | 1.18 s |
| next request after cancel, median | 9.8 s | 0.54 s | 0.54 s |
| two concurrent generations, combined | 175.5 | 73.3 | 175.7 |
| long prefill, p95 | 42.4 s | 43.1 s | 42.9 s |
| errors / wrong answers | 0 / 0 | 0 / 0 | 0 / 0 |
Regression 2: only one short request got in
The fixed version let in only one short request, not two. The helper thread counted the paused long request as one of its own slots (same file, around lines 23570–23579), so --max_batch 2 left it one slot. Skipping the paused request in that count moved two short requests' first tokens from 1.3 / 36.7 s to 1.3 / 2.7 s. The log now prints Decode alive = 2 between every prefill chunk. Across three restarts, the second request came in at 2.58–2.66 s.
Final 18-cycle regression run
Short-insert p95 1.20 s, post-cancel 0.65 s, two concurrent generations 170.5 tok/s combined, long prefill p95 +2.0%, 0 errors.
Peak VRAM was about 200 MiB higher than the fixed version. I ran the same binary with the switch off for 9 cycles, and it climbed at the same slope. So the increase comes from the newer upstream base, not the scheduler.
Three rounds of code review before submitting
I ran the patch through Codex code review three times before opening the PRs.
Round 1 found a hang. The idle helper waited indefinitely, while the main thread signalled stop without holding the lock. The signal could land between "checked the flag" and "started waiting", and then join() waits forever. The same round found three more issues: after cancel deletes a context, the token-fetch functions re-lock but keep using the old pointer; the helper used the wrong long/short threshold (4096 instead of 2048); and nothing cleaned up if thread creation failed.
Round 2 caught problems in those fixes: the change made the main loop's idle wait wake every 10 ms too, and a thread-creation failure made the scheduler exit. Round 3 passed.
Targeted tests after the fixes: the helper stopped cleanly 50 of 50 times; cancelling while another request streams ran 30 rounds, 90 requests, without a problem; and requests of 2,049–4,096 tokens inserted during a long prefill are not taken over by the helper for their own prefill.
Version pin
- Upstream base
a2bf07fd(2026-09-25), withd4b04876reverted - Merged: #749, #755, #756
- My own build also has #751 (a multimodal prefix-cache fix) and #752 (logprobs). #751 conflicts with
basellm.cppona2bf07fdand has to be resolved by hand. It only matters when an image comes at the end of a long conversation. - CUDA 12.4, GCC 13.4, sm_75, NCCL 2.31.2 self-built
Limitations and next steps
- #755 and #756 aren't merged and may need rebasing.
- Every number here is from two 2080 Tis, TP=2, with DFlash2. The effect of
d4b04876and the gain from the NVFP4 draft may be different on other GPUs. - Two short requests inserted at once still generate slowly (1–2 tok/s) until the long prompt finishes. Fixing that would mean batching short-request decode with long-prompt prefill in the same step, which is a different change.
Also in this series:
FAQ
- Why does FastLLM still serve one request at a time with --max_batch 2?
- Because --tokens is set. Qwen3.8 is a hybrid model: most layers use GDN, a linear-attention variant, and each request carries a sizable recurrent state on top of its KV cache. When --tokens is given explicitly, FastLLM caps that state budget at a hard-coded 25% of the KV space. On two 2080 Tis that fits one request, so FastLLM silently drops concurrency to 1 and logs explicit-token safety max_batch limited 2 -> 1. Remove --tokens and FastLLM sizes the KV pages itself: two requests run at once, 186 tok/s combined, and the per-request context drops from 262,144 to 222,080.
- Can --chunked_prefill_size in FastLLM let short requests in while a long prompt is prefilling?
- No. With Qwen3.8 and DFlash, FastLLM runs a dedicated scheduler loop that, once it picks a long request, runs every prefill chunk in one inner loop without checking the queue. --chunked_prefill_size only sets the chunk size. Across three chunk sizes and three related environment variables, a short request always waited 37-41 s behind a 54K-token prompt. PR #756 adds FASTLLM_COOPERATIVE_LONG_PREFILL=1, which yields between chunks: the p95 time to first token for the short request went from 39.5 s to 1.13 s.
- Why is the latest FastLLM slower with DFlash2 on an RTX 2080 Ti?
- Commit d4b04876, which fixes rounding differences in the small-batch RMSNorm reduction. It touches the RMSNorm kernel for width 5120 and batch 1-8, and both Qwen3.8-27B and the DFlash2 draft have hidden size 5120. With it, draft acceptance at position 3 drops from 60.9% to 43.5%, and code falls from about 102 to 85 tok/s. Reverting that one commit on a2bf07fd brings code back to 102.3. Against an FP32 reference both kernels show the same error, so it is not a bug, and other GPUs may be unaffected.
- Does cancelling a request in FastLLM stop the GPU from prefilling it?
- Not upstream. Cancelling only marks the request aborted, and the prefill loop never checks that flag, so the GPU finishes the whole prompt. After cancelling a 54K-token request, the next request waited 9.8 s for its first token. PR #755 checks the flag between prefill chunks, and the next request is served in 0.54 s. Chunks already prefilled stay in the prefix cache, so resending the same prompt hits it.
- How much faster is the new FastLLM build than the previous one on two 2080 Tis?
- On the same machine and script, code went from 100.3 to 116.1 tok/s, math from 118.6 to 135.5 and prose from 64.8 to 74.2. That is temperature 0, 512 tokens, median of three runs. The gain comes from upstream a2bf07fd with commit d4b04876 reverted, plus the DFlash2 draft quantized to NVFP4. With the previous article's prompts the new build does 175.3, 154.1 and 64.7.
- Does quantizing the DFlash2 draft to NVFP4 change the model's answers?
- No. FASTLLM_DRAFT_QUANT=nvfp4 only quantizes the 5-layer, 3.6 GB draft. The main model's weights are untouched, and the main model still verifies every token, so it only shortens the guessing phase. On 140 questions the build scored 132 without thinking and 127 with thinking at effort low, against 128 and 125 before.
Read next
- 2026-09-28NVFP4 Without FP4 Hardware: Qwen3.8-27B on Two RTX 2080 Tis at 151.7 tok/s
No FP4 hardware, still faster: a self-converted NVFP4 Qwen3.8-27B on two 2080 Tis runs code at 151.7 tok/s (was 116.1) and serves 4 requests at once.
- 2026-09-21Two Modded RTX 2080 Tis Hit 153.8 tok/s on Qwen3.8-27B With FastLLM + DFlash2
FastLLM plus a DFlash2 draft runs Qwen3.8-27B FP8 at 153.8 tok/s on code across two modded 2080 Tis. Prose drops to 53.1. Full recipe and four traps.
- 2026-08-21[Benchmark] Free 15% Speedup on a 2080 Ti: One Broken Chat Template, One Starving MTP Head
A frozen GGUF chat template was killing my KV cache; a community fix plus MTP draft depth 4 took Qwen3.8-27B from 41.6 to 47.6 tok/s on a 2080 Ti 22GB.
- 2026-09-21Ternary Bonsai 2 on One RTX 2080 Ti: Qwen3.8-27B in 7.2 GB Scores 130 of 140
Ternary Bonsai 2 27B scored 130/140 on one modded 2080 Ti vs 131 for Qwen3.8-27B Q8_0 on two cards. Build steps, the flag that matters, why smaller is slower.
Don't miss the next one
Subscribe, and you won't.
One-click unsubscribe anytime.