改裝 2080 Ti 22G · part 16
[Benchmark] Fixing NCCL's Stub-Library Error Cut PCIe Traffic 99% and Barely Moved Speed
❯ cat --toc
- The symptom looks like "old GPU not supported," and it isn't
- What's established: Ubuntu's NCCL 2.22.3 doesn't match a CUDA 13 driver
- The fix: build NCCL 2.31.2 with sm_75 gencode
- Trap 1: `src.install` rebuilt without my gencode
- Trap 2: no `CUDA_HOME` and it fails in about five seconds
- PCIe traffic fell 99%, speed rose 14.6% — read the units column carefully
- How I know AllReduce's PCIe cost went to zero, not just down
- Then the speed barely moved
- Traffic down 99%, speed flat — where did the win go?
- This narrows Part 15's split-mode advice
- Advanced: five hypotheses I killed on the way here
- Hypothesis 1: Turing has no bf16, so NCCL's bf16 AllReduce can't work
- Hypothesis 2: the packaged library has no sm_75 kernels
- Hypothesis 3: the driver itself is broken
- Hypothesis 4: P2P or NVLink isn't working
- Hypothesis 5: an environment variable can work around it
- Going dual-card silently disables CUDA graphs
- What I did not isolate: version or gencode
- Measurement conditions
- Takeaways
TL;DR
Ubuntu Questing's libnccl2 2.22.3 links, loads a model, and then dies on the first real request against a CUDA 13.0 driver: Cuda failure 'CUDA driver is a stub library'. Building NCCL v2.31.2 from source with sm_75 gencode fixes it, with no llama.cpp rebuild. The result is the interesting part. PCIe traffic per card fell from 1,286 MB/s to 15 MB/s, a 99% drop — and code generation went from 55.65 to 56.24 tok/s, which is a tie. Prefill gained 14.6%, and time to first token at 20K context gained 13%. The bus was never the bottleneck.
A new bridge opens and the ten-mile detour you have been driving for a year disappears. Your commute gets a minute shorter. The miles were never what made it slow — it was the twelve traffic lights, and the bridge removed none of them.
This is Part 16 of the modded-2080-Ti series. Part 14 got two 22GB cards to 59.632 tok/s on Qwen3.8-27B with llama.cpp tensor parallel, and in its FAQ I wrote that NCCL was a no-go on this machine. That sentence was wrong. I had issued a verdict without ever capturing an error message, and this article is the correction. Part 15 then measured how much PCIe bandwidth the AllReduce eats — an AllReduce being the step where two GPUs combine their partial results back into one answer, which happens constantly once you split a model's math across cards. Every number in Part 15 was measured on the fallback path, because of the failure in this article.
So this part fixes it. And the honest headline is that fixing it barely helped, which turned out to be more useful than a win.
The symptom looks like "old GPU not supported," and it isn't
This is the trap, and I fell in it. libnccl2 installs from apt. CMake finds it. ldd on llama-server resolves libnccl.so.2 cleanly. The server starts, the model loads, the log looks completely normal. Then the first real request kills the process.
Nothing in that sequence points at a version mismatch. It points at "this five-year-old GPU generation isn't supported anymore," which is exactly the conclusion I jumped to in Part 14.
To see the failure without llama.cpp's 40 layers of machinery on top of it, I wrote a 40-line C program: initialize a communicator across both cards, run one fp32 AllReduce, run one bf16 AllReduce. That is the entire probe.
== [1] ncclCommInitAll ==
  init OK

== [2] AllReduce fp32 ==
  !! NCCL FAIL -> unhandled cuda error
Init succeeds. The first collective fails. That boundary is the whole diagnosis in one line: ncclCommInitAll is mostly host-side setup — topology discovery, allocating buffers, opening peer handles — while the first collective is the first moment a kernel actually has to launch on the GPU. Something between those two points is broken, and it is not the GPU's ability to hold the communicator.
Turning on NCCL's own logging gives the line that names it:
NCCL_DEBUG=INFO ./nccl_probe
misc/strongstream.cc:60 NCCL WARN Cuda failure 'CUDA driver is a stub library'
What's established: Ubuntu's NCCL 2.22.3 doesn't match a CUDA 13 driver
CUDA_ERROR_STUB_LIBRARY is a real error code — 34. The CUDA toolkit ships stubs/libcuda.so, a fake library that exists so you can link CUDA programs on a build machine that has no GPU driver installed. Its functions are a few bytes each and they return exactly this code. So the error is telling us something specific: a real stub entry point got called.
So my first instinct was that the stub had ended up on the library search path. It hadn't. The symlink chain is exactly right:
libcuda.so -> libcuda.so.1 -> libcuda.so.580.173.02 (96 MB, the real driver)
The stub is 70 KB and sits in a toolkit directory nothing in this process looks at. libnccl.so.2 has no RUNPATH pointing at it either. And the driver works: cuInit(0) returns 0, cuDriverGetVersion returns 13000, cuDeviceGetCount sees all three cards in the box.
So this is where the chain breaks. A stub entry point was called, no stub is on any path this process reads, and I could not work out how NCCL got there. I don't have a root cause to give you, only a boundary: on this box the pairing below is broken, and a self-built newer NCCL isn't.
| driver | 580.173.02 — a CUDA 13.0 driver |
| NCCL from apt | libnccl2 2.22.3 — a CUDA 12-era package |
An earlier draft of this section did explain the mechanism. It said that since CUDA 12, cuGetProcAddress hands back a callable stub pointer for symbols the loaded driver doesn't have, and that calling one gives you error 34. Fact-checking killed it: NVIDIA documents a missing symbol as returning CUDA_SUCCESS with a null pfn and CU_GET_PROC_ADDRESS_SYMBOL_NOT_FOUND — no callable stub anywhere in it. I had invented a mechanism to make the story close, which is the exact failure this article is about, so it's staying out.
The package version is release-specific: 2.22.3 is what Ubuntu Questing offers, and there is nothing newer in the archive for it. Noble is on 2.18.5. Either way, the route forward is building NCCL from source.
The fix: build NCCL 2.31.2 with sm_75 gencode
Nothing exotic. Clone NVIDIA/nccl, check out a current tag, build for your architecture, install to your home directory.
git clone https://github.com/NVIDIA/nccl /home/you/nccl-src
cd /home/you/nccl-src
git checkout v2.31.2-1

export CUDA_HOME=/usr          # see trap 2

make -j 16 src.build \
  NVCC_GENCODE="-gencode=arch=compute_75,code=sm_75" \
  PREFIX=/home/you/nccl-install
make src.install \
  NVCC_GENCODE="-gencode=arch=compute_75,code=sm_75" \
  PREFIX=/home/you/nccl-install
NVCC_GENCODE is the flag that decides which GPU architectures get real compiled kernels baked into the library. compute_75 / sm_75 is Turing, which is what a 2080 Ti is.
Then point llama.cpp at it:
LD_LIBRARY_PATH=/home/you/nccl-install/lib
# and do NOT set GGML_CUDA_ALLREDUCE=internal — on Linux, NCCL is already the default
No llama.cpp rebuild is needed. llama-server links libnccl.so.2 dynamically, so swapping the search path is the entire deployment. Verify with ldd that libnccl.so.2 now resolves to the home-built copy instead of /usr/lib/x86_64-linux-gnu/. The system library is never touched, and rollback is deleting one environment variable. (That assumes the ordinary shared-library build, which is what you get by default — a build that statically links NCCL wouldn't respond to a path swap at all.)
Trap 1: src.install rebuilt without my gencode
This is the nastiest one, because nothing errors.
I passed NVCC_GENCODE to src.build and not to src.install, and the install step started compiling again rather than installing what I had just built. The saved build log has the flags going past — -gencode=arch=compute_60,code=sm_60 through sm_90, no sm_75 anywhere — and real compilation starting behind them. The build output looks fine. The install output looks fine. You would go on believing you built it correctly.
Two things bound that claim, because it is one observation rather than a documented property of NCCL's build system. It is what happened on this setup and I have the log; someone reading the Makefiles could reasonably conclude it shouldn't happen. And the default architecture set depends on your CUDA toolkit — this box runs CUDA 12.4, whose defaults exclude sm_75. On a CUDA 13 toolkit the defaults already include it, and the omission costs you nothing.
Which is the argument for verifying rather than believing, whichever toolkit you're on:
cuobjdump --list-elf /home/you/nccl-install/lib/libnccl.so | grep -oE 'sm_[0-9]+' | sort -u
sm_75 should be in that list.
Trap 2: no CUDA_HOME and it fails in about five seconds
Upstream's Makefile looks for /usr/local/cuda/bin/nvcc, which is where NVIDIA's own installer puts it. Distro packages put nvcc in /usr/bin. Hence export CUDA_HOME=/usr. This one is loud and immediate, which makes it the pleasant kind of trap.
PCIe traffic fell 99%, speed rose 14.6% — read the units column carefully
Here is prefill, the phase where the model chews through your prompt before it writes anything. One table, both quantities, units side by side — because the first person I showed this to read the 99% drop as a slowdown.
| prefill | over PCIe (internal) | over NCCL | change |
|---|---|---|---|
| PCIe traffic, rx per card | 1,286 MB/s | 15 MB/s | down 99% |
| PCIe traffic, tx per card | 1,342 MB/s | 5 MB/s | down 99.6% |
| speed | 800 tok/s | 917 tok/s | up 14.6% |
MB/s is bus traffic. tok/s is speed. In this table they move in opposite directions, and that is the point: less traffic, more speed.
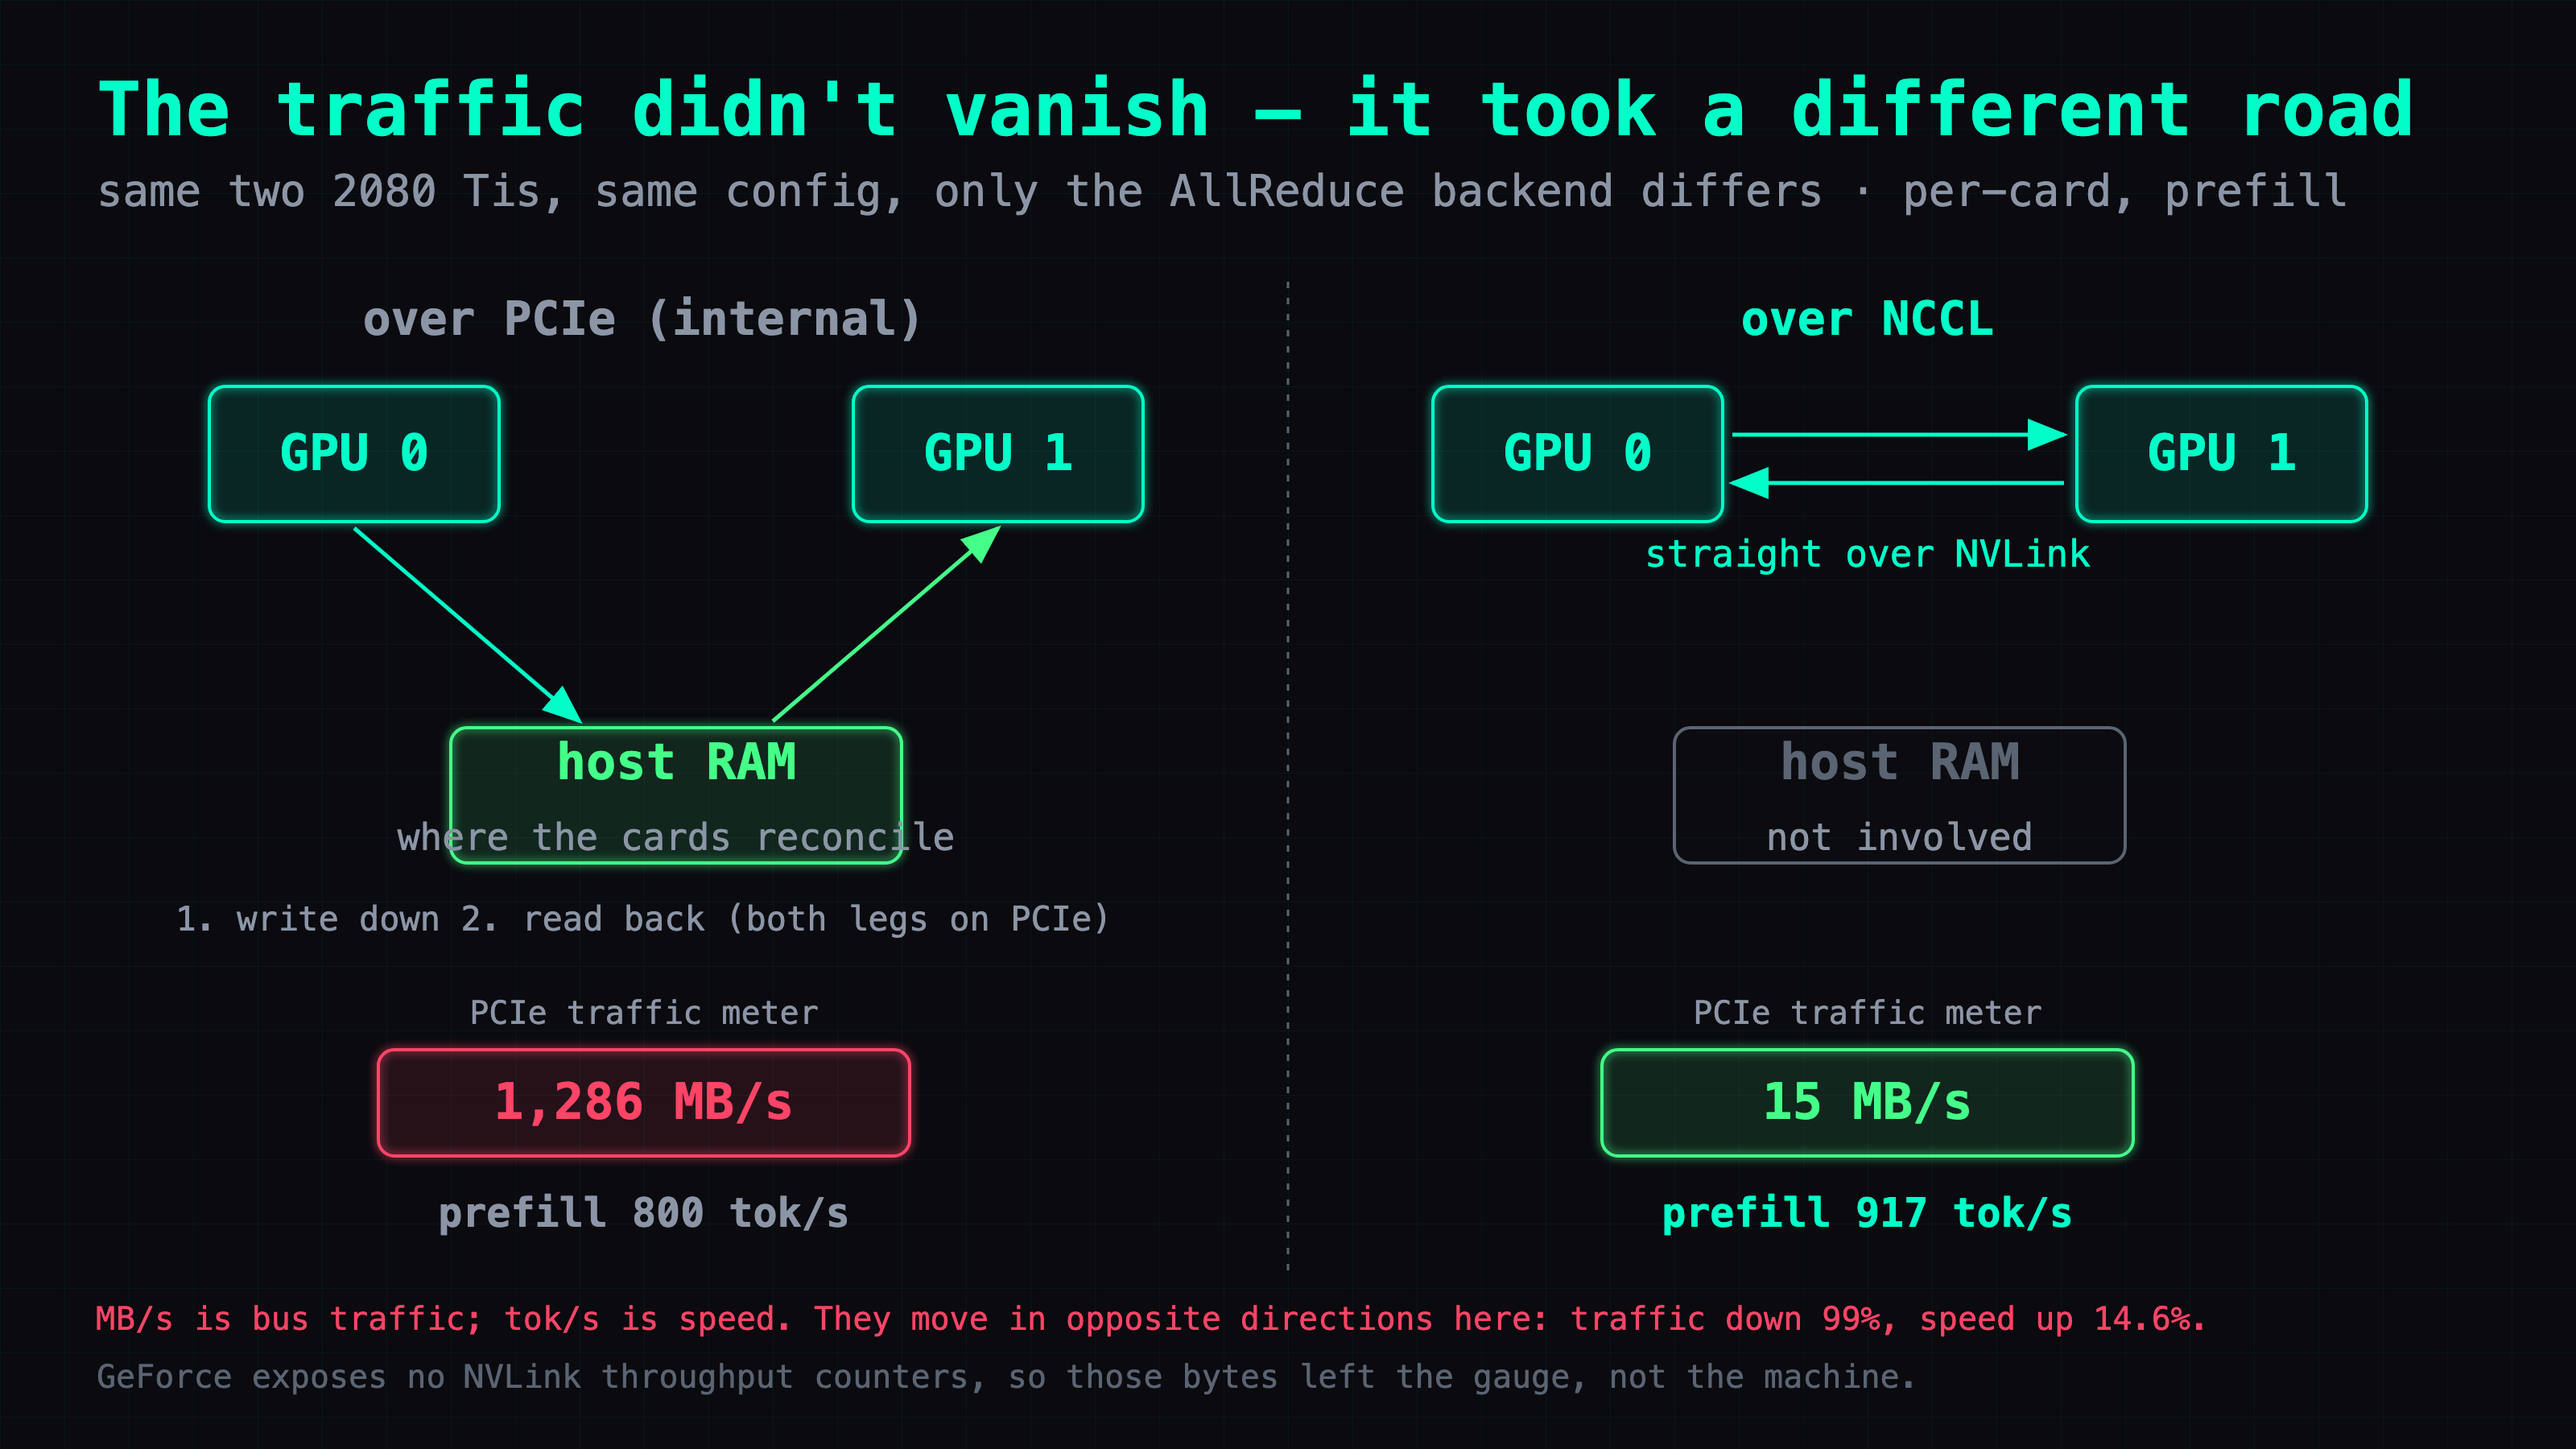
The mechanism is a reroute, not a saving. On GGML_CUDA_ALLREDUCE=internal, every AllReduce byte crosses PCIe twice: each card writes its half down into pinned host memory, then reads the peer's half back up. A prefill batch's payload is large, so that 1.3 GB/s was almost entirely AllReduce and almost nothing else. On NCCL, the two GPUs talk directly over the NVLink bridge and the host-memory stop doesn't exist. What's left on PCIe is what always belonged there — the prompt going up once, logits coming back.
How I know AllReduce's PCIe cost went to zero, not just down
A 99% drop still leaves 15 MB/s. Is that a residual AllReduce, or something else entirely? The way to tell is to compare against a run that has no AllReduce at all, which is a single card.
| prefill, rx per card | MB/s |
|---|---|
| single GPU — no AllReduce at all | 10 |
| dual + NCCL | 15 |
dual + internal | 1,286 |
Look at the top two rows. NCCL lands back on the single-card floor. AllReduce's contribution to PCIe really did go to zero; the 15 MB/s that remains was never AllReduce in the first place.
Decode does the same thing — 35 MB/s against a single-card 31 — it just looks like a much smaller drop. That's because only about 101 of decode's 132 MB/s was AllReduce to begin with; the rest is token I/O and MTP draft traffic. Both phases go to zero. The percentages differ only because AllReduce's share of the total differed between them.
And on the NVLink side, GeForce cards expose no throughput counters at all, so I can't show those bytes arriving. They left the gauge, not the machine.
Then the speed barely moved
Code generation is what this box actually does all day, so it is the number I care about. Five runs each:
| tok/s median | range | MTP accept rate | |
|---|---|---|---|
over PCIe (internal) | 55.65 | 50.88–56.72 | 77.9% |
| over NCCL | 56.24 | 55.66–59.01 | 73.1% |
That is a tie. One percent apart on the median, and the ranges overlap heavily. The difference does not hold up, and I can't claim NCCL is faster here.
There's a curiosity buried in the last column. MTP is the model's built-in draft head, which guesses several tokens ahead so the big model can verify them in one pass; the accept rate is how often those guesses survive. The PCIe arm had the higher accept rate — 77.9 against 73.1 — and still didn't come out ahead. It was getting more free tokens per forward pass and ending up in the same place, which suggests NCCL is doing slightly more real work per unit time. Just not enough to see.
Time to first token does differ, and it differs in the place it should. Seven runs each:
| context depth | over PCIe | over NCCL | |
|---|---|---|---|
| short prompt | 592 ms | 569 ms | ranges overlap, doesn't count |
| ~4K | 1,723 ms | 1,514 ms | 12% faster |
| ~20K | 6,632 ms | 5,779 ms | 13% faster |
Deeper context, bigger gap. And at depth the ranges don't overlap at all — 5,729–5,786 against 6,598–6,865 — so this is the one claim in the whole article that stands up cleanly.
One more thing worth having, which isn't a median. The PCIe arm's code throughput swings across 50.88–56.72, an 11% spread. NCCL's swings across 55.66–59.01, 6%. "Occasionally much slower" damages the felt experience of a coding assistant more than "slightly slower on average" does, and that 50.88 is what occasionally-much-slower looks like on a chart.
Traffic down 99%, speed flat — where did the win go?
Back to what Part 15 measured: that bus was never full. The busiest single cell in the whole PCIe run was 8.2% of Gen3 x16. Going from 8.2% utilization to 0.1% frees a road that already had nobody on it.
What actually limits token generation is round-trip count, not bytes. Every token, every layer: write your half out, wait for the other card, read the combined result back. A faster wire makes each of those trips shorter. It removes none of them, and there are thousands.
That explains the shape of every number above:
- Prefill pushes one big payload through the interconnect. Transport dominates, so changing the wire helps — +14.6%.
- Generation moves tens of KB at a time but does it dozens of times per token. Latency dominates, and the wire barely matters — a tie.
- Time to first token gains 12–13% because getting to the first token means shoving the entire prompt through once. That is a prefill.
So I fixed it, and it barely helped. The 99% drop with a flat speed number is not a disappointing result; it is a measurement that tells you where the bottleneck isn't, and it heads off an entire category of advice — buy a Gen4 board, add a bridge, get a faster link — that would have cost money and changed nothing.
This narrows Part 15's split-mode advice
Part 15 measured prefill as fastest on dual layer split — 944.8 tok/s against tensor split's 844.9 — and recommended layer split for prefill-heavy work: long prompt, short answer. That recommendation holds for the backend that article measured. On NCCL, tensor split's prefill goes from 800 to 917 tok/s in my runs here, close enough to layer split's 944.8 that the tradeoff largely disappears. So if Part 15 sent you to layer split, it's worth re-running that comparison once NCCL is working.
Advanced: five hypotheses I killed on the way here
Skip this section if you just wanted the fix; everything needed to reproduce it is above. What follows is the diagnosis, which took considerably longer than the fix and consisted mostly of refuting myself.
Hypothesis 1: Turing has no bf16, so NCCL's bf16 AllReduce can't work
llama.cpp compresses large AllReduce tensors to bf16 before sending them. Turing has no native bf16 support. That is a genuine, checkable incompatibility, and it was my first guess — I expected the fix to be forcing fp32 reductions somewhere in llama.cpp's CUDA backend.
That's what the 40-line probe was for: one fp32 AllReduce and one bf16 AllReduce, in that order, so I could see which one died. The fp32 call failed first, with the identical error. The bf16 call never even ran.
Wrong, and wrong in a useful way: the failure had nothing to do with data type, which meant it also had nothing to do with llama.cpp. I had been reasoning about a layer above the actual problem.
Hypothesis 2: the packaged library has no sm_75 kernels
Next guess, and this one had hard evidence behind it. Dump the architectures compiled into the packaged library:
cuobjdump --list-elf /usr/lib/x86_64-linux-gnu/libnccl.so.2 | grep -oE 'sm_[0-9]+' | sort -u
sm_50 sm_60 sm_61 sm_70 sm_80 sm_90
No sm_75. And --list-ptx comes back empty, so there isn't even PTX — the intermediate form CUDA can compile on the fly for an architecture it wasn't built for — to fall back on. I thought this was conclusive: no kernels for my card, no PTX to generate them from, case closed, and the fix would be a rebuild with the right gencode.
Then someone knocked it down in one sentence: you have the hardware, why wouldn't it compile?
They were right, and the reason is a rule I knew and hadn't applied. CUDA's binary compatibility rule is that a cubin built for compute capability X.y runs on X.z as long as z ≥ y. sm_70 is 7.0. The 2080 Ti is 7.5. Same major version, higher minor — those kernels should load and run fine on my card.
The reflection here is the one I keep: I had taken an observation ("this library contains no sm_75") and promoted it to a cause ("therefore it cannot run on my card") without ever testing the step in between. The observation was true. The inference was mine, and it was wrong.
Hypothesis 3: the driver itself is broken
By this point "CUDA driver is a stub library" was on the screen, and the most literal reading is that the driver is somehow the stub. I expected to find the toolkit's stubs/ directory ahead of the real driver on the search path — a classic misconfiguration, and an easy fix.
So I called the driver API directly, outside NCCL:
cuInit(0)              -> 0
cuDriverGetVersion     -> 13000
cuDeviceGetCount       -> 3
All three succeed. The symlink chain resolves to the real 96 MB libcuda.so.580.173.02, and the 70 KB stub isn't anywhere this process looks. The driver was never the problem.
That killed the misconfiguration story, and it is also where the diagnosis stops being a clean chain. I went looking for how NCCL could reach a stub entry point when no stub is on any path this process reads: libnccl.so.2 has no RUNPATH into the toolkit's stubs/ directory, and the driver resolves to the real library. I never found the route.
Which left me with a version mismatch I could act on and a mechanism I couldn't demonstrate. My expectation going into this hypothesis — that a stub error means a stub file in the wrong place — was wrong in a way I couldn't replace with anything better, so I stopped trying to explain the failure and started trying to replace the component.
Hypothesis 4: P2P or NVLink isn't working
Worth ruling out, since the collective is exactly where peer access would first matter. I expected to find peer access disabled, in which case the fix is NCCL_P2P_DISABLE=1 and a slower but working path.
cudaDeviceCanAccessPeer returns 1 in both directions. NCCL's own NCCL_DEBUG=INFO output shows all four channels coming up via P2P/direct pointer — meaning NCCL had already established the fast GPU-to-GPU route before it died. The topology was healthy the entire time. The failure is downstream of it.
Hypothesis 5: an environment variable can work around it
The cheap-shot phase. NCCL has a large surface of environment switches, and if one of them dodges the broken code path, that's a fix with no compiler involved. I tried:
NCCL_CUMEM_ENABLE=0NCCL_P2P_DISABLE=1- both together
NCCL_GRAPH_MIXING_SUPPORT=0NCCL_LAUNCH_MODE=PARALLEL
All five failed identically, at the same failure site, with the same message. Which is itself informative: a failure that ignores every configuration knob is not a configuration problem. That was the point I stopped looking for a workaround and started building from source.
Going dual-card silently disables CUDA graphs
Unrelated to NCCL, but I ran into it while reading the CUDA backend and it affects every dual-GPU llama.cpp setup:
if (!use_cuda_graph || ggml_backend_cuda_get_device_count() != 1) {
    return;
}
Any device count other than 1 and the CUDA graph optimization is skipped entirely. CUDA graphs replay a pre-recorded sequence of kernel launches instead of issuing them one at a time, which mostly buys back launch overhead — exactly the kind of per-token cost that matters at decode.
So going dual-card means giving up CUDA graphs. It is a fixed cost, unrelated to AllReduce, and both paths in this article pay it equally, so it doesn't affect any comparison above. It does go some way toward explaining why dual-card generation gains never match the "two cards, twice the speed" intuition.
What I did not isolate: version or gencode
Being honest about the limit of this result. I changed two things at once:
| before | after | |
|---|---|---|
| NCCL version | 2.22.3 | 2.31.2 |
| gencode | no sm_75 | sm_75 |
I never built a third library — 2.22.3 with sm_75 added — to separate them.
The circumstantial evidence favours the version. The error was CUDA driver is a stub library, which is a driver-API compatibility failure, not no kernel image is available for execution on the device, which is what an architecture miss actually looks like. And by the binary compatibility rule from hypothesis 2, the packaged library's sm_70 kernels should have run on a 7.5 card regardless.
But circumstantial is the right word. This article demonstrates that a newer build fixes it. It does not identify the line the old one broke on.
Measurement conditions
Same EPYC box throughout, two modded 22GB 2080 Tis on GPU0/GPU1, PCIe Gen3 x16 with an NVLink bridge between them, llama.cpp b10064.
PCIe traffic plus prefill and decode throughput:
- Huihui Qwen3.8-27B abliterated, Q4_K
-sm tensor, 262K context,--parallel 2, MTPn=3, KV cache at f16- 3 repetitions per arm
Code tok/s and TTFT — the config that actually serves traffic on this box:
- orcarouter Qwen3.8-27B, Q8_0
-ctk q8_0 -ctv q8_0, otherwise identical- 5 repetitions for code, 7 for TTFT
⚠️ Those two sets use different models — Q4_K versus Q8_0 — and their numbers are not comparable to each other. The first set exists so it lines up with Part 14's published baseline. The second set answers a different question: did the thing I actually use every day get faster.
TTFT was measured on a streaming response, as wall-clock time from sending the request to the arrival of the first chunk containing content. Not the server's own timings fields, which are only computable after the run finishes and cannot see the part of the wait you spend staring at an empty screen.
Takeaways
- Don't issue a verdict without an error message. "I couldn't get it working" and "it doesn't work" are separated by an entire diagnosis. I skipped that diagnosis in Part 14 and the wrong sentence sat on this site for a day.
- An observation is not a cause. "This library contains no sm_75" was true and verifiable. "Therefore it can't run on my card" was something I added on top, and it sent me down the wrong road for hours.
- Traffic falling 99% while speed stays flat is the result, not a failed result. It proves the bottleneck was never on that link — which is more useful than a 15% win, because it forecloses a whole category of "just get a faster interconnect" advice before anyone spends money on it.
Also in this series: Part 15: A reader asked how much PCIe dual-GPU AllReduce eats · Part 14: Two Modded 2080 Tis Reach 59.6 tok/s
FAQ
- What does NCCL's 'CUDA driver is a stub library' error mean?
- It is CUDA error 34, CUDA_ERROR_STUB_LIBRARY, and it means something called into a real stub CUDA driver entry point — the few-byte functions in the toolkit's stubs/libcuda.so that exist so you can link on a machine with no driver. It does not necessarily mean that stub is on your search path. On my box it wasn't: the symlink chain resolved to the real 96 MB driver, libnccl.so.2 had no RUNPATH pointing at stubs, and direct driver API calls all succeeded. I could not trace how NCCL reached a stub entry point. What I can demonstrate is the pairing: Ubuntu Questing's libnccl2 2.22.3, a CUDA-12-era package, against driver 580.173.02, a CUDA 13.0 driver. Init succeeds because it is mostly host-side work; the first collective is where a kernel actually launches, and that is where it dies.
- Do I need to rebuild llama.cpp after building NCCL from source?
- No. llama-server links libnccl.so.2 dynamically, so pointing LD_LIBRARY_PATH at your own build is enough. Confirm with ldd that libnccl.so.2 resolves to the home-built copy rather than the system one. The system library stays untouched and rollback is removing a single environment variable.
- Does building NCCL from source need an explicit sm_75 gencode for a 2080 Ti?
- Pass it to both make targets, and verify afterwards rather than assuming. On my setup — CUDA 12.4 toolkit — omitting NVCC_GENCODE on src.install made the install step rebuild with upstream defaults (sm_60/70/80/90, no sm_75) and install a library my card had no kernels in, with nothing in the output to say so. Whether this can bite you depends on your toolkit: a CUDA 13 toolkit's default architecture set already includes sm_75, so the omission costs nothing there. Check either way with cuobjdump --list-elf on the installed .so and grep for sm_75.
- Is NCCL faster than GGML_CUDA_ALLREDUCE=internal for llama.cpp tensor parallel on two GPUs?
- Barely, and not where you would expect. On two modded 2080 Tis, NCCL cut PCIe traffic by 99% but code generation came out 55.65 vs 56.24 tok/s — a tie, with overlapping ranges. Prefill gained 14.6% and time to first token at 20K context gained 13%, because both of those push one large payload through the interconnect once. Steady-state generation is limited by how many round trips happen per token, not by how many bytes each one carries, so a faster wire has almost nothing to shorten.
Read next
- 2026-08-23[Benchmark] Dual-GPU AllReduce Only Uses 8% of PCIe Gen3 x16 — It Moves Little, Very Often
Measured with nvidia-smi dmon on two modded 2080 Tis: AllReduce costs 67 MB/s at decode and 973 MB/s at prefill, and the bus peaks at 8.2% of Gen3 x16.
- 2026-08-22[Benchmark] Two Modded 2080 Tis Reach 59.6 tok/s on Qwen3.8-27B With llama.cpp Tensor Parallel
Two modded 22GB RTX 2080 Tis hit 59.6 tok/s on Qwen3.8-27B using llama.cpp's -sm tensor split mode plus MTP, after -sm row was deleted upstream. Config, gotchas and the failed routes included.
- 2026-09-21Ternary Bonsai 2 on One RTX 2080 Ti: Qwen3.8-27B in 7.2 GB Scores 130 of 140
Ternary Bonsai 2 27B scored 130/140 on one modded 2080 Ti vs 131 for Qwen3.8-27B Q8_0 on two cards. Build steps, the flag that matters, why smaller is slower.
- 2026-08-28[Benchmark] A 177B MoE on Three Modded 2080 Tis: 23 tok/s at 128K, 77 on a File Edit
Qwen3.8-Flash-Next (176.94B, arch qwen4exp) runs on 3× modded 2080 Ti 22G at 23.14 tok/s at 128K context — and 3.51× that on a file edit, with no draft model.
Don't miss the next one
Subscribe, and you won't.
One-click unsubscribe anytime.