改裝 2080 Ti 22G · part 28
[Benchmark] Idol Image-to-3D on a Modded RTX 2080 Ti: Fix the cuDNN Crash, 84.8 s → 72.7 s
❯ cat --toc
- What you need: a CUDA GPU and access to two gated encoders
- Install with uv
- A README that returns 200 doesn't mean you have access
- No FLUX.2-dev access? Point the config at the FLUX.2-klein-4B VAE
- Run it: one image in, a .ply out
- On Turing the default run crashes: cuDNN attention needs sm80+
- The one-line patch: only use cuDNN attention on sm80 and up
- Speed: 72.7 s on the 2080 Ti, 14.9 s on an RTX 5090
- VRAM: 6894 MiB in PyTorch, about 11 GB total in nvidia-smi
- Results: the front matches, the back is a guess
- Which flags to change
- Deep dive: the attention kernel, compile vs batching, VRAM, test conditions
- Optimize bundles three changes; on Turing the gain is from compile
- Profiler: attention runs on a CUTLASS sm75 FP16 kernel
- Compile vs batching: compile accounts for nearly all of the 14%
- On an RTX 5090, optimize cut request time by 12%
- bf16 on Turing is emulated
- Reproducibility: bit-identical on one machine, different across GPUs
- Two VRAM numbers, two definitions
- Caveats from testing on a shared GPU
- Test conditions
- How the turntables were rendered
TL;DR
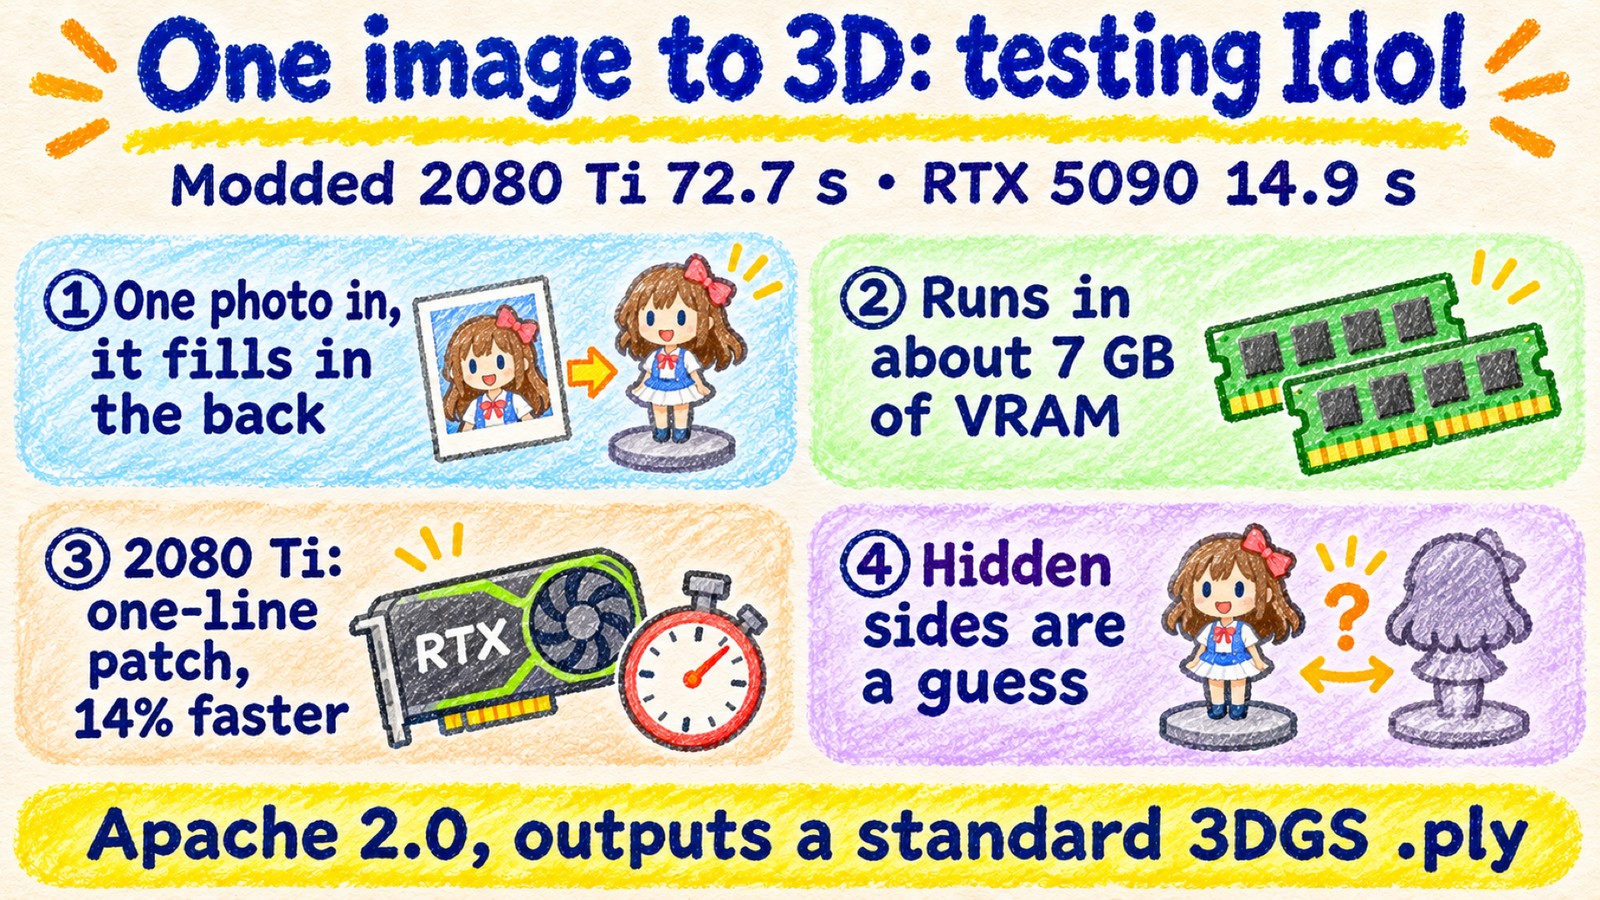
Idol (speridlabs, Apache-2.0) turns one image into a 3D Gaussian splat. Its speed table stops at Ampere, so I ran it on a modded RTX 2080 Ti 22GB. The default run crashes: the optimize path forces cuDNN attention, which only has kernels for sm80 and up. --no_optimize works at 84.8 s per image. A one-line patch that skips cuDNN attention below compute capability 8.0 keeps torch.compile and gets 72.7 s (−14%), mostly from compile. An RTX 5090 does 14.9 s. PyTorch peak VRAM is 6894 MiB. The hidden sides are plausible guesses, not reconstructions.
Speed tables for new models usually stop at the oldest card the authors had lying around. For Idol, that card is an RTX 3080 at 46.2 s per image. Nothing older is listed.
Idol takes one picture of an object and outputs a 3D Gaussian splat: a cloud of small, colored, semi-transparent blobs that renders as a 3D object from any angle. It's Apache-2.0, it writes a standard 3DGS .ply, and the card lists a 7.2 GB VRAM peak. That leaves plenty of room on a 22GB card, so I tried it on my modded RTX 2080 Ti 22GB.
The default run crashed about 8 seconds in. This post covers the setup (including two gated encoders), the crash, a one-line patch that runs it 14% faster than the official workaround, and what the output actually looks like. Part 27 was about the FP16 tensor cores on these cards; this one is about a new model that never planned for Turing at all.
Three objects, each made from a single image: a figure of a woman in traditional Chinese dress, an axolotl toy, and a generated image of an RTX 2080 Ti. The front of each matches its input. The backs are where the model is guessing, which comes up again in the results.
What you need: a CUDA GPU and access to two gated encoders
Idol's weights are about 3 GB and download from Hugging Face on first run. It also pulls two image encoders from other repos, and both are gated:
- facebook/dinov3-vith16plus-pretrain-lvd1689m
- black-forest-labs/FLUX.2-dev (only its VAE is used)
Request access on both pages and log in with hf auth login. My DINOv3 request came through; FLUX.2-dev is where I got stuck, covered two sections down.
The model card lists the parts: a 370.6M DiT that does the generation, an octree decoder and a Gaussian decoder, BiRefNet for background removal, DINOv3 ViT-H+/16 and the FLUX.2 VAE for reading the image. About 1.80B parameters in total, mostly FP16 and bf16.
Install with uv
I used a separate uv environment with Python 3.11 and the CUDA 12.8 build of PyTorch 2.11.0, which still ships sm_75 (Turing) kernels:
git clone https://github.com/speridlabs/idol-sdk.git
cd idol-sdk
uv venv --python 3.11
source .venv/bin/activate
uv pip install torch==2.11.0 torchvision==0.26.0 --index-url https://download.pytorch.org/whl/cu128
uv pip install -e .
The SDK uses flash-attn if it's installed and PyTorch's scaled_dot_product_attention otherwise. I didn't install flash-attn; everything below runs on PyTorch SDPA.
A README that returns 200 doesn't mean you have access
My first check on FLUX.2-dev was its README, which came back 200. That looked like access, but the README isn't gated. The files inside vae/ are, and those returned 403 because I hadn't accepted the terms yet.
Check a file inside vae/, not the README:
HF_TOKEN=$(cat ~/.cache/huggingface/token)   # written by hf auth login
for f in README.md vae/config.json; do
  printf '%s ' "$f"
  curl -sL -o /dev/null -w '%{http_code}\n' -H "Authorization: Bearer $HF_TOKEN" \
    https://huggingface.co/black-forest-labs/FLUX.2-dev/resolve/main/$f
done
README.md 200
vae/config.json 403
If vae/config.json gives 200, you're done and can skip the next section.
No FLUX.2-dev access? Point the config at the FLUX.2-klein-4B VAE
The SDK reads the encoder repos from the image_encoders block of the weights' config.json and loads the VAE with AutoencoderKLFlux2.from_pretrained(repo, subfolder="vae"). The vae/ folder of FLUX.2-klein-4B downloaded without accepting the FLUX.2-dev terms, so I downloaded Idol's weights to a local folder and changed one key:
hf download speridlabs/idol --local-dir weights
-    "flux2_vae": "black-forest-labs/FLUX.2-dev"
+    "flux2_vae": "black-forest-labs/FLUX.2-klein-4B"
Then pass --weights weights on every run.
What I checked: the klein VAE uses the same AutoencoderKLFlux2 class, 32 latent channels, block channels [128, 256, 512, 512] and patch size [2, 2]. The dev file is 336,213,556 bytes and the klein file is 168,120,878 bytes, almost exactly half, which fits FP32 vs bf16. The SDK casts the VAE to bf16 on load either way.
Then I checked the weights. I later accepted the FLUX.2-dev terms, downloaded both files and compared them tensor by tensor. All 251 dev tensors, cast to bf16, are bit-identical to the klein ones, and the two configs differ only in the diffusers version string. So the klein swap gives exactly the output of the official setup.
Run it: one image in, a .ply out
python -m idol.sample --image figure.png --mode synthetic --weights weights --out outputs
python -m idol.sample --image photo.jpg  --mode real      --weights weights --out outputs
--mode synthetic (the default) is for renders and generated images, and crops so the object fills 1/1.2 of the frame. --mode real is for photographs and leaves more room (1/1.7). --image also takes a folder.
For each image you get three files: name.ply (the splat), name_input.png (what the model saw after background removal and cropping) and name_camera.json (the camera it predicted for the input).
On a 2080 Ti, that command crashes.
On Turing the default run crashes: cuDNN attention needs sm80+
By default Idol turns on what it calls faster sampling. One part of that switches attention to cuDNN for the whole sampling loop, on every GPU. cuDNN's attention kernels cover compute capability 8.0 (Ampere) and up; the 2080 Ti is 7.5. About 8 seconds in:
UserWarning: cuDNN MHA only supports gpu architectures in the range [sm80, sm121]. Attempting to run on a sm 7.5 gpu.
...
torch._dynamo.exc.TorchRuntimeError: RuntimeError when making fake tensor call
  ... got RuntimeError('No available kernel. Aborting execution.')
The official switch is --no_optimize, which turns off all of faster sampling. That works: 84.8 s per image. But it also throws away torch.compile, which works fine on Turing.
The one-line patch: only use cuDNN attention on sm80 and up
The backend switch is in idol/pipeline.py. I made it conditional on the GPU's compute capability and left the rest of the optimize path alone:
diff --git a/idol/pipeline.py b/idol/pipeline.py
index 677789c..5489a4b 100644
--- a/idol/pipeline.py
+++ b/idol/pipeline.py
@@ -134,7 +134,8 @@ class IdolPipeline:
             yield
             return
         backend, tf32 = layers.ATTN_BACKEND, torch.backends.cuda.matmul.allow_tf32
-        layers.ATTN_BACKEND = 'sdpa_cudnn'
+        if torch.cuda.get_device_capability(self.device) >= (8, 0):
+            layers.ATTN_BACKEND = 'sdpa_cudnn'
         torch.backends.cuda.matmul.allow_tf32 = True
         try:
             yield
Ampere and newer cards behave exactly as before. On Turing, attention stays on plain PyTorch SDPA, and torch.compile plus the batched guidance passes still run. Run without --no_optimize after applying it.
Result: 72.7 s per image, 14% less time than --no_optimize. The first image in each process is slower (84.8 s) because it compiles; that machine already had an Inductor cache, so a fresh setup takes longer.
Speed: 72.7 s on the 2080 Ti, 14.9 s on an RTX 5090
All rows are 50 steps and 262,144 Gaussians. The 2080 Ti rows and the 5090 optimize row are warm medians; the 5090 no-optimize row is the median of three images including the first. Each time covers the full request: background removal, both encoders, sampling and decoding. Read the 2080 Ti rows against each other; the 5090 rows are there for scale.
| GPU | Setting | Seconds per image |
|---|---|---|
| 2080 Ti 22GB | default optimize | crashes |
| 2080 Ti 22GB | --no_optimize | 84.8 |
| 2080 Ti 22GB | one-line patch | 72.7 |
| RTX 5090 (WSL2) | default optimize | 14.9 (official: 14.1) |
| RTX 5090 (WSL2) | --no_optimize | 16.9 |
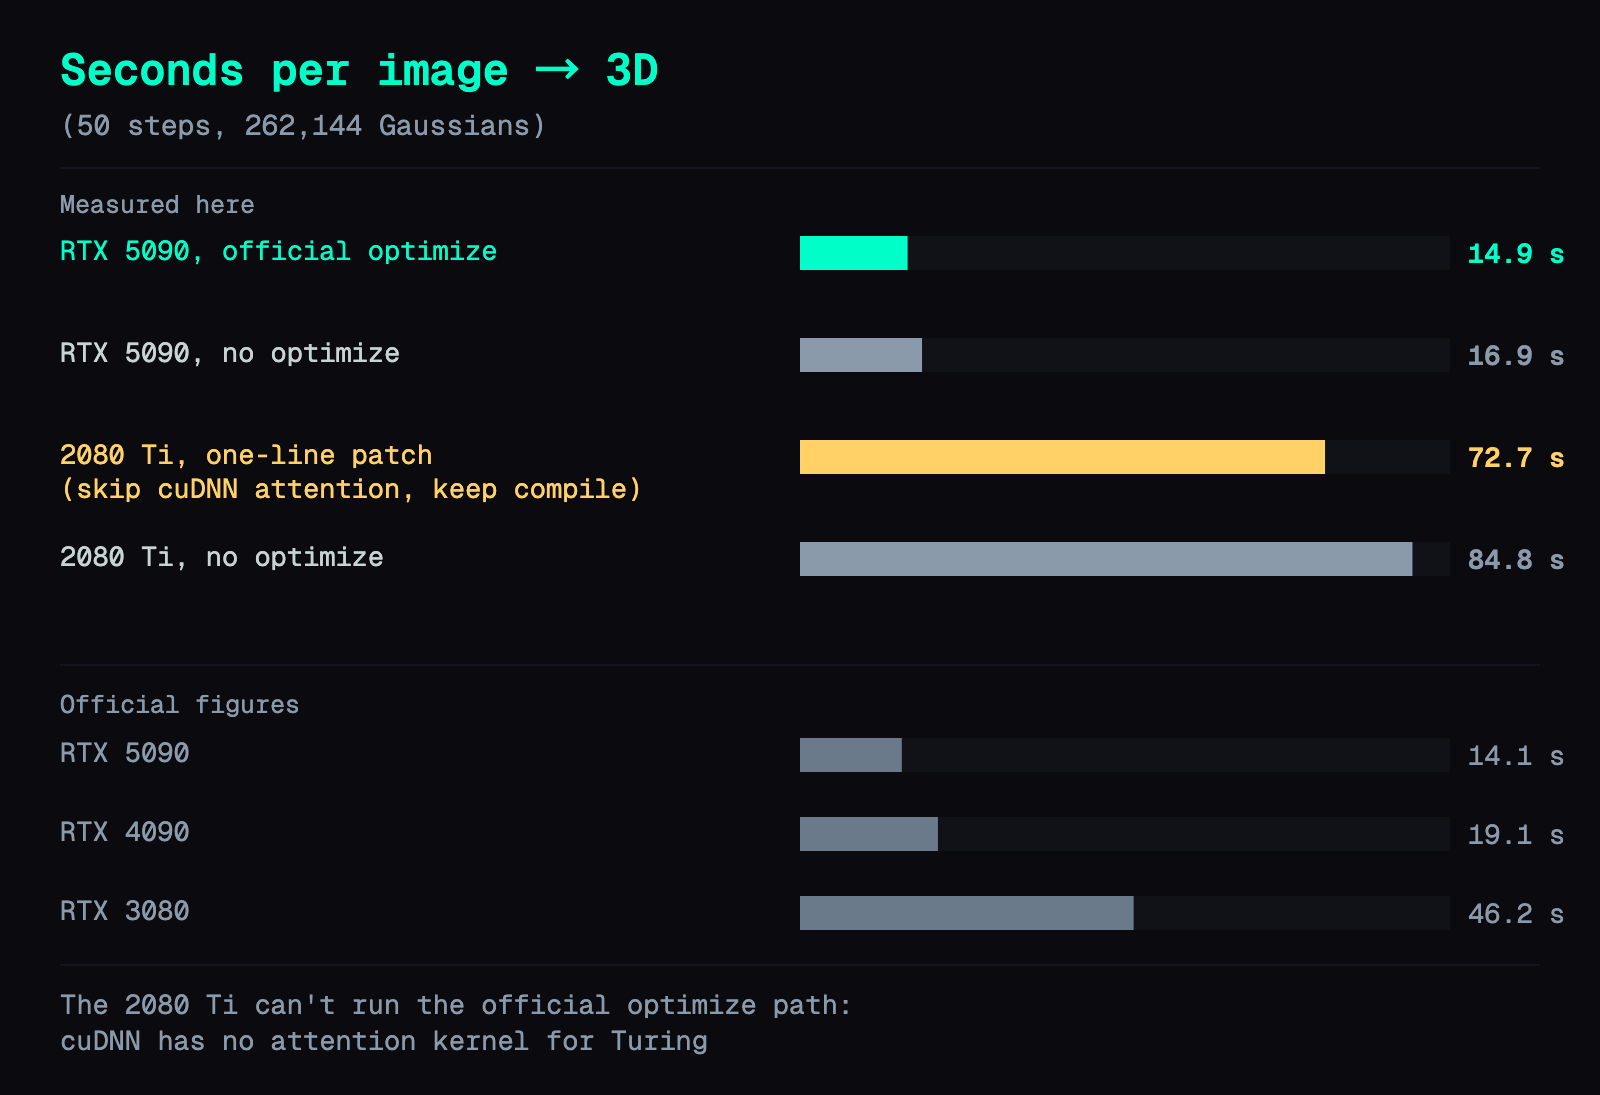
My 5090 result lands 5.5% above the official 14.1 s, with the klein VAE and 8 images that may not be the official 8. Close enough that the setup isn't hiding a big problem.
The 2080 Ti card shares its GPU with other services, so treat its numbers as "what a busy card does", not a clean lab figure. The deep dive has the details.
VRAM: 6894 MiB in PyTorch, about 11 GB total in nvidia-smi
Two numbers, and both matter:
- PyTorch peak allocation: 6894 MiB on the 2080 Ti, which matches the card's 7.2 GB peak.
- Total VRAM increase in nvidia-smi: 10,644 MiB. This likely also counts the model, the CUDA context and memory PyTorch reserved but didn't use. It's the number to check against the free memory on a card that runs other things.
--dinov3_dtype fp32 raised those to 8595.5 MiB and 12,236 MiB, roughly the 1.7 GB extra the card mentions, with no clear speed change (one image each). On the RTX 5090 the PyTorch peak was 5104 MiB.
Results: the front matches, the back is a guess
Each image below has the input on the left (after Idol's background removal, which leaves it on black) and four views of the output, turned 90° at a time.

The figure in traditional dress came out best. The back of the robe and the hair bun are complete and consistent, but the face and the embroidery are noticeably softer than in the input.
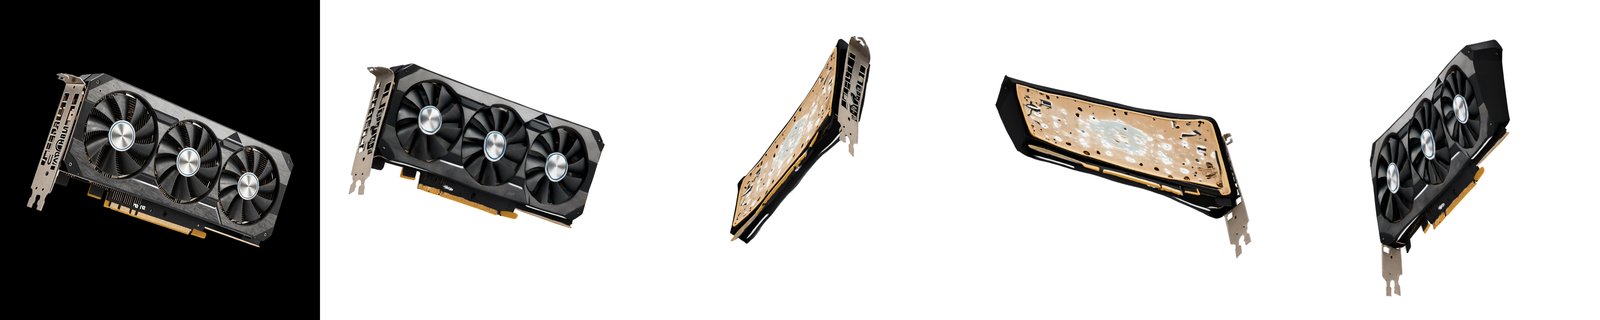
The 2080 Ti image shows the limit. The front is right: three fans, the bracket, the gold fingers. The back has no backplate at all. The model filled it with a gold, speckled slab and bent the edges a little.

The axolotl kept its gills and eyes and grew a long tail that the input never clearly shows.

The strawberry reads as a strawberry from every side. The back is paler, and the leaf positions there are the model's guess.
Across the four objects I didn't see holes or floating specks. Among the 49 official examples I processed, a few backs came out clearly wrong: a football figure grew a long black sheet, a marble logo got a large black sheet hanging behind its base, and a bread loaf came out flatter than the photo.
Which flags to change
--steps 25: halves the time (44.0 s without optimize, 38.2 s with the patch, 7.64 s on the 5090). The back of the robe is still complete; sleeves and hem shift a little, and the white patches on the card's back get more visible.--num_gaussians 1048576: four times the Gaussians, a few seconds more (87.6 s without optimize; 15.5 s on the 5090). At the image sizes in this post I couldn't see more detail. It might pay off if you zoom in.--dinov3_dtype fp32: about 1.8 GB more PyTorch peak, no clear speed difference (one image each), no visible quality gain.--seed: in my runs, the same seed on the same machine gave a bit-identical.ply. Change it to get a different guess for the back.--mode realfor photographs,syntheticfor renders and generated images.
On a 2080 Ti, the patch plus --steps 25 is about 38 s per object, which makes trying several seeds practical.
Deep dive: the attention kernel, compile vs batching, VRAM, test conditions
You can skip this section. It has the profiling, per-part timings and test conditions behind the numbers above.
Optimize bundles three changes; on Turing the gain is from compile
The model card describes faster sampling as about 1.7x with the same output quality, and lists three changes behind it:
- The denoiser is compiled with
torch.compile. In the SDK this iscompile_for_sampling, which also switches the RePo position encoding to its real-valued form (real_valued=True). - The guided and unguided passes of classifier-free guidance run as one batch of 2 instead of two batches of 1.
- Attention uses cuDNN and matmuls use TF32 while sampling.
On Turing, part 3 crashes and TF32 has no hardware behind it. The patch removes only the cuDNN switch, so parts 1 and 2 still run.
Profiler: attention runs on a CUTLASS sm75 FP16 kernel
The PyTorch SDPA flags only say which backends are allowed. To see which one actually runs, I profiled sampling only (no encoders, no decoder) after a 2-step warm-up, once with the compiled denoiser and once eager, both with batched guidance. Both picked the same kernel, 56 calls each:
aten::_scaled_dot_product_efficient_attention   56
aten::_efficient_attention_forward              56
fmha_cutlassF_f16_aligned_64x64_rf_sm75(PyTorchMemEffAttention::AttentionKernel<cutlass::half_t, cutlass::arch::Sm75, true, 64, 64, 64, true, true>::Params)   56
That's PyTorch's mem-efficient attention, a CUTLASS kernel built for sm75 in FP16. Not the math fallback, not Flash, not cuDNN. Flags at the time: flash, mem-efficient, math and cuDNN all enabled; capability (7, 5); backend sdpa; torch 2.11.0+cu128.
Compile vs batching: compile accounts for nearly all of the 14%
To see where the gain comes from, I ran two extra configurations with the patch applied. Compile-only forced the batched guidance off. Batch-only replaced compile_for_sampling with a no-op and kept batching on. Everything else was the same: seed 42, 50 steps, 262,144 Gaussians.
| Configuration | First image | Warm median | Warm N | Warm range | Median on 3 shared inputs |
|---|---|---|---|---|---|
--no_optimize (earlier run) | n/a | 84.807 s | 44 | 84.471–85.135 s | n/a |
| Patch (compile + batch) | 84.757 s | 72.664 s | 10 | 72.152–72.700 s | 72.490 s |
| Compile only | 86.021 s | 72.494 s | 3 | 72.494–72.524 s | 72.494 s |
| Batch only | 84.124 s | 84.483 s | 3 | 84.133–84.563 s | 84.483 s |
The last column uses the three inputs all three configurations shared (fig-alien, fig-axolotl, and the 2080 Ti image). On those, the full patch and compile-only differ by 0.01%. Batch-only is 0.38% faster than --no_optimize, which is within noise.
Against the 84.807 s baseline: patch 0.8568 (1.1671x, −14.32%), compile-only 0.8548 (−14.52%), batch-only 0.9962 (−0.38%). At 25 steps the patch gave 38.154 s against 44.048 s (−13.38%).
Two caveats. Compile-only includes the real-valued RePo switch, so it's the contribution of compile_for_sampling as a whole, not of the compiler alone. And the --no_optimize baseline is from an earlier run, not interleaved with these, on a shared card; small differences shouldn't be over-read. The gains of the three configurations shouldn't be added together.
On an RTX 5090, optimize cut request time by 12%
The 5090 ran under WSL2 with the official optimize path, unpatched (it doesn't need the patch).
| Setting | N | Median | Range |
|---|---|---|---|
| Optimize, first image (includes compile) | 1 | 25.755 s | n/a |
| Optimize, warm | 8 | 14.880 s | 14.721–14.932 s |
--no_optimize | 3 | 16.858 s | 16.843–17.927 s |
| Optimize, 1,048,576 Gaussians | 3 | 15.469 s | 15.469–18.427 s |
| Optimize, 25 steps | 3 | 7.643 s | 7.639–10.789 s |
16.858 / 14.880 is about 1.13x throughput, or 11.7% less time. The card's ~1.7x is for faster sampling, not the full request, so the two aren't directly comparable. The card doesn't say which GPU the ~1.7x figure comes from, and I didn't break the 5090 gain down by part the way I did on the 2080 Ti.
The 8 warm images came from the demo's figure, food and furniture examples. The official 14.1 s is also a median over 8 images, but I don't know if they're the same 8. Without optimize, on the same three images, the 5090 took 16.858 s and the 2080 Ti 84.052 s, about 4.99x.
bf16 on Turing is emulated
DINOv3 and the VAE run in bf16 by default. Turing has no bf16 hardware: torch.cuda.is_bf16_supported(including_emulation=False) returned False, and True with emulation. It still runs and produces normal output; it just isn't getting bf16 hardware acceleration. Missing bf16 hardware is also what made one of my machines 3.4x slower in part 10.
--dinov3_dtype fp32 ran 83.674 s against 83.913 s for bf16, one run each, so I can't call either faster. The mean per-index position difference between the bf16 and fp32 outputs was 0.0337 (max 0.638) in the SDK's normalized object coordinates. That's compared index by index without alignment, so it isn't a geometric error, and the four views looked about the same.
Reproducibility: bit-identical on one machine, different across GPUs
Same image (ancient-beauty), seed 42, 50 steps, bf16, --no_optimize, separate processes: the two .ply files had the same SHA256 on the 2080 Ti, and the same on the 5090. I didn't enable any extra deterministic-algorithm flags.
Across GPUs the files differ. The patched 2080 Ti path also differs from the unpatched one: mean per-index position difference 0.0154 (ancient-beauty) and 0.0298 (2080 Ti image). Side by side in four views at 512 px per view, I couldn't see a difference or new holes.
Two VRAM numbers, two definitions
- PyTorch peak is
torch.cuda.max_memory_allocated()afterreset_peak_memory_stats()before each image: 6894.3 MiB on the 2080 Ti in every configuration, 8595.5 MiB with fp32 DINOv3, 5103.8 MiB on the 5090. The official 7.2 GB is about 6894 MiB (6.73 GiB, 7.23 GB). I didn't look into why the 5090 peak is lower; it was the same with and without optimize there. - nvidia-smi increase is peak memory use on the card during an image, minus the card's baseline before the model loaded. It includes the model, CUDA context, allocator reserve and workspace. 2080 Ti: 10,644 MiB peak (12,236 MiB with fp32 DINOv3), sampled every 0.5 s. 5090: 7,837 MiB, sampled every 0.1 s, with the Windows desktop also on the card.
You can't subtract one from the other to get the model's size. Polling nvidia-smi can also miss short spikes.
Caveats from testing on a shared GPU
The 2080 Ti also runs a text-to-speech service and a ComfyUI instance. Before the first test 6,604 MiB of its 22,528 MiB was already in use, and I left those services running. That means:
- Timings may include contention from other work on the card. The spread is tight (84.471–85.135 s over 44 images).
- Each process recorded its own nvidia-smi baseline before loading, because ComfyUI's cached VRAM grew between runs.
- I processed 49 of the 94 official examples plus two of my own images within the time window. Serial runs at about 84 s each don't fit all 94.
- The patch runs and the
--no_optimizebaseline are separate runs, not an interleaved A/B.
Test conditions
- 2080 Ti: modded RTX 2080 Ti 22GB (22,528 MiB), sm_75, driver 580.173.02, Python 3.11.15, torch 2.11.0+cu128, system nvcc 12.4.131, cuDNN 91900.
- RTX 5090: 32,607 MiB, WSL2 on Ubuntu 26.04.1, Windows driver 610.88, Python 3.12.16, torch 2.11.0+cu128.
- Both: diffusers 0.42.1, transformers 5.22.1, idol-sdk commit
4702a7f00850e34b6e83a2170cc123c3e9570744, Idol weights revision2731c2291fc65a797c5cb627a5e5526fc1490902, FLUX.2-klein-4B revisione7b7dc27f91deacad38e78976d1f2b499d76a294, DINOv3 revisionc807c9eeea853df70aec4069e6f56b28ddc82acc. - Settings: seed 42,
cfg_strength3.0,rescale_t3.0, DINOv3 bf16 unless noted, 50 steps and 262,144 Gaussians unless noted. Noflash-attn. - Timing:
torch.cuda.synchronize()andperf_counteraround the pipeline call, which covers background removal, cropping, both encoders, sampling and decoding. Model load, writing the.plyand rendering are excluded. Each configuration ran in its own process; the first image of each process is reported separately, and warm medians exclude it. - Sample counts: 2080 Ti
--no_optimizewarm N=44, patch warm N=10, compile-only and batch-only N=3, 25 steps N=2 warm without optimize and N=3 with the patch, 1M Gaussians N=2 warm. 5090 optimize warm N=8; the other 5090 rows are N=3 including each process's first image.
How the turntables were rendered
Idol writes a standard 3DGS .ply and doesn't render turntables. For the stills and the video I used gsplat 1.5.3:
- On the 2080 Ti, gsplat compiled its CUDA extension for sm_75 with
TORCH_CUDA_ARCH_LIST=7.5andMAX_JOBS=4, which took 154.77 s. It needsninjaon thePATH; without it you getRuntimeError: Ninja is required to load C++ extensions. packed=Truewith a white background failed withAssertionError: torch.Size([1, 3])inrasterize_to_pixels.packed=Falseworks, on both cards.- The renderer reads position, quaternion,
exp(log scale),sigmoid(opacity)and the base SH color from the.ply, and uses the yaw, pitch, radius and field of view from Idol's predicted camera JSON. The SDK is z-up, so the camera gets a +90° rotation around X. - Stills: input yaw plus 0°, 90°, 180° and 270°, 1024×1024, white background. Video: one full turn, 144 frames at 24 fps, 720×720, H.264, 6 seconds.
Also in this series: #27 turing-unlock on an RTX 2080 Ti: full-rate FP16 tensor cores · #26 LFM2.5 24B-A2B on one RTX 2080 Ti · #10 Two identical 2080 Tis, one 3.4x slower
FAQ
- What is Idol and what does it output?
- Idol is an Apache-2.0 model from speridlabs that turns one image of an object into a 3D Gaussian splat, including the sides the picture never showed. It removes the background, frames the object, and writes a standard 3DGS .ply with 32,768 to 1,048,576 Gaussians (default 262,144) that standard 3DGS viewers can open. The whole pipeline is about 1.80B parameters across a DiT, two decoders, BiRefNet for background removal, and two image encoders (DINOv3 ViT-H+/16 and the FLUX.2 VAE).
- Does Idol run on an RTX 2080 Ti or other Turing GPUs?
- Yes, but not with default settings. The official speed table stops at the RTX 3080 and L4. On my modded RTX 2080 Ti 22GB the default run crashes, because the optimize path forces cuDNN attention and cuDNN only has those kernels for sm80 to sm121, while the 2080 Ti is sm75. Running with --no_optimize works at 84.8 s per image (50 steps, 262,144 Gaussians). A one-line patch that keeps torch.compile but skips cuDNN attention below compute capability 8.0 brings it to 72.7 s.
- Why does Idol fail with No available kernel on a 2080 Ti?
- During sampling, the optimize context in idol/pipeline.py sets the attention backend to sdpa_cudnn on every GPU. On Turing, PyTorch first warns that cuDNN MHA only supports sm80 to sm121, and then torch.compile fails with RuntimeError No available kernel. Aborting execution. The fix is to only switch to sdpa_cudnn when torch.cuda.get_device_capability is at least (8, 0); on Turing the SDK then stays on plain PyTorch SDPA, which picks a mem-efficient CUTLASS kernel built for sm75.
- How fast is Idol on an RTX 2080 Ti compared with an RTX 5090?
- At 50 steps and 262,144 Gaussians: 84.8 s per image on the 2080 Ti with --no_optimize, 72.7 s with the one-line patch. An RTX 5090 under WSL2 took 14.9 s with the official optimize path (the official table says 14.1 s) and 16.9 s without it. On the same three images without optimize, the 5090 was about 5x faster than the 2080 Ti.
- How much VRAM does Idol need?
- PyTorch's peak allocation was 6894 MiB on the 2080 Ti, in line with the official 7.2 GB peak. The total increase nvidia-smi reports for the card, which also counts the model, CUDA context and allocator reserve, peaked at 10,644 MiB (about 11.2 GB), so plan for that on a shared card. On an RTX 5090 the PyTorch peak was 5104 MiB. Running DINOv3 in fp32 adds about 1.8 GB of PyTorch peak.
- Can I run Idol without access to FLUX.2-dev?
- I did, by pointing image_encoders.flux2_vae in the local weights config.json at black-forest-labs/FLUX.2-klein-4B, whose vae folder downloads without accepting the FLUX.2-dev terms. It loads with the same AutoencoderKLFlux2 class, and its config matches the structure the SDK expects. The dev file is FP32 at 336,213,556 bytes and the klein file is bf16 at 168,120,878 bytes. I later accepted the FLUX.2-dev terms and compared the two tensor by tensor: cast to bf16, all 251 dev tensors are bit-identical to klein's, so the swap gives the same result as the official setup.
- Does Idol's optimize flag really give about 1.7x?
- Not for the whole request on the two cards I tested; I didn't time sampling on its own. On an RTX 5090 it went from 16.9 s to 14.9 s, about 12% less time per request; the 1.7x on the model card refers to sampling, not the whole request. On the 2080 Ti the official path does not run at all; with the patch, the 14% came mostly from compile_for_sampling, and batching the guided and unguided passes gave nothing measurable.
- How accurate are the sides Idol cannot see?
- They are plausible guesses. The back of a figure's robe and hair bun came out complete but the face and embroidery were softer than the input. The back of a graphics card became a gold, speckled slab instead of a backplate. An axolotl toy grew a long tail that the input never clearly showed. I did not see holes or floating specks in the four objects I rendered.
- Is Idol output reproducible with the same seed?
- On the same machine and settings, yes: two separate processes with seed 42 wrote bit-identical .ply files on both the 2080 Ti and the 5090. Across GPUs the files differ, and the patched 2080 Ti path also produced different files from the unpatched one, with no visible difference at the size I compared.
Read next
- 2026-10-28[Benchmark] turing-unlock on an RTX 2080 Ti: Full-Rate FP16 Tensor Cores, 50.6 → 69.9 TFLOPS
A kernel module lifts the half-rate FP16 tensor-core cap on GeForce Turing. Three modded 2080 Ti 22G cards: 69.9 TFLOPS GEMM, what speeds up, the dracut fix.
- 2026-08-20[Just for Fun — Advanced] Why Isn't Your 4-Bit Quant Faster on a 2080 Ti? I Tore Open the CUDA Backend to Find Out
Quantized weights are half the file size on a 2080 Ti but the speed doesn't move. Dumping the CUDA backend's .so with nm -D shows why, and which quant format is actually accelerated.
- 2026-08-06[Just for Fun — Advanced] Wait, a 2080 Ti Can Run MiniMax-H3? 1080p With Audio on a 2018 Card
The four files are 38 GiB on disk; the card has 22. A modded 2080 Ti 22G still renders 15s of 1080p with audio in 23 minutes. Full config, measured speed and quality, then how it got there.
- 2026-07-18[Just for Fun — Advanced] Two Identical 2080 Tis, One 3.4× Slower — the Culprit Was a Single dtype Log Line
The same modded 2080 Ti 22G ran Z-Image 3.4× slower on one machine than another. Not the hardware, not the OS, not a missing package — a Turing bf16→fp32 fallback hiding in one log line. One flag fixed it.
Don't miss the next one
Subscribe, and you won't.
One-click unsubscribe anytime.