改裝 2080 Ti 22G · part 11
[Just for Fun — Advanced] Wait, a 2080 Ti Can Run MiniMax-H3? 1080p With Audio on a 2018 Card
❯ cat --toc
- Intro
- The config that runs it
- Why `--reserve-vram` and not something else
- Why the DiT must be INT8 while the text encoder can be W4A4
- Why SageAttention stays on and the log noise stays ignored
- What it looks like running: 23 minutes, same specs as the 5090
- The same clip on three machines: 314 / 741 / 1,383 seconds
- Deep dive: how that config got there
- The longest detour: seeing the fallback and trying to fix it
- I misjudged RTX VSR too
- Why W4A4 does not work
TL;DR
A modded RTX 2080 Ti 22G from 2018 renders 15 seconds of 1080p video with audio in 23 min 03 s, using MiniMax-H3 — a 33B model whose four files come to 38 GiB on disk. The same clip on a 5090 takes 314s, so this card is 4.4× slower. Slow, not incapable. Three things make it fit: an INT8 diffusion transformer (W4A4 is 18× worse and tears the frame), a W4A4 text encoder (fine there, worth 8.6%), and --reserve-vram 4, which is the sampler's activation budget rather than OS headroom. SageAttention adds 16.8% while logging two fallbacks per run. Caveat: reserve-vram is the one value you keep retuning per clip length.
🔊 Sound on. 15 seconds of 1080p with synchronized audio, generated end to end on a 2018 RTX 2080 Ti modded to 22GB. Render time: 23 min 03 s.
Intro
When you rent a moving truck, everyone compares horsepower, and the number that actually decides how much you move in one trip is cargo volume. Old GPUs get ruled out of new workloads the same way. The problem usually isn't speed — slow is a scheduling problem and you can wait it out. It's that the weights don't fit, and there is no "just leave it running longer" for a tensor with nowhere to live.
MiniMax-H3 is a 33B model that generates video and its audio track in a single forward pass. Its four files come to 38 GiB on disk, half again as much as this card holds. Read the right-hand column — that is why they fit anyway:
| file | on disk | when it is on the card |
|---|---|---|
| text encoder Qwen3-VL-32B (W4A4) | 13.20 GiB | runs once at the start, then unloads |
| diffusion transformer (INT8) | 19.53 GiB | resident for the whole sampling run |
| video VAE (fp16) | 4.85 GiB | loaded only for the final decode |
| audio VAE (fp32) | 0.56 GiB | same |
| total | 38.14 GiB | never resident at the same time |
So the 38 GiB is not a bill you pay all at once. It is four tenants taking turns in one room.
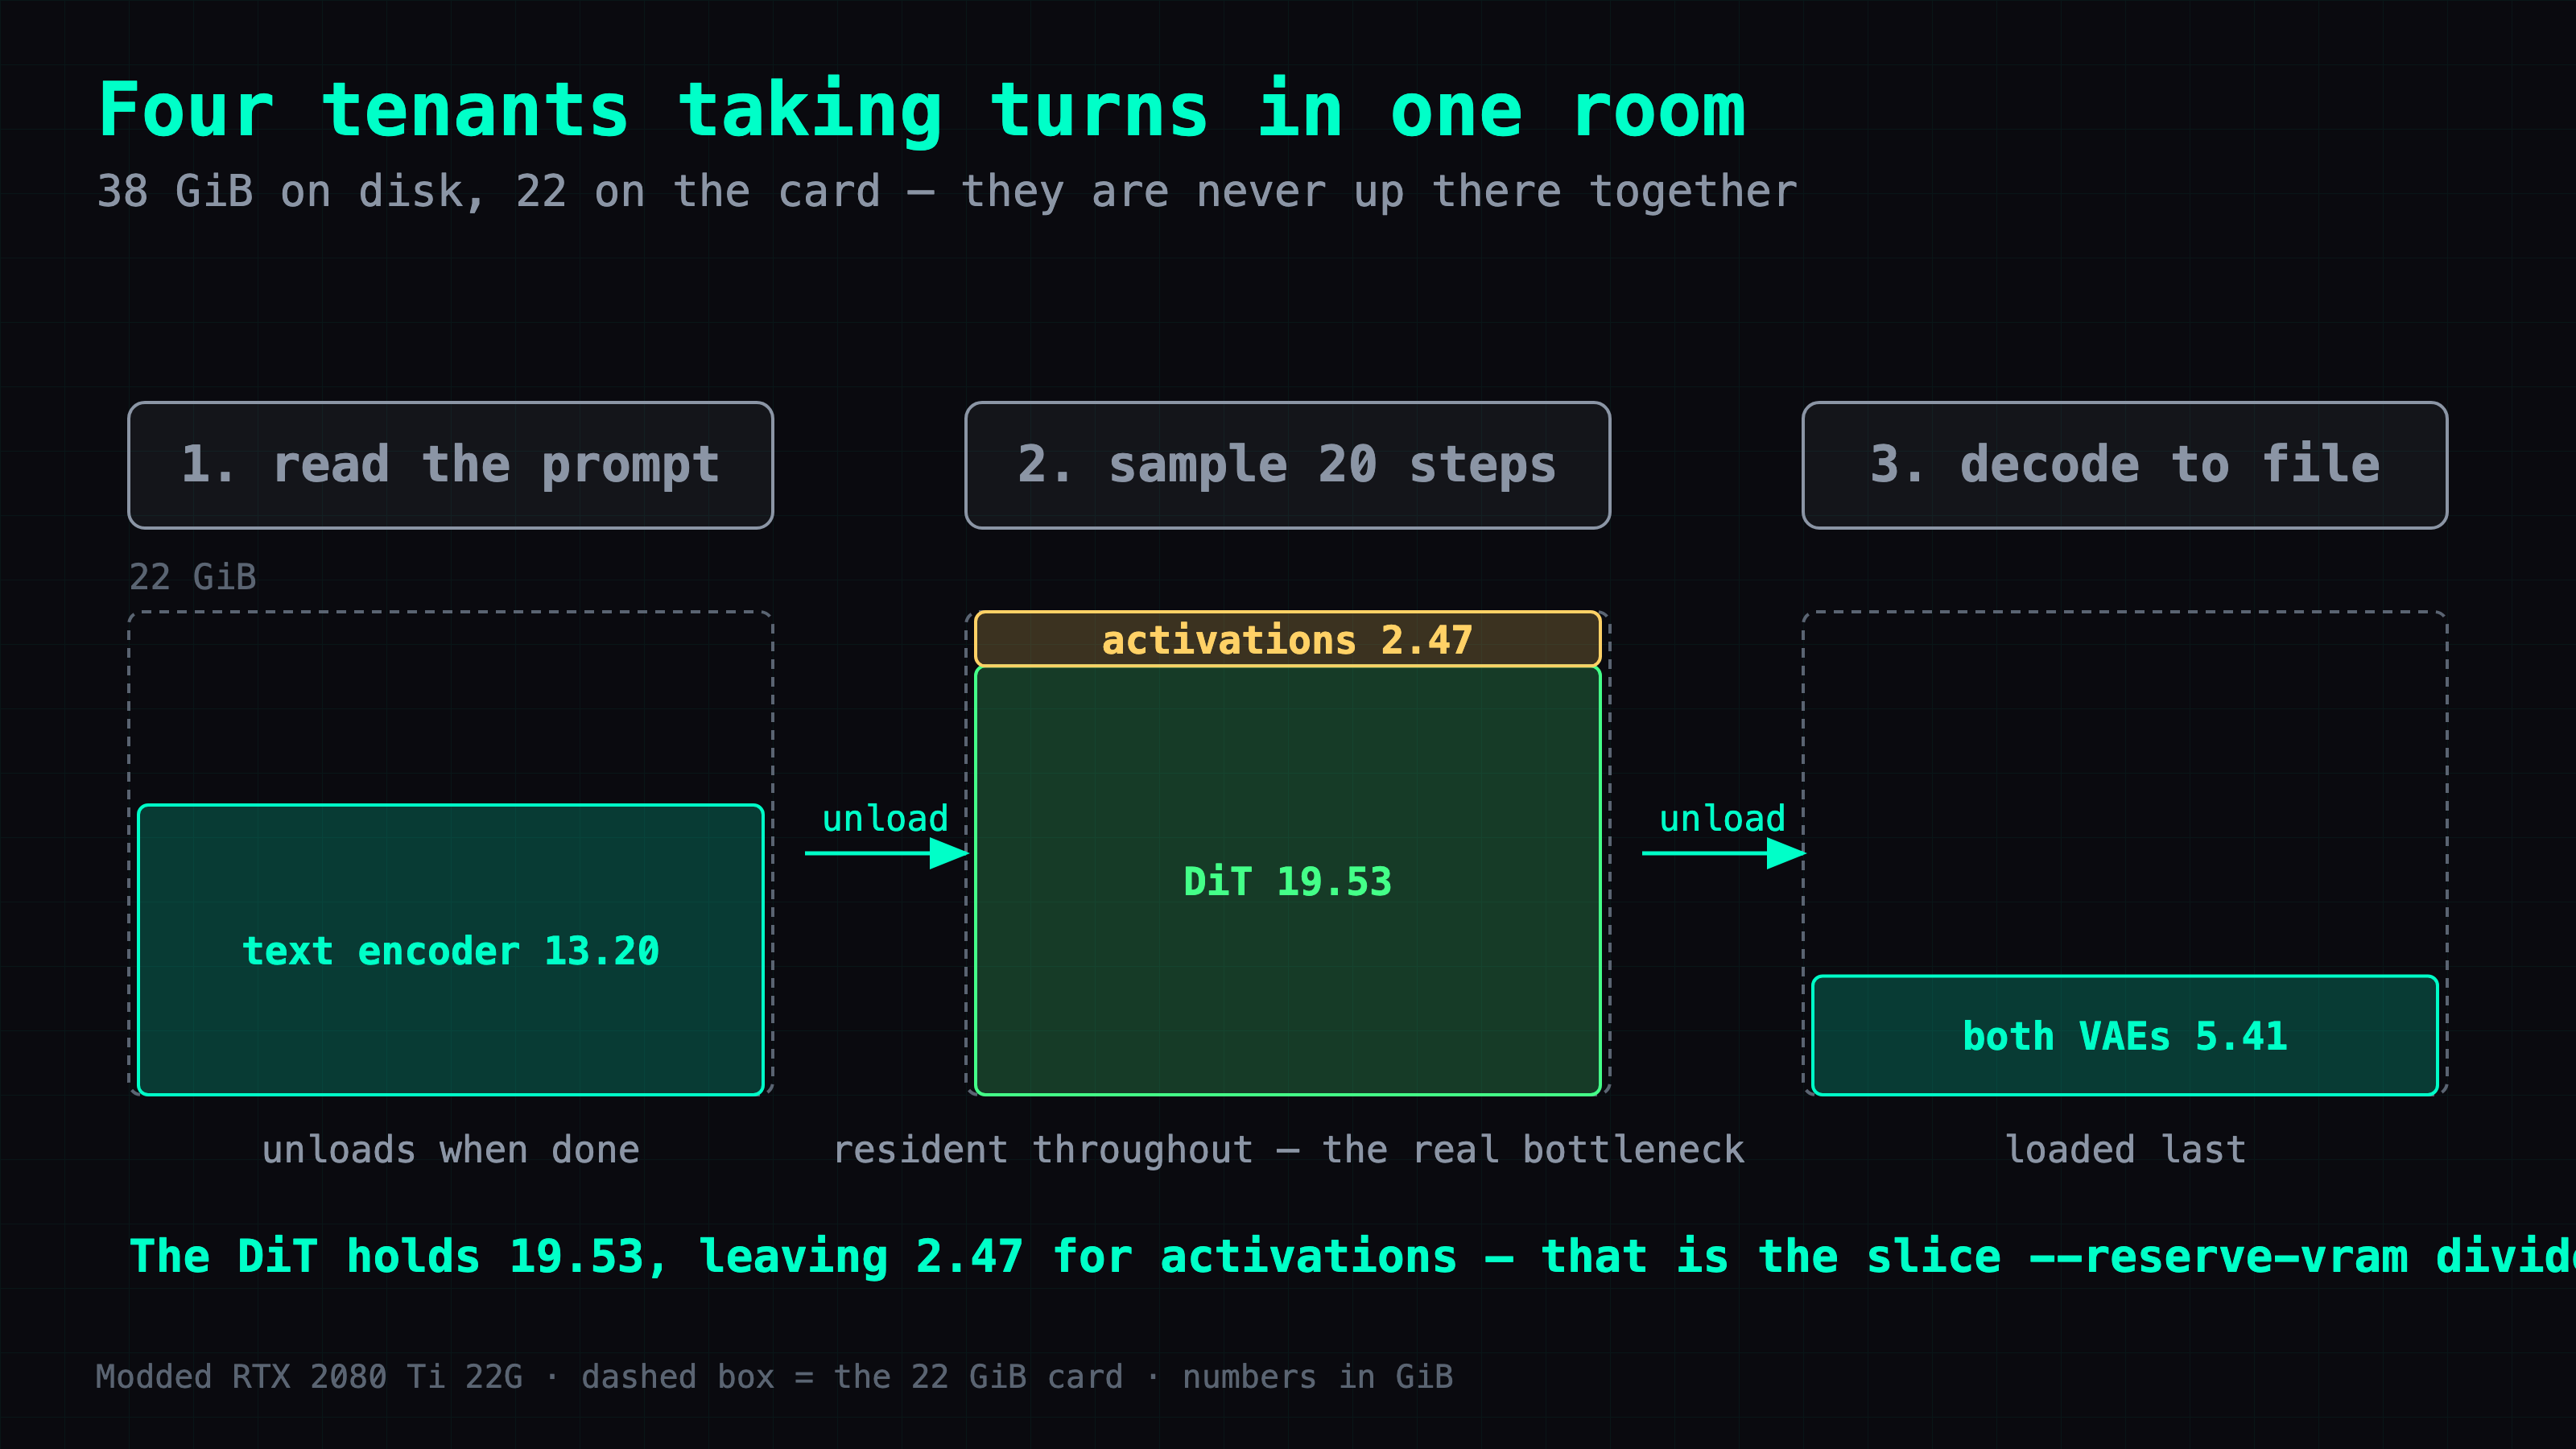
What decides whether this card works is the middle row: the DiT sits there at 19.53 GiB and the card holds 22. The remaining 2.47 GiB has to absorb every intermediate tensor sampling produces, and that margin explains everything else in this article.
I already had this model running on a 5090 — that write-up covers getting MiniMax-H3 running on a single RTX 5090 and is the prerequisite for this one. Here it runs on a modded RTX 2080 Ti 22G: Turing, sm_75, 22,528 MiB, a card that shipped in 2018 and had its memory chips swapped by someone in Shenzhen.
Config first, then the measured speed and quality, then how it got there.
The config that runs it
These three versions are welded together — upgrade any one and SageAttention stops building:
torch 2.6.0+cu124 · triton 3.2.0 · sageattention 1.0.6

python main.py --listen 127.0.0.1 --port 8188 \
  --reserve-vram 2 --use-sage-attention     # a 15-second clip needs 4
diffusion      minimax_h3_fl2va_pruned_int8_convrot.safetensors    ← INT8, not W4A4
text encoder   qwen3vl_32b_heretic_convrot_w4a4.safetensors        ← W4A4 is fine here
VAEs           minimax_h3_video_vae_fp16 + minimax_h3_audio_vae_fp32
sampler        res_multistep + simple · 20 steps · fps 24
resolution     generate at 960×540 → upscale to 1920×1080
rescale        SCALE = 1.0 (no rescaling needed once INT8 replaced W4A4)
Three of those choices are load-bearing, and each one is a place I lost time.
Why --reserve-vram and not something else
The flag reads like "memory held back for the operating system," and it is that — but on this card it is simultaneously the budget the sampler gets for activations. Both meanings share one number and they pull in opposite directions.
Three values on the same 15-second clip. Only one of the three is a real failure:
--reserve-vram | outcome | cost |
|---|---|---|
| 2 | torch.OutOfMemoryError after 43.5 s, peak 21,948 / 22,528 MiB | fails |
| 4 | fits | 1,383.0 s |
| 8 | 9.5 GB of weights evicted to streaming | over 5 min per step |
Reserve too little and the activations have nowhere to go. Reserve too much and the weights stop fitting, so they stream in from host memory every step. Short clips run happily at 2; a 15-second clip needs 4. This is the one number you will keep adjusting, and it scales with clip length rather than resolution.
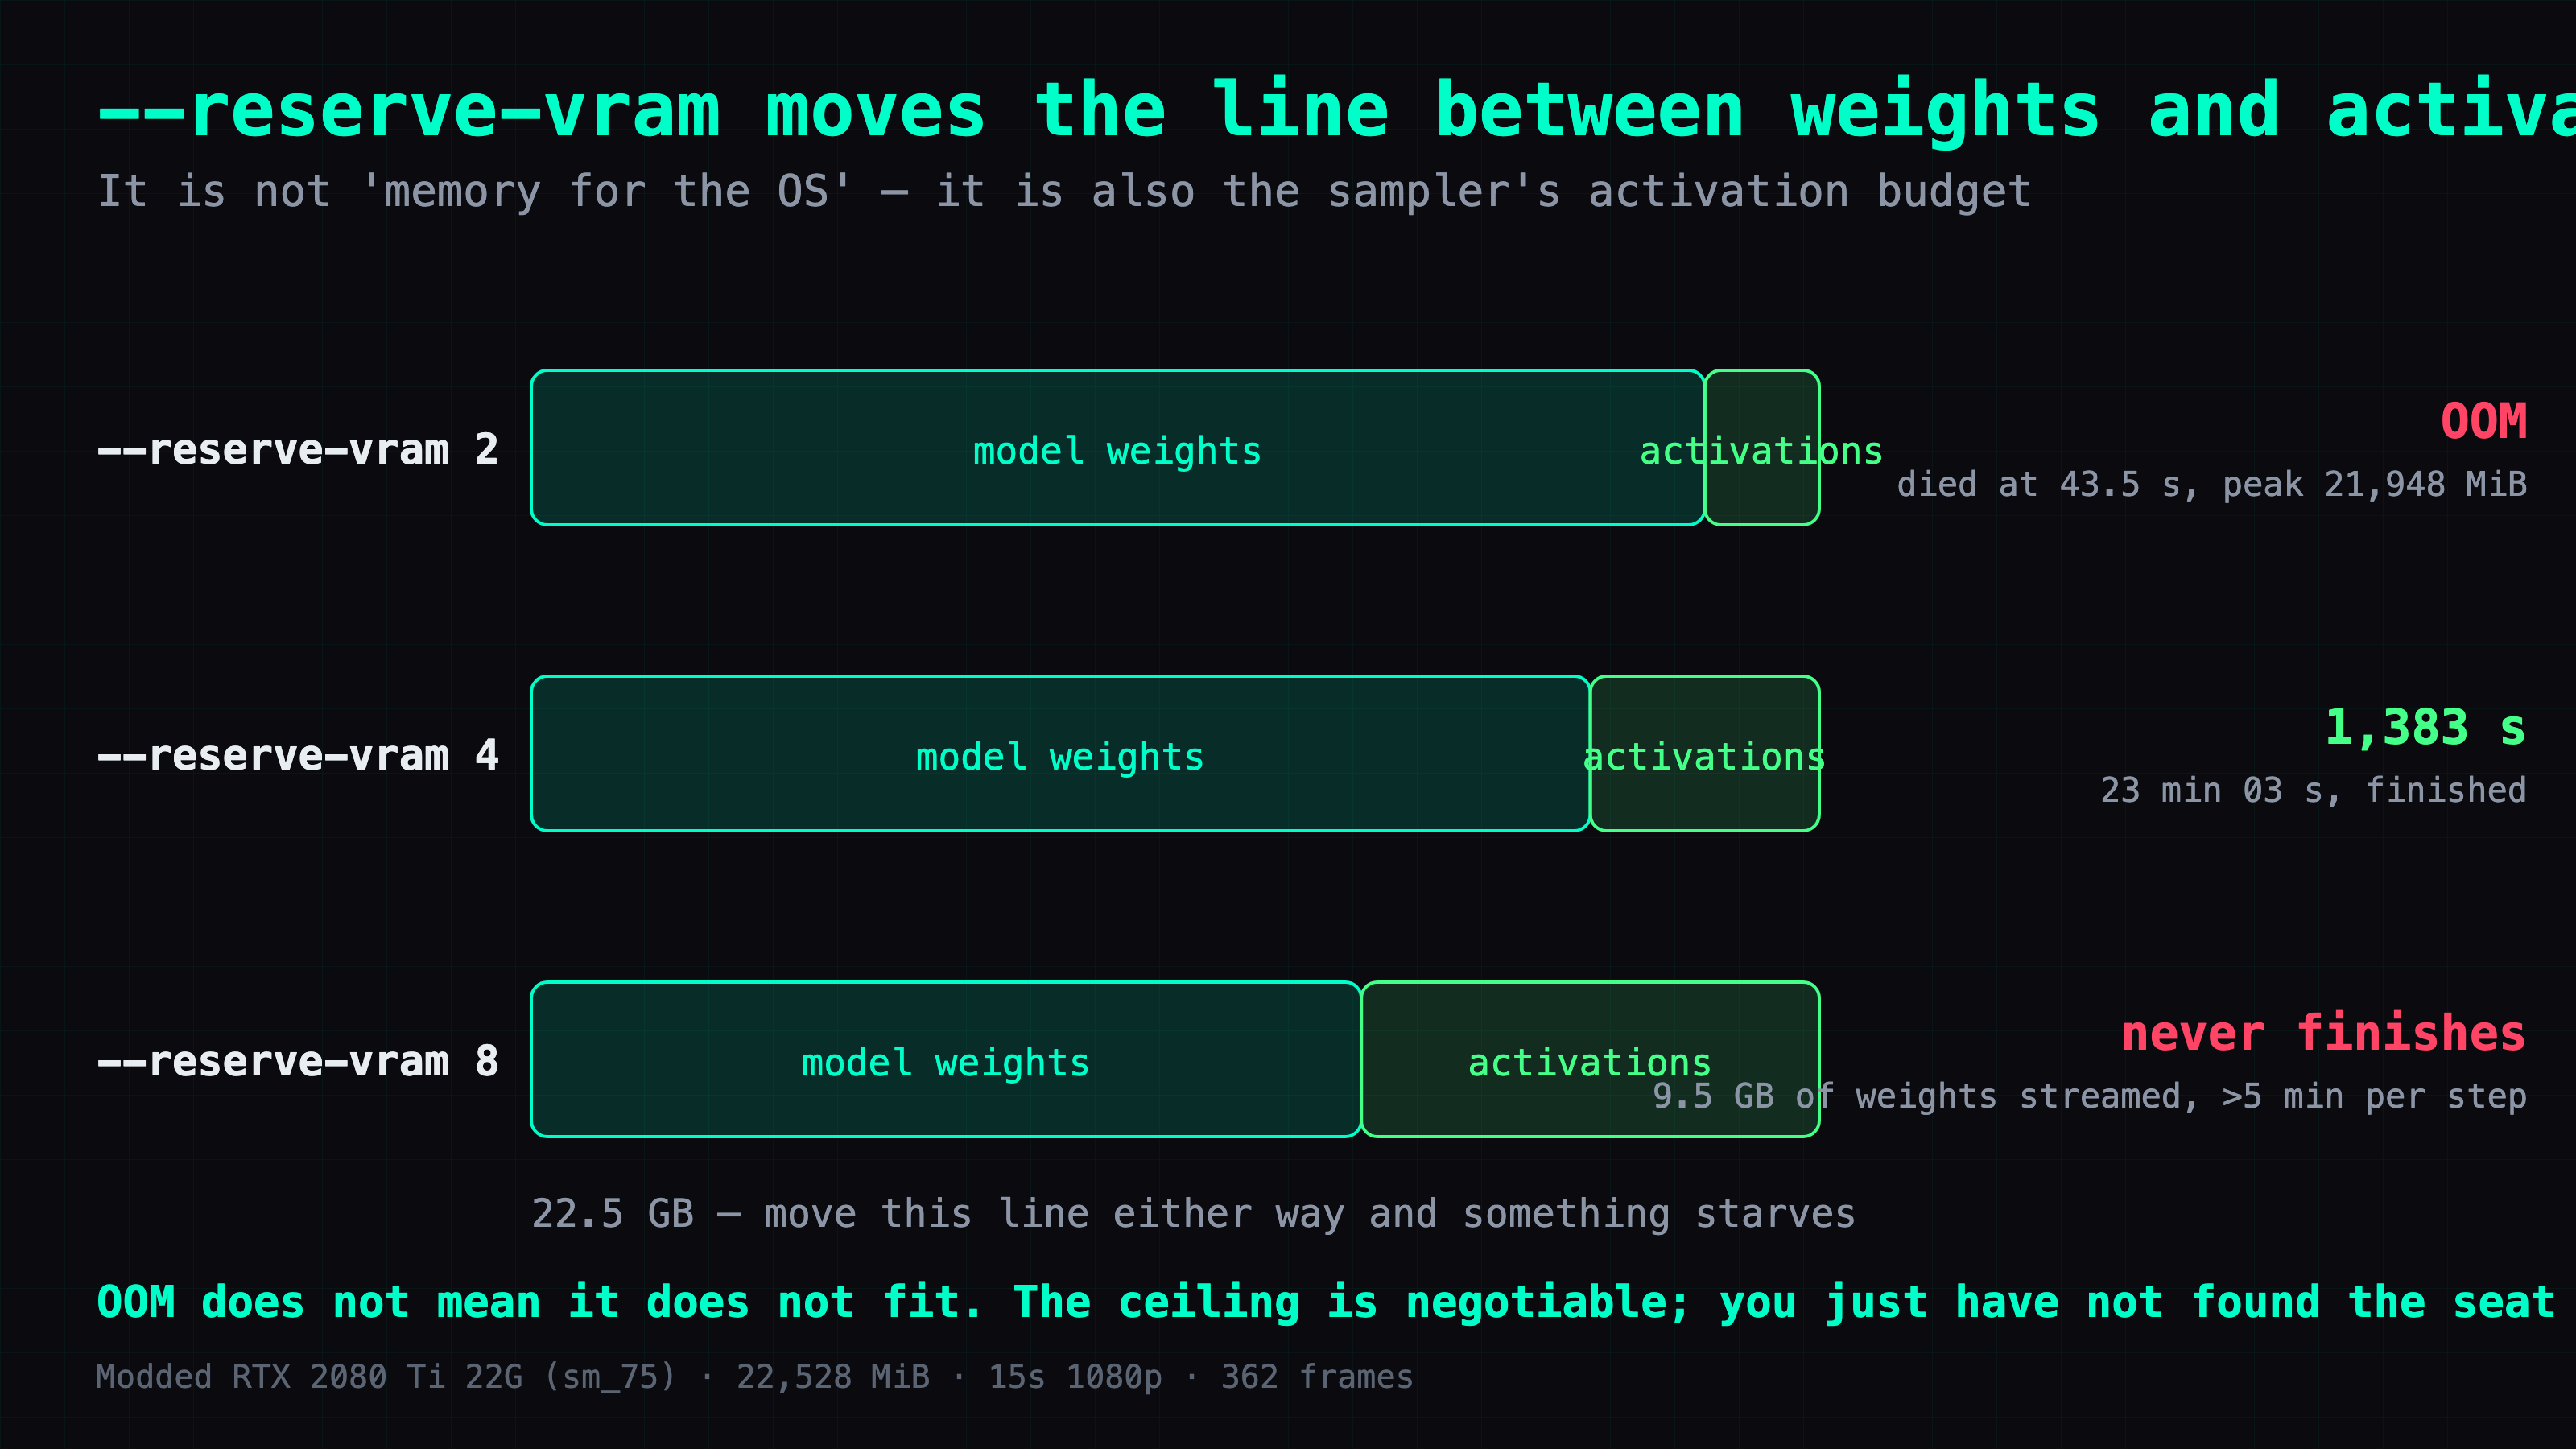
The transferable part: an OOM does not mean it doesn't fit. It means it doesn't fit under the current allocation policy.
Why the DiT must be INT8 while the text encoder can be W4A4
Same quantization format, two models in the same pipeline, opposite verdicts:
| model | at W4A4 | verdict |
|---|---|---|
| diffusion transformer | relative error 0.2005 vs INT8's 0.0110 | full-frame colour tearing — unusable |
| text encoder Qwen3-VL-32B | 24 GiB → 13.2 GiB, worth 8.6% wall clock | free money |
The DiT is where error compounds, once per step across 20 steps. The text encoder produces conditioning that is consumed once and never iterated on, so the same error has nowhere near the leverage. "W4A4 is bad" is not a portable conclusion — where the tensor sits in the graph decides it.
Why SageAttention stays on and the log noise stays ignored
With the flag on, every attention call logs this:
[ERROR] Error running sage attention: out of resource: shared memory,
Required: 67584, Hardware limit: 65536 ... using pytorch attention instead
while the startup banner says Using sage attention. It looks broken. The seconds say otherwise:
| build | seconds | |
|---|---|---|
| SageAttention on (2 fallbacks per run) | 133.37 | fastest |
| SDPA (flag off) | 160.25 | 16.8% slower |
💡 A fallback line is not a failure. sm_75 exceeds the 64KB shared-memory limit only on some attention shapes; every other call still takes the fast path. Verify with seconds, never with the presence of a log line.
What it looks like running: 23 minutes, same specs as the 5090
Here is what ffprobe says about the file in the player above, and the render cost that produced it:
output   1920x1080 · 24 fps · 362 frames · AAC 32 kHz stereo · 15.083 s
render   1,383.046 s  (23 min 03 s) · 20 steps · 88.87 s/step
Read the middle column for this card; the right one shows what the same job costs on current silicon:
| clip | modded 2080 Ti 22G | RTX 5090 |
|---|---|---|
| 15 s · 1080p · audio | 1,383.0 s | 314 s |
| 3 s · 960×540 upscaled to 1080p · 73 frames | 253.8 s | — |
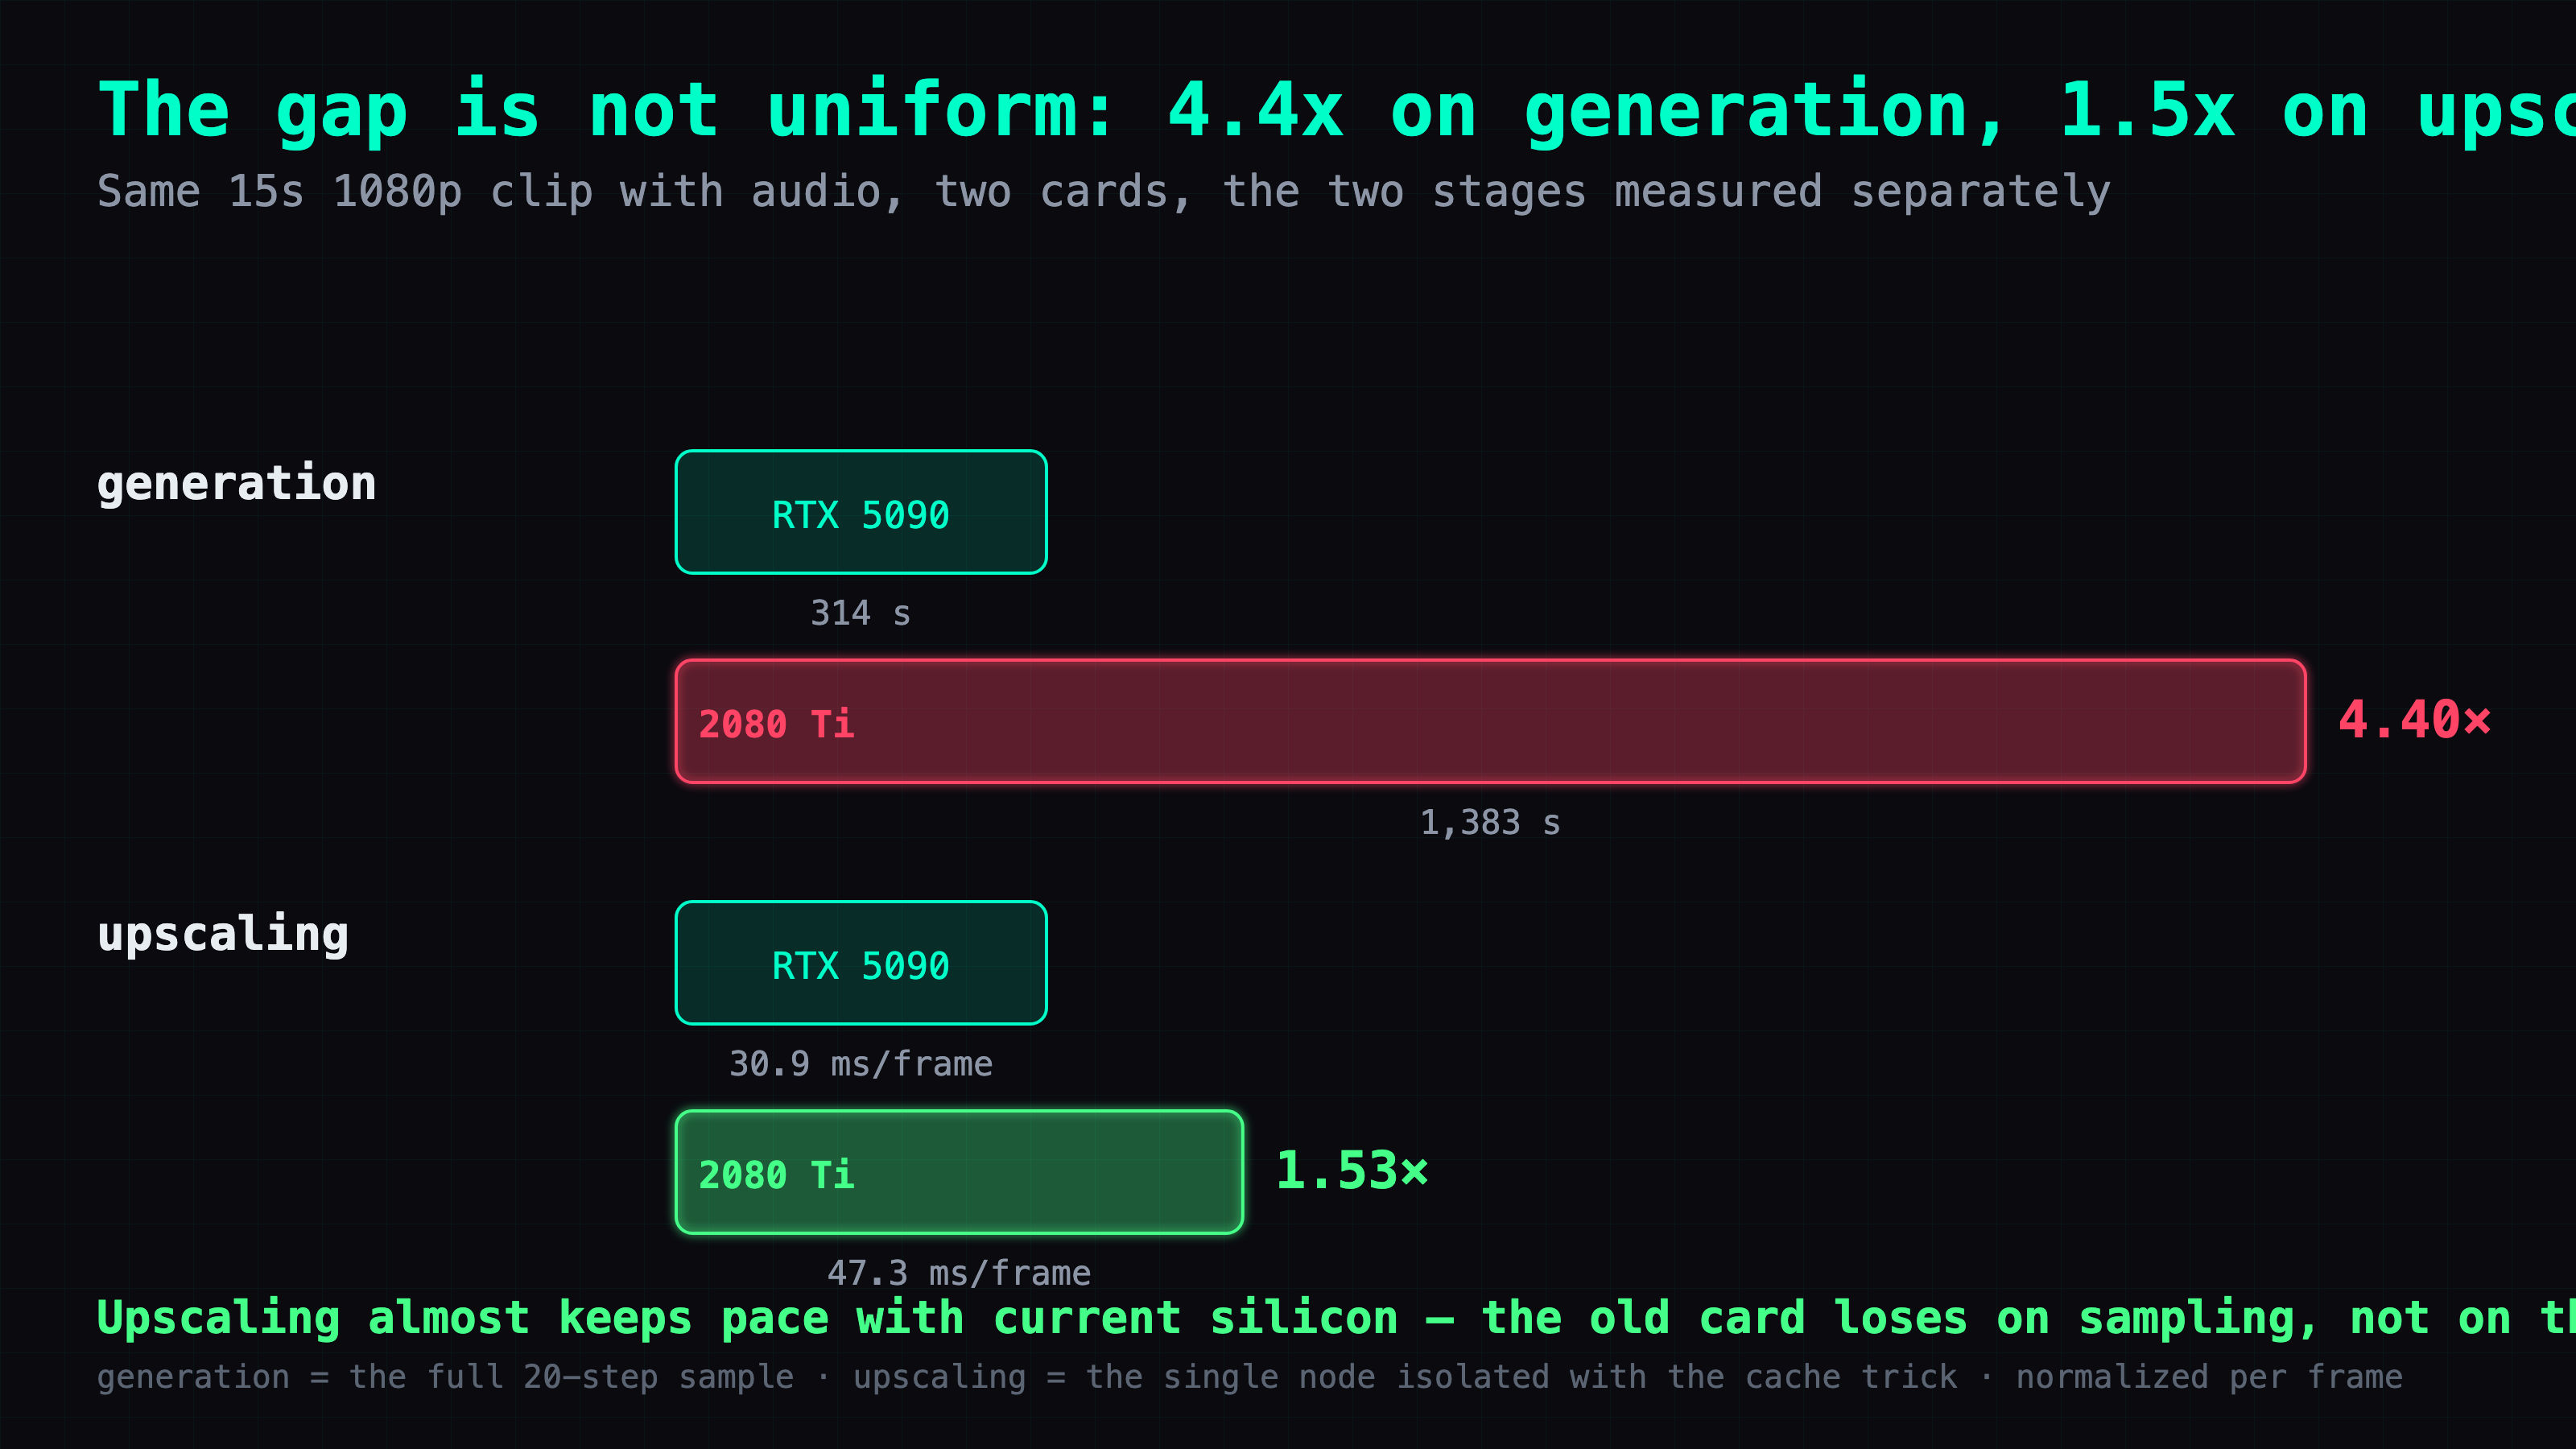
That makes the 2080 Ti 4.4× slower. It is not incapable, just slow, and the two lead to completely different decisions. "This card can't do it" makes you buy a 5090. "This card takes 23 minutes" makes you queue a batch before bed and collect it in the morning.
The surprise is in the upscale stage. RTX Video Super Resolution runs on this card, and it is not the bottleneck:
| card | frames | upscale time | per frame |
|---|---|---|---|
| RTX 5090 | 362 | 11.17 s | 30.9 ms |
| modded 2080 Ti 22G | 73 | 3.45 s | 47.3 ms |
1.53× slower per frame, on a card seven years older — a much smaller gap than the 4.4× on generation. I isolated the upscale stage with the cache-separation method from the 5090 speedup article.
🔊 Sound on. Same seed, same prompt, only the upscale node differs. Left: Real-ESRGAN. Right: RTX VSR. Both rendered on the modded 2080 Ti.
⚠️ One thing I cannot explain: the quality-mode ranking is inverted between the two cards. On the 5090, ULTRA produces the largest file, which is what you would expect when it keeps the most detail. On the 2080 Ti, ULTRA produces the smallest — 643 KB against HIGHBITRATE_ULTRA's 703 KB. Pick the mode by measuring on your own machine rather than copying mine.
The same clip on three machines: 314 / 741 / 1,383 seconds
Same model, same 15.08-second 362-frame 1920x1080 clip with audio, each machine running the config I actually ship on it:
| machine | released | config | seconds | vs 5090 |
|---|---|---|---|---|
| RTX 5090 | 2025 | 14 steps · SageAttention · RTX VSR | 314.0 | 1.0x |
| DGX Spark (GB10) | 2025 | 14 steps · SageAttention · SPAN | 741.0 | 2.4x |
| Modded RTX 2080 Ti 22G | 2018 | 20 steps · SageAttention · RTX VSR | 1,383 | 4.4x |
Eight years of hardware is worth 4.4x on this particular job — and all three finish.
⚠️ This is not a single-variable comparison. It is three shipped configs. The biggest mismatch is step count: the 2080 Ti run is 20 steps while the other two are 14. Going 20 to 14 measured 14.5% faster on the GB10, so the 2080 Ti would be quicker at 14 — I have not run it.
Deep dive: how that config got there
Skippable — everything above is the complete working setup. This half is the road taken to get there, including one branch I followed all the way to the end before realising it was the wrong one.
The longest detour: seeing the fallback and trying to fix it
The reasoning went like this:
- Every attention call logs a fallback, while the banner claims SageAttention is on
- So fix it, and SageAttention runs at full speed
- Derive where
Required: 67584comes from, halveBLOCK_Mfrom 128 to 64 — the message really does disappear - Measure: 176.2 s, slower than doing nothing at all
Halving BLOCK_M doubles the block count, and twice the scheduling and boundary handling costs more than the fast path saves. The unpatched build takes the large-block fast path on most calls and pays SDPA's price on a few; the patched build pays a small penalty on every call. Two fallbacks are cheaper than a globally worse tiling.
An earlier judgment went down with it. I had used the patched build to represent "SageAttention", concluded it was useless on Turing, and wrote that down. The untouched build was the fastest of the three the whole time.
| build | seconds | |
|---|---|---|
| SageAttention untouched (2 fallbacks) | 133.37 | fastest |
| SDPA (flag off) | 160.25 | baseline |
| SageAttention, patched kernel (0 fallbacks) | 176.2 | slowest |
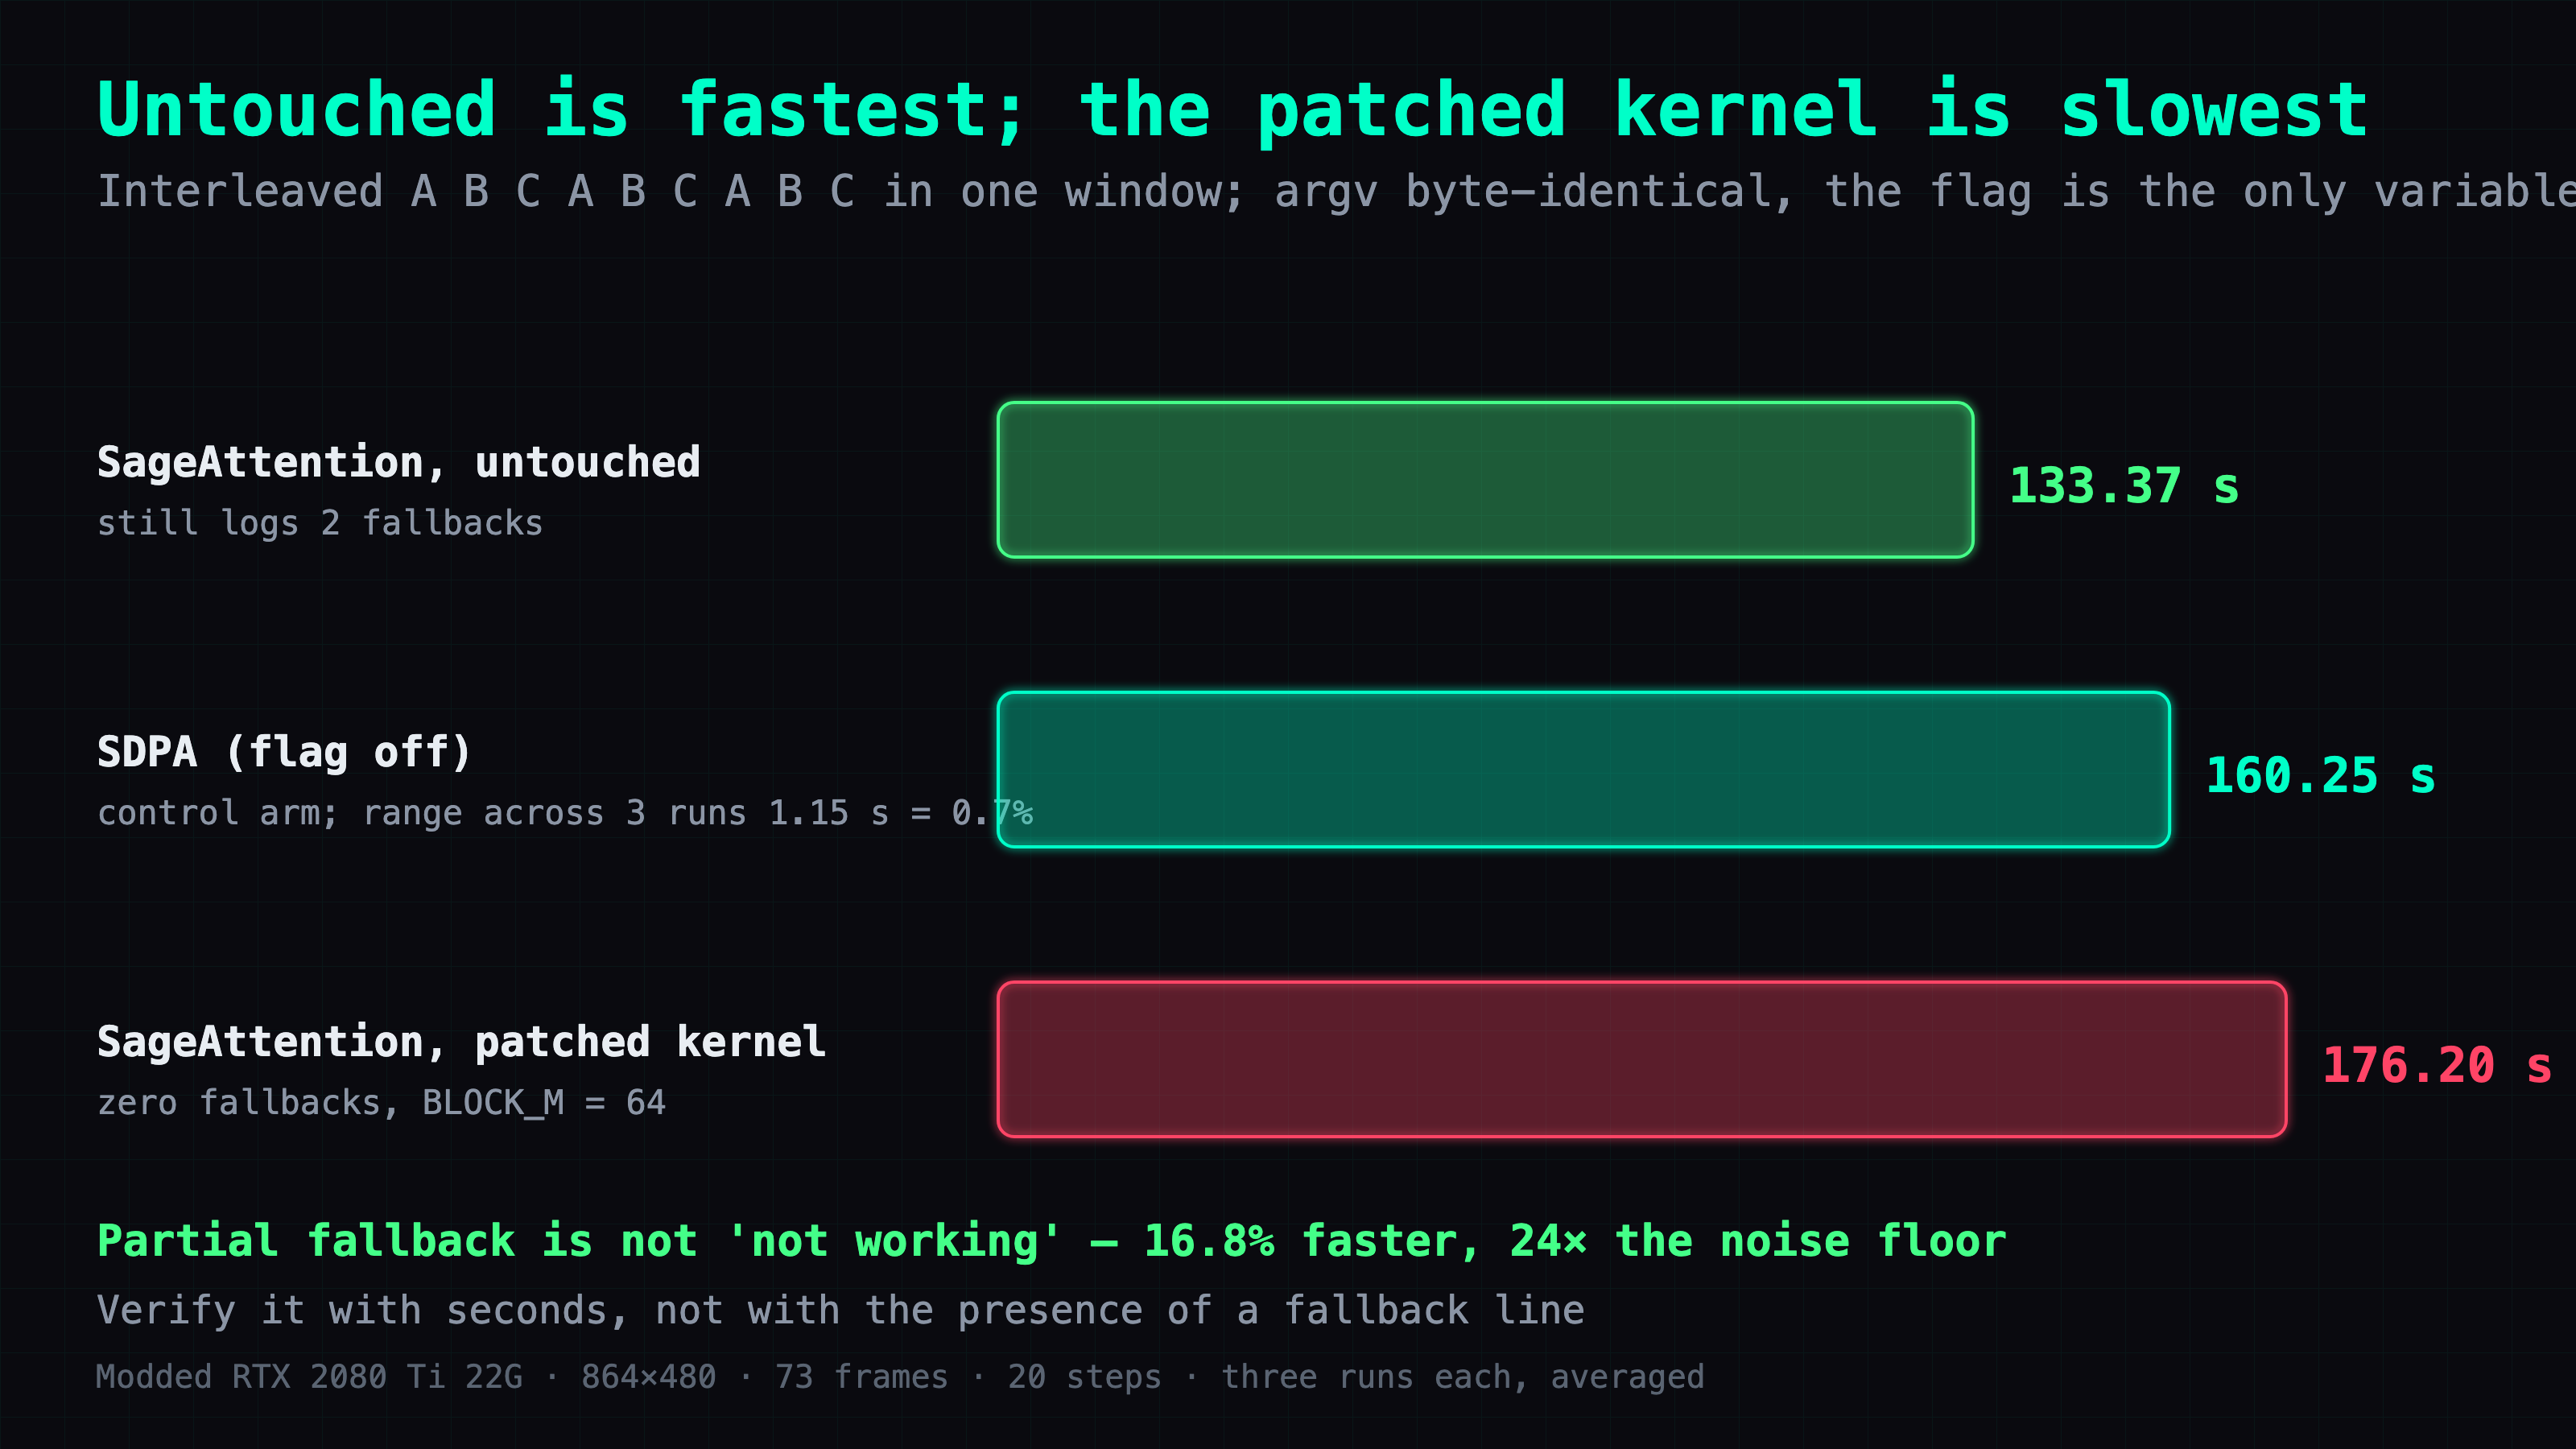
The measurement design is the part worth copying. I ran the three arms interleaved — A B C A B C A B C — in a single window, argv byte-identical between arms except for the flag under test. The control arm's range across three runs was 1.15 s, or 0.7%, so a 16.8% effect is 24× the noise floor and needs no statistical argument. Raw: SDPA 160.88 / 159.73 / 160.13; Sage 133.51 / 133.18 / 133.41. Interleaving matters more than repetition count — it is what absorbs thermal drift, which a sequential AAA BBB design folds straight into the effect.
💡 A fallback line is noise, not a symptom. Chasing it into the kernel trades performance for a tidy log.
The derivation below is sound and, as far as I can find, original. Only its conclusion changed — from "I fixed it" to "I should not have."
Where 67,584 comes from
Hardware limit: 65536 is 64KB, Turing's per-SM shared memory. Required: 67584 overshoots by exactly 2,048 bytes — a 3% overshoot, and the kernel is simply unlaunchable. Three turns pinned it:
Turn one: resolution didn't change the number. Three different resolutions, three identical Required: 67584. A shared-memory requirement independent of input size is not a function of sequence length; it is a compile-time constant.
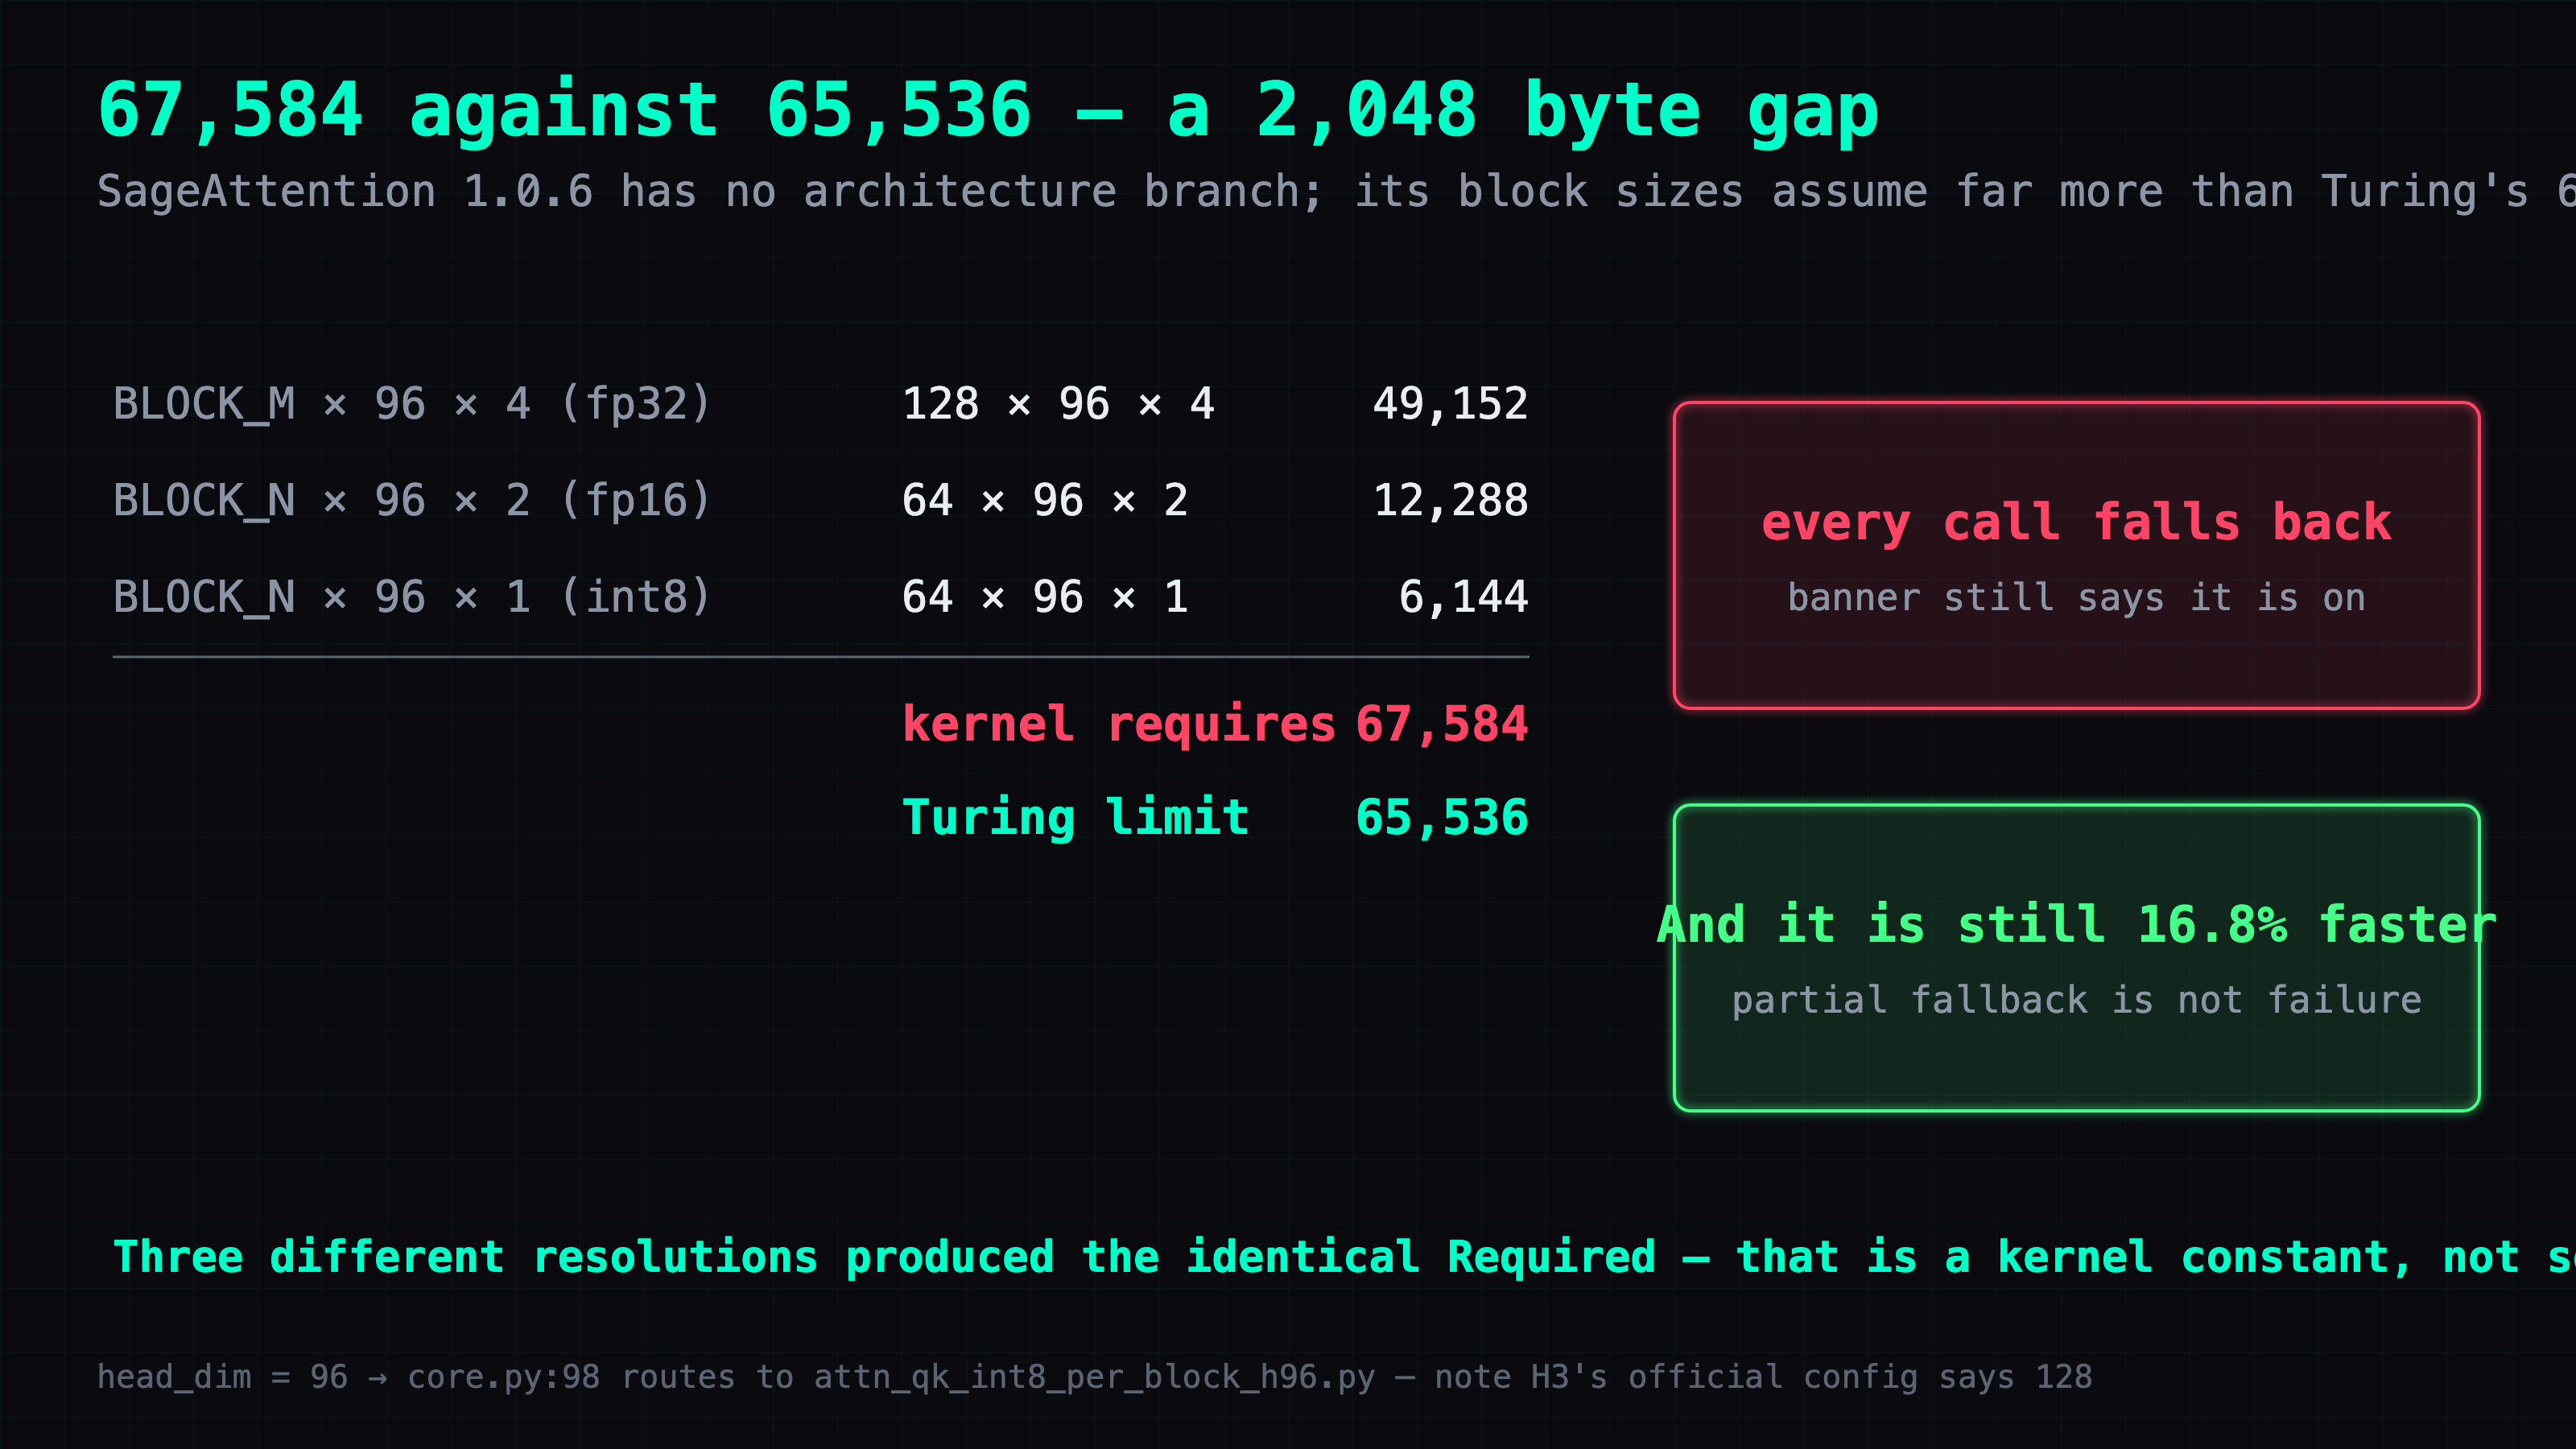
Turn two: the arithmetic matches exactly. SageAttention 1.0.6's h96 kernel defaults to BLOCK_M=128, BLOCK_N=64. The three tiles it stages come to (128×4 + 64×2 + 64×1) × head_dim, or 704 × head_dim:
BLOCK_M × 96 × 4 (fp32) = 128 × 96 × 4 = 49,152
BLOCK_N × 96 × 2 (fp16) =  64 × 96 × 2 = 12,288
BLOCK_N × 96 × 1 (int8) =  64 × 96 × 1 =  6,144
                                  total = 67,584
Exact to the byte, and 96 is the only value that lands there — 128 gives 90,112 and 64 gives 45,056. So whatever attention call reached this kernel had head_dim 96, which is precisely what core.py:98's if headdim == 96: routes here.
⚠️ That call is not the main DiT. MiniMax-H3's official transformer config says attention_head_dim = 128, so the 96 comes from somewhere else in this pipeline. I have not tracked down where.
Root cause: SageAttention 1.0.6 has no architecture branch. Its block sizes assume far more shared memory than Turing's 64KB (Ampere is 100-164KB depending on the part, Hopper 228KB), and 64KB is never checked for.
Turn three: half of the error message's own advice is wrong. It suggests "Reducing block sizes or num_stages". I changed num_stages from 4 to 2 and the requirement did not move — not one byte, which follows directly from the arithmetic: num_stages is not in it.
Right parameter, wrong file
I halved BLOCK_M, restarted, and got the identical 67,584. My first read was that the derivation was wrong.
It wasn't. core.py:98 routes the call to the h96 kernel and I had been editing the head_dim 128 one. Then I hit the same wall again: editing only h96 also did nothing. All six kernels under sageattention/ need the change, and it only takes effect after clearing ~/.triton/cache and the __pycache__ directories — Triton caches compiled kernels by source hash, and a stale entry reproduces the old requirement perfectly.
💡 "My change had no effect" has at least two causes — wrong parameter and wrong file — and they present identically. Distinguishing them costs one deliberate act of sabotage: break the file you think you are editing badly enough that it must throw, and see whether it does.
I misjudged RTX VSR too
I wrote off RTX Video Super Resolution on this card before ever running it, on the strength of an old Maxine SDK support table full of A100 and H100-class parts.
Wrong yardstick. The current nvidia-vfx wheel supports Turing through Blackwell. It installed and it ran — the 47.3 ms/frame above is it.
Why W4A4 does not work
Included so nobody has to walk it again. The reasoning went: the INT8 DiT is 19.53 GiB and fills the card almost completely — and Turing has an INT4 path, so W4A4 would halve it again.
- Straight quantization blew up. The weights overflow INT4's representable range and it will not run at all.
- So it needs rescaling.
SCALEat 1, then 1/16, 1/64, 1/256 — eventually it ran to completion. - The video came out, and it was unusable: colour tearing across the whole frame, neon bokeh smeared away.
- The microbenchmark matches what the eye sees: relative error 0.2005 against INT8's 0.0110, 18× worse.
⚠️ This is as far as I took it. All four SCALE values broke in the identical way and removing the upscaler did not help either, so I stopped there and went back to INT8. That is not the same as proving W4A4 can never work on this DiT — only that none of the paths I tried produced a usable frame. Those weights are deleted from my machine.
FAQ
- Can you run MiniMax-H3 on a 22GB GPU?
- Yes. A modded RTX 2080 Ti 22G (sm_75, 22,528 MiB) rendered a 15-second 1080p clip with audio in 1,383 seconds — 23 minutes — at 88.87s per step. It needs an INT8 diffusion transformer, a W4A4 text encoder, and ComfyUI started with --reserve-vram 4. The four files are 38 GiB on disk but they take turns; they are never all resident.
- What does --reserve-vram actually do in ComfyUI?
- It is not only memory held back for the OS — it is simultaneously the budget the sampler has for activations. Set it too low and the activations have nowhere to go, so you get an OOM mid-render; set it too high and model weights get evicted to streaming and every step crawls. At 2 a 15-second clip OOMs; at 4 it works; at 8, 9.5GB of weights gets evicted and every step takes over five minutes.
- Is SageAttention worth using on an RTX 2080 Ti (sm_75)?
- Yes — 16.8% faster than PyTorch SDPA in an interleaved A/B, 133.37s versus 160.25s, against a control-arm noise floor of 0.7%. It logs a shared-memory fallback on some attention calls and silently takes the fast path on all the others. Judge it by the wall-clock seconds, not by whether the fallback line appears.
- Does RTX Video Super Resolution work on Turing GPUs?
- Yes. The current nvidia-vfx wheel supports Turing through Blackwell, despite older Maxine SDK support tables that list only datacenter parts. Isolating the upscale stage, a 2080 Ti runs 47.3 ms/frame against a 5090's 30.9 ms/frame — 1.53× slower on a card seven years older. The quality-mode ranking differs between the two cards, so measure on your own machine.
- Should I quantize a video diffusion model to W4A4?
- Not the diffusion transformer. On MiniMax-H3 the W4A4 DiT had a microbenchmark relative error of 0.2005 against INT8's 0.0110 — 18× worse — and produced full-frame colour tearing that no rescaling factor fixed. The text encoder is a different story: Qwen3-VL-32B at W4A4 drops from about 24GiB to 13.2GiB and cuts wall-clock time by 8.6% with no visible quality cost, because it only produces conditioning.
Read next
- 2026-07-18[Just for Fun — Advanced] Two Identical 2080 Tis, One 3.4× Slower — the Culprit Was a Single dtype Log Line
The same modded 2080 Ti 22G ran Z-Image 3.4× slower on one machine than another. Not the hardware, not the OS, not a missing package — a Turing bf16→fp32 fallback hiding in one log line. One flag fixed it.
- 2026-09-14[Benchmark] Two-stage MiniMax-H3 + LTX-2.5 on a 2080 Ti: 1344x768 with audio in 165s
A modded RTX 2080 Ti 22G renders 1344x768 with audio in 165 s using MiniMax-H3 to draft and LTX-2.5 to refine. Six departures from the Blackwell workflow.
- 2026-08-20[Just for Fun — Advanced] Why Isn't Your 4-Bit Quant Faster on a 2080 Ti? I Tore Open the CUDA Backend to Find Out
Quantized weights are half the file size on a 2080 Ti but the speed doesn't move. Dumping the CUDA backend's .so with nm -D shows why, and which quant format is actually accelerated.
- 2026-08-28[Benchmark] A 177B MoE on Three Modded 2080 Tis: 23 tok/s at 128K, 77 on a File Edit
Qwen3.8-Flash-Next (176.94B, arch qwen4exp) runs on 3× modded 2080 Ti 22G at 23.14 tok/s at 128K context — and 3.51× that on a file edit, with no draft model.
Don't miss the next one
Subscribe, and you won't.
One-click unsubscribe anytime.