MiniMax-H3 on RTX 5090 · part 2
[Benchmark] Twice as Fast: MiniMax-H3 on an RTX 5090, 625s Down to 314s
❯ cat --toc
- Half the render time came off, and most of it was the upscaler
- Dropping 20 steps to 14 costs nothing visible
- SageAttention 2.2.0 takes another 18.8%, and PyPI will not give it to you
- Swapping the upscaler cut 97.8 seconds
- Why was my 1080p output 1056 pixels tall?
- The quality dropdown shows 4 modes out of 17, and the 4 are the wrong family
- 960×540 is the floor, and a bigger file is the warning sign
- Effective face pixels: write "close-up" instead of raising the resolution
- 4K on the same line costs 73.9 seconds
- RTX VSR is x86_64 only, and that is not a "not yet"
- The same clip on three machines: 314 / 741 / 1,383 seconds
- The whole config, as of 2026-08
- Deep dive
- Weighing one node: ComfyUI's cache does the isolation for you
- Why did the first hot run take 32.4 s instead of 11.2?
- All four quality modes for 55 seconds of GPU time
- The mode ranking flipped on a 2080 Ti
- My prediction was half wrong: the face does not collapse, it goes smooth
- What transfers to your machine and what does not
TL;DR
Same 15-second 1080p clip with audio, same seed: 625 s → 314 s on one RTX 5090, with no visible quality loss. Three stacked changes: 20→14 steps (−18.9%), SageAttention 2.2.0 (−18.8%), and NVIDIA's RTX Video Super Resolution replacing Real-ESRGAN (−23.7%). The upscaler turned out to be the largest single win and the one I had never measured — Real-ESRGAN is a 2021 image model run across 362 frames, while VSR is video-native on TensorRT: 109 s → 11.2 s for that leg alone. One limit: nvidia-vfx ships x86_64 wheels only, so ARM is out.
🔊 Sound on. Fifteen seconds, 1080p24 with stereo audio, generated locally on one RTX 5090 in 314 seconds. The same clip took 625 seconds before these three changes.
Half the render time came off, and most of it was the upscaler
People who tune cars fixate on the engine, because horsepower is the number that photographs well. What actually drops the lap time is often one small part nobody bothered to measure — and swapping it is where the speed suddenly shows up.
I did the software version of that. Two days on samplers, step counts and attention kernels, and I never once measured the upscaler sitting at the end of the graph.
The previous part covered getting MiniMax-H3 to run on a single RTX 5090 at all — which four files to download, where they go, and how to write a prompt the model will follow. This part is about the three switches that took the same output from 625 seconds to 314.
Each row below stacks on the one above it. Read the right-hand column: every change is worth roughly a fifth, and they compound.
| Configuration | Total time | Change |
|---|---|---|
| 20 steps + Real-ESRGAN (starting point) | 625 s | — |
| 14 steps | 507.0 s | −18.9% |
| + SageAttention 2.2.0 | 411.8 s | −18.8% |
| + RTX VSR replacing Real-ESRGAN | 314.0 s | −23.7% |
Total: −49.8%. Ten minutes and 25 seconds becomes five minutes and 14 seconds.
The output is the same file in every measurable respect. Same prompt, same seed throughout, and ffprobe on both ends of the ladder agrees:
1920x1080 · 24 fps · 362 frames · aac 32000 Hz stereo · 15.083 s
Not "roughly the same length" or "close enough" — the same frame count, the same audio stream, the same duration to three decimal places. The picture did not get worse either, which I will come back to with a frame-by-frame comparison.
Dropping 20 steps to 14 costs nothing visible
The MiniMax-H3 template ships with 20 sampling steps. That number is conservative rather than measured, in the way that shipped defaults usually are.
At 14 steps I cannot see a difference. Not "a small difference I decided to accept" — I pulled matching frames and could not point at one.
Across my three machines this switch measured between 14.5% and 18.9%, depending on how the rest of the configuration is set. The same flag is worth different amounts on different boxes.
This is the cheapest of the three switches: it is one number in the sampler node, it needs no new package, and it applies whether or not you do anything else in this article.
SageAttention 2.2.0 takes another 18.8%, and PyPI will not give it to you
SageAttention replaces the attention kernel with a quantized implementation. On the 5090 (sm_120) it took the render from 507.0 s to 411.8 s — 18.8%.
I ran the same comparison on a GB10 (sm_121) the same day and got 20.1%. Two independent machines landing that close to each other is the difference between a measurement and a fluke.
Enabling it is a launch flag:
python main.py --use-sage-attention
There are two traps, and both of them fail quietly.
The version on PyPI is not the one you want. The newest sageattention package published there is 1.0.6, a different generation of the kernel. You need 2.x, which means a prebuilt wheel from elsewhere or a build from source at thu-ml/SageAttention. I installed 1.0.6 first. ComfyUI started, the flag was accepted, nothing complained, and my numbers simply did not match what other people were reporting. I went looking at the wrong layer for a while before checking the installed version.
The flag only resolves one package name. --use-sage-attention looks for a package called sageattention. SageAttention 3 ships as a separate package named sageattn3; ComfyUI registers it but never selects it automatically, so the flag will not pick it up. If you install sageattn3 and expect the flag to find it, you get exactly the speed you had before, with no message telling you why.
Swapping the upscaler cut 97.8 seconds
Here is the part I should have looked at first.
The pipeline generates at 960×540 and upscales 2× to 1920×1080. The upscaler in the template is Real-ESRGAN x2plus — a solid model, released in 2021, and an image model. Running it over a 15-second clip means running it 362 separate times, once per frame, with no knowledge that the frames are related.
NVIDIA's Video Super Resolution is video-native and runs on TensorRT. ComfyUI has an official node pack that wraps NVIDIA's nvidia-vfx package: Comfy-Org/Nvidia_RTX_Nodes_ComfyUI. It provides an RTXVideoSuperResolution node that drops straight into the slot where ImageUpscaleWithModel was. Nothing else in the graph changes.
Isolated cost of the upscale leg alone, measured with the trick described in the deep dive. The middle column is the one that changed how I think about this pipeline:
| Upscaler | Upscale leg | Full pipeline |
|---|---|---|
| Real-ESRGAN x2plus | ~109 s | 411.8 s |
| RTX Video Super Resolution | 11.2 s | 314.0 s |
Close to 10× on the leg, 97.8 seconds off the total.
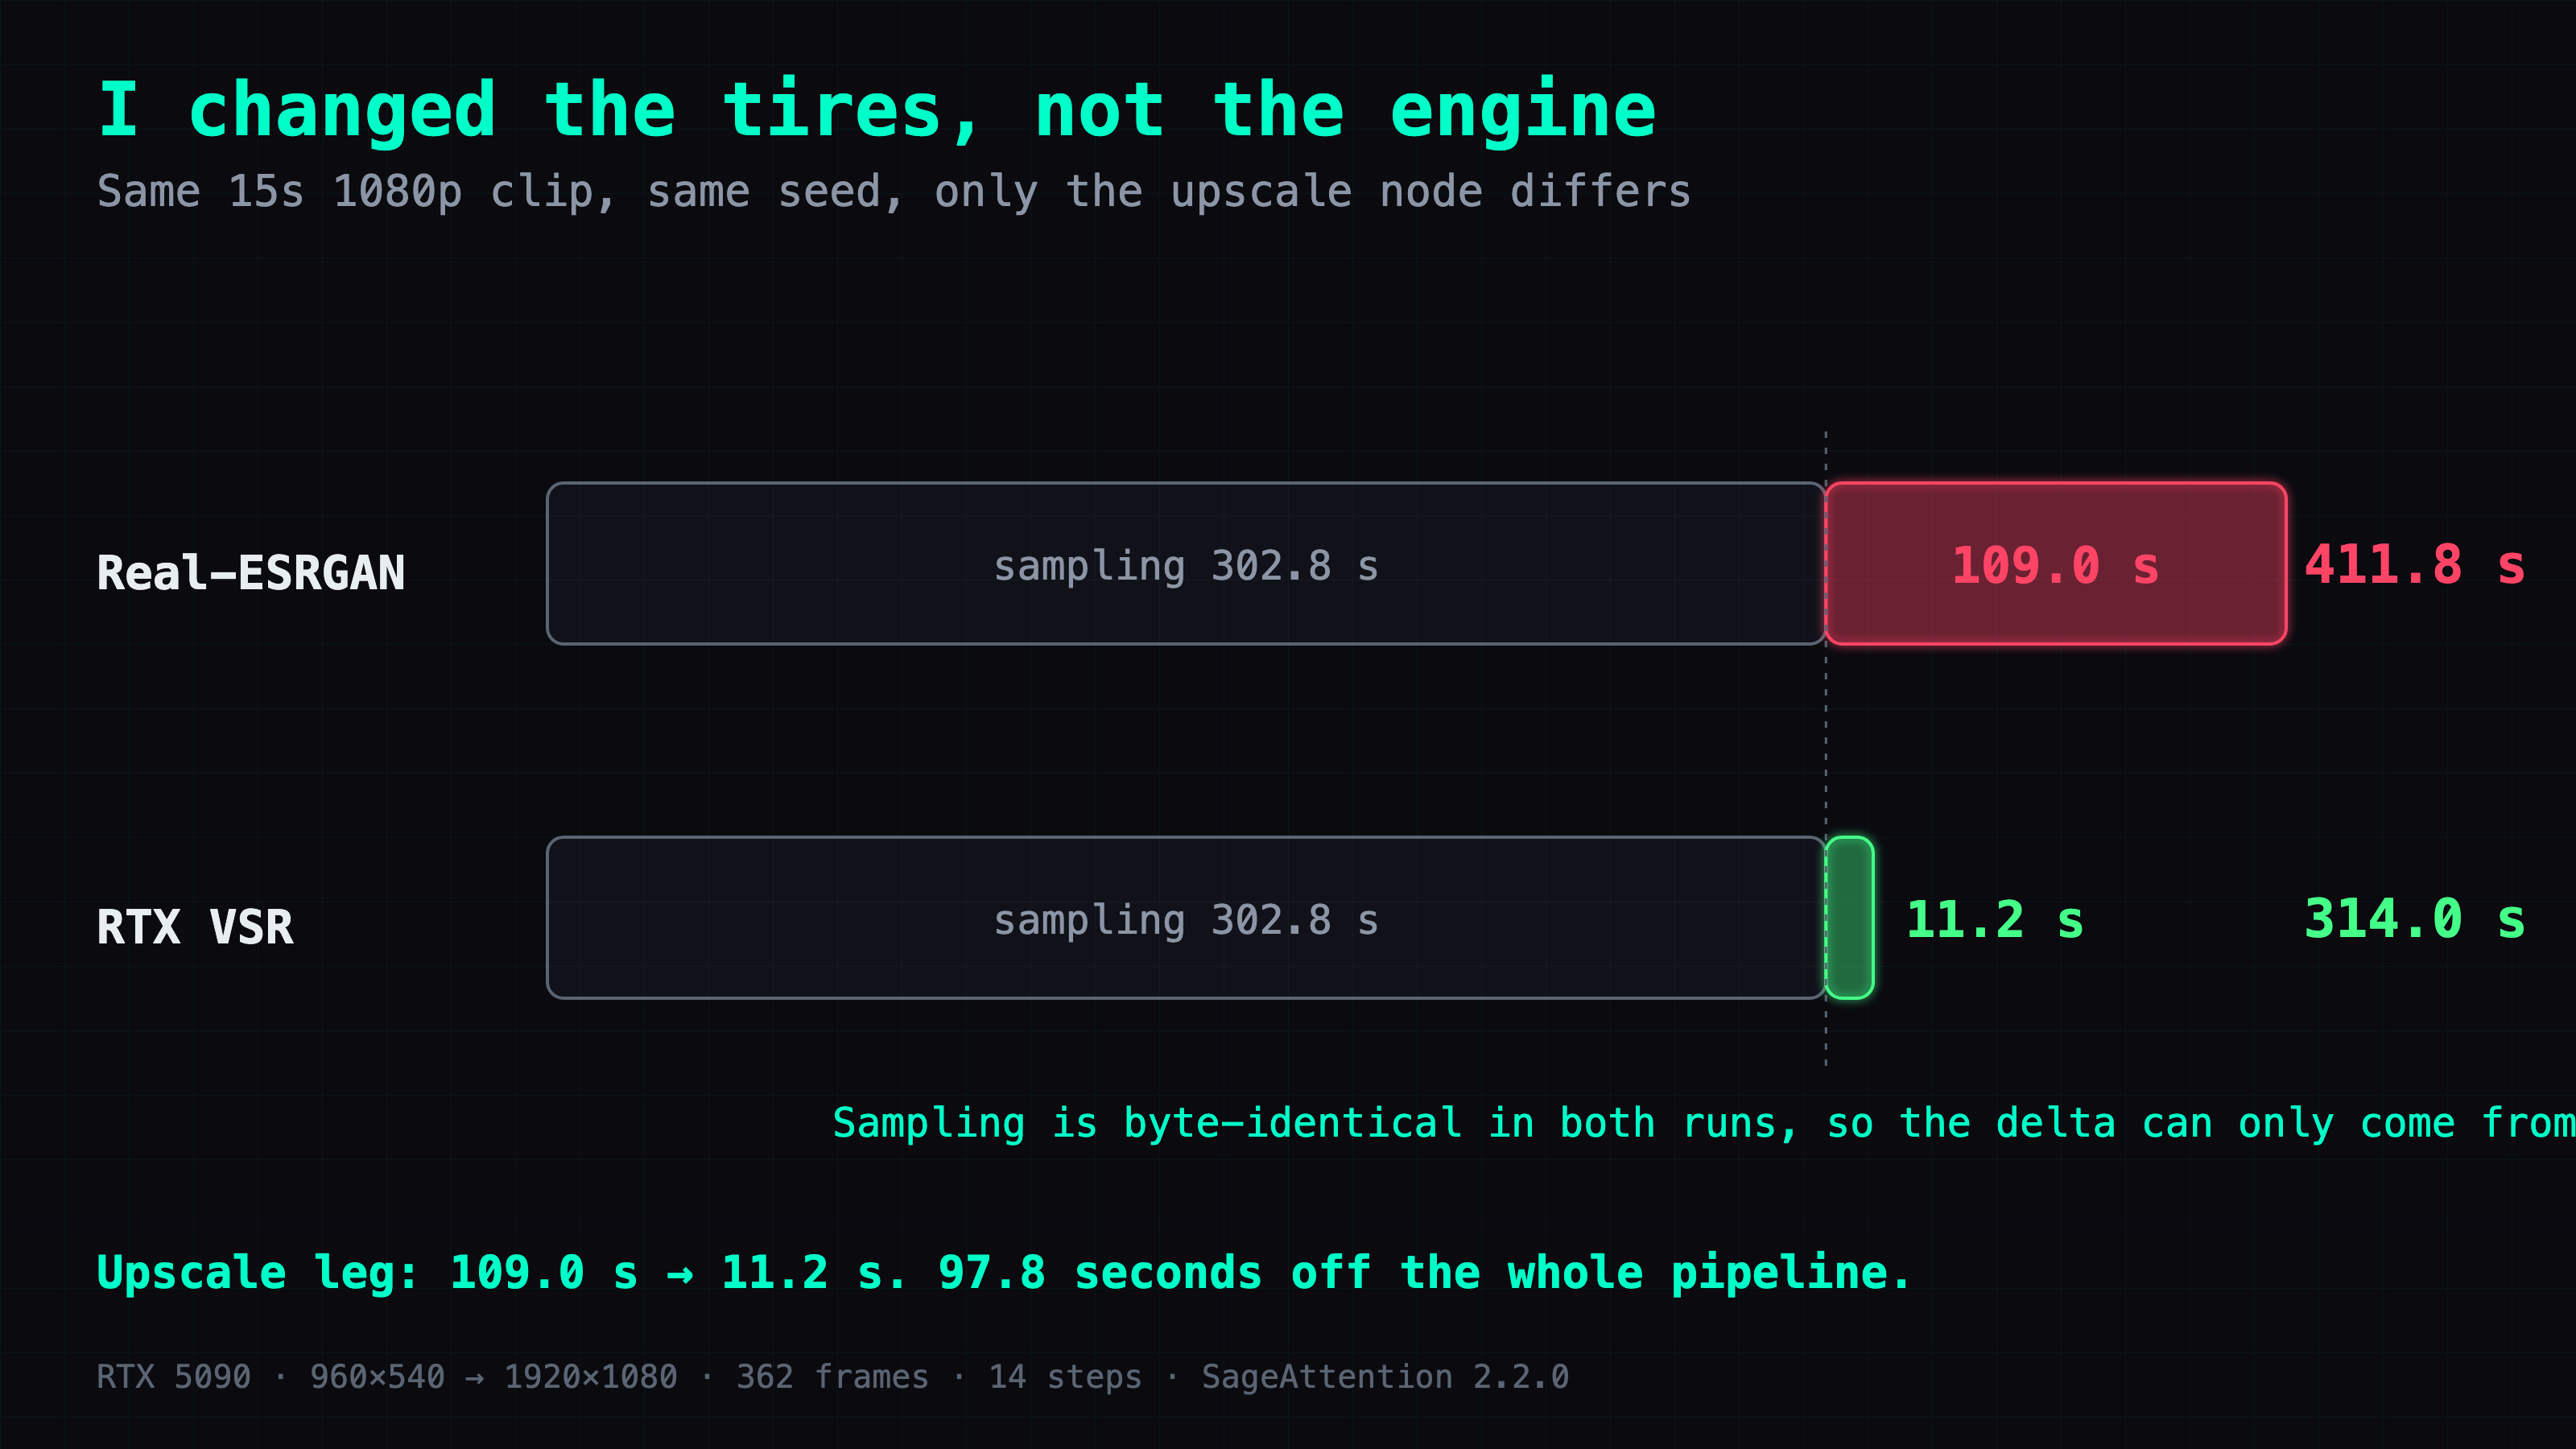
🔊 Sound on. Same seed, same prompt, only the upscale node differs. Top: Real-ESRGAN, 411.8 s. Bottom: RTX VSR, 314.0 s.
The obvious question is what you give up for that. I put frame 180 from both runs side by side at full size. VSR holds slightly more skin detail; ESRGAN gives slightly cleaner background bokeh. Neither one breaks down anywhere. I had to zoom to 200% before I could point at a difference at all, and at that point I am no longer describing something a viewer would notice.
Why was my 1080p output 1056 pixels tall?
This one cost me a while, because nothing anywhere reported an error.
MiniMax-H3's _empty_av_latent() computes the latent height as height // 16. Ask for 540 and you get:
540 / 16 = 33.75 → floor 33 → 33 × 16 = 528
So the generation is 960×528, not 960×540. Upscale that 2× and you get 1920×1056. Twenty-four pixels short of 1080, in a file that otherwise looks completely correct — right aspect ratio at a glance, right frame count, right audio.
The fix is one node. Put an ImageScale between the H3 node and the upscaler, set to 960×540, bilinear, crop disabled:
MiniMaxH3ImageToVideo (960×540)
  → ImageScale (bilinear, 960×540, crop=disabled)
    → RTXVideoSuperResolution (scale 2.0)
      → CreateVideo (fps 24)
        → SaveVideo (mp4/h264)
Check for this specifically, because it fails silently. Nothing raises, nothing warns, and you find out when something downstream expects 1080 and does not get it.
The quality dropdown shows 4 modes out of 17, and the 4 are the wrong family
The RTXVideoSuperResolution node's quality dropdown offers four options: LOW, MEDIUM, HIGH, ULTRA.
The underlying nvvfx.effects.QualityLevel enum has 17. Read the right-hand column, because what each family was trained on decides which one you want:
| Family | Members | Designed for |
|---|---|---|
| Baseline | BICUBIC | reference, no model |
| Standard | LOW MEDIUM HIGH ULTRA | typical compressed video |
| High bitrate | HIGHBITRATE_ ×4 | clean sources: ProRes, high-bitrate H.265 |
| Deblur | DEBLUR_ ×4 | a blurry source |
| Denoise | DENOISE_ ×4 | a noisy source |
NVIDIA's own documentation says the standard modes are trained on typical compressed video and actively remove compression artifacts.
Diffusion output has zero compression artifacts. It was never encoded. A model trained to find and suppress artifacts, pointed at footage that has none, will find the closest thing available — which is real texture. The result is over-sharpening or erased detail, depending on which way the model guesses.
The HIGHBITRATE_* family skips artifact suppression entirely. It was built for sources that were already clean, which is exactly what comes out of a diffusion model.
Adding those options is a one-line change: the dropdown is a single list of strings in the node definition, and the HIGHBITRATE_* names come straight from nvvfx.effects.QualityLevel. Do not bother adding DEBLUR_* or DENOISE_* — they solve a blurry source and a noisy source respectively, and we have neither.
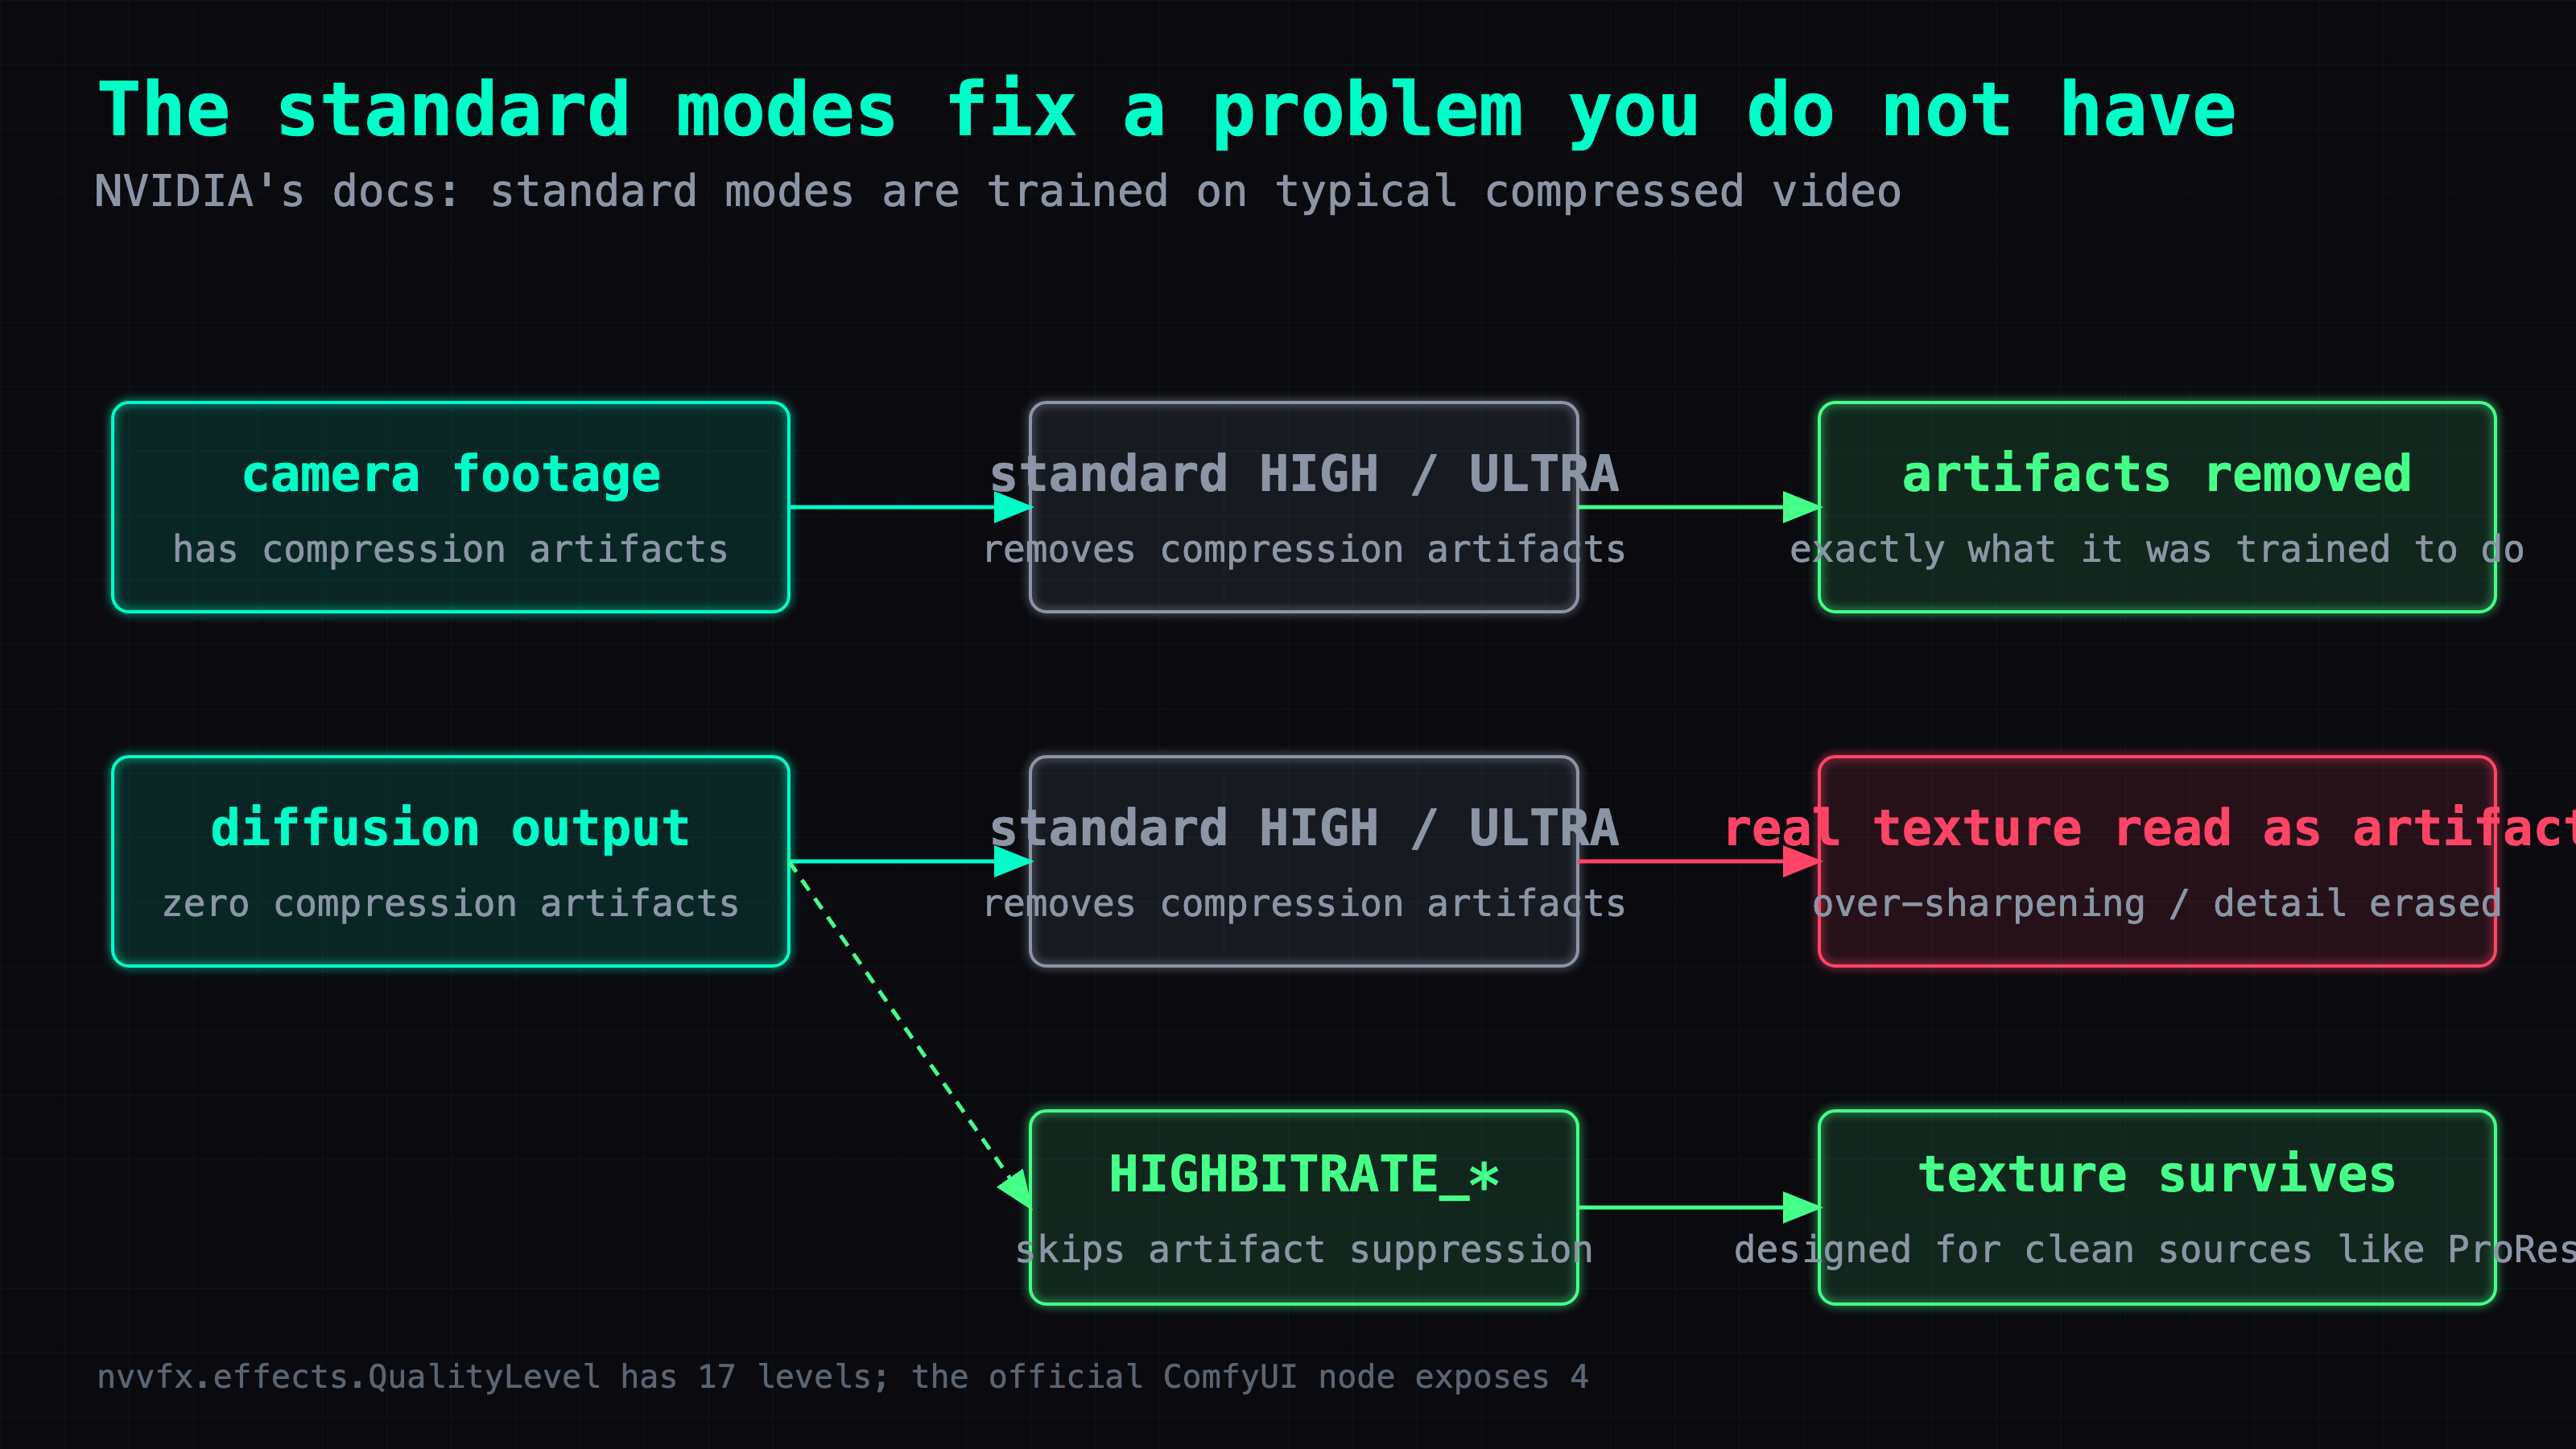
960×540 is the floor, and a bigger file is the warning sign
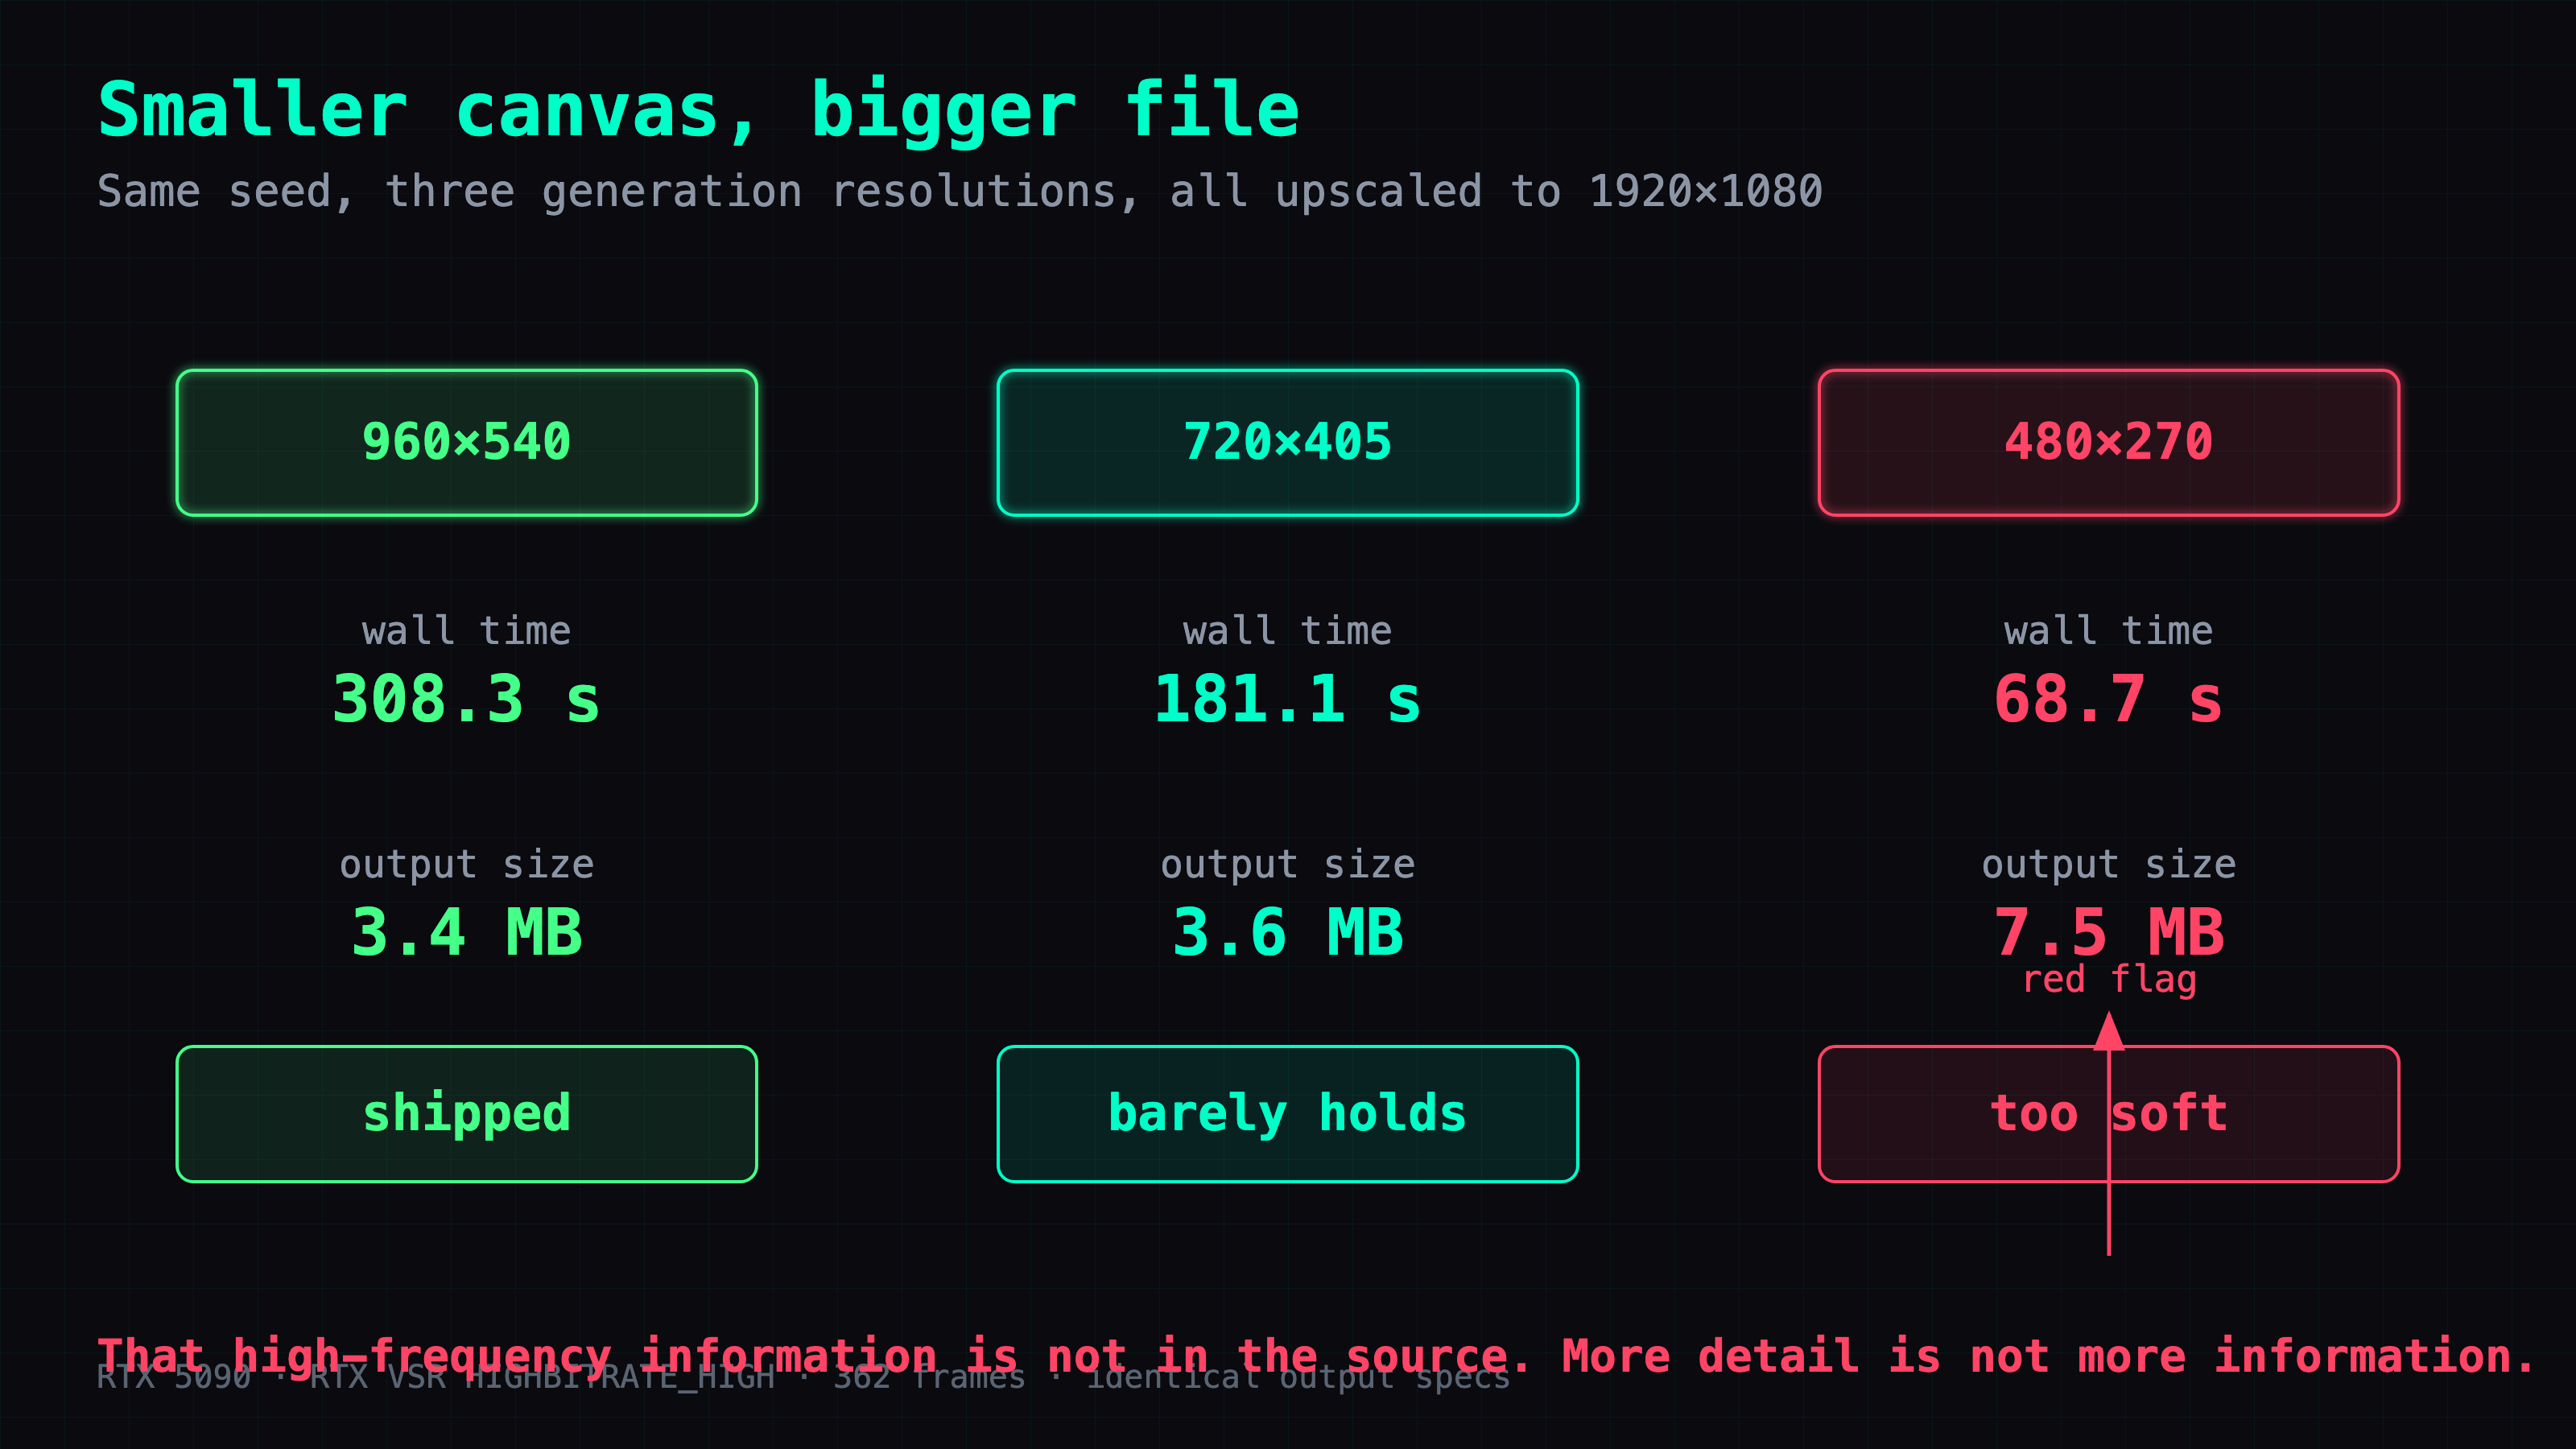
If the upscaler is this cheap, the next thought is obvious: generate smaller, upscale harder, save even more time. I swept it, all runs on the same seed, all upscaled to the same 1920×1080 output.
Read the file-size column, not the time column — the time column just says what you would expect.
| Generation canvas | Upscale | Time | Output size | My verdict on the picture |
|---|---|---|---|---|
| 960×540 | 2× | 308.3 s | 3.4 MB | baseline |
| 720×405 | 2.67× | 181.1 s (−41.3%) | 3.6 MB | barely holds up |
| 480×270 | 4× | 68.7 s (−77.7%) | 7.5 MB | too soft |
The 480×270 run produced a file more than twice the size of the baseline, from a quarter of the pixels. Same frames, same encode settings, and the smallest source gives the biggest file.
That extra high-frequency information cannot have come from the source, because the source does not contain it. VSR invented it. The picture looks soft to the eye and busy to the encoder at the same time, which is a good description of texture that was synthesized rather than resolved.

More detail is not more information.
Effective face pixels: write "close-up" instead of raising the resolution
There is a ruler you can apply before spending any GPU time at all, and it explains the table above better than the resolutions do.
What matters for a face is not the canvas size. It is how many pixels of that canvas the face occupies. Both rows below are the same 960×540 canvas; the right-hand column is the only thing that differs:
| Shot | Face on screen | Effective face pixels |
|---|---|---|
| Wide shot | ~170×200 | 34,000 |
| Close-up | ~420×540 | 226,800 |
That is 6.7× apart, on identical settings, for the cost of one word in the prompt. Writing "close-up" buys more face detail than raising the generation resolution does, and it is free.
Apply the ruler to the sweep: a close-up at 480×270 works out to roughly 31,900 effective face pixels — the same tier as the wide shot on the full canvas, which already was not enough. That is why it looked soft, and I could have predicted it without running anything.
4K on the same line costs 73.9 seconds
The same node handles 4K. Generate at 960×540, set the scale to 4×, and you get 3840×2160 in 73.9 s, producing a 16 MB file with the same 362 frames and the audio intact. The node accepts either a scale multiplier or an exact target size.
One caveat before you point it at everything: at 4K an even smaller fraction of each output pixel traces back to the source. That makes it a good fit for "the source was already good enough and I want it bigger", and a poor fit for "the source was not good enough and I want the upscaler to fix that".
RTX VSR is x86_64 only, and that is not a "not yet"
nvidia-vfx ships only manylinux_2_27_x86_64 wheels. Linux and Windows on x86_64 install it without trouble. ARM machines cannot install it, and there is no ARM binary inside the wheel to fall back to.
A separate article covers why that road is closed.
The same clip on three machines: 314 / 741 / 1,383 seconds
Same model, same 15.08-second 362-frame 1920x1080 clip with audio, each machine running the config I actually ship on it:
| machine | released | config | seconds | vs 5090 |
|---|---|---|---|---|
| RTX 5090 | 2025 | 14 steps · SageAttention · RTX VSR | 314.0 | 1.0x |
| DGX Spark (GB10) | 2025 | 14 steps · SageAttention · SPAN | 741.0 | 2.4x |
| Modded RTX 2080 Ti 22G | 2018 | 20 steps · SageAttention · RTX VSR | 1,383 | 4.4x |
Eight years of hardware is worth 4.4x on this particular job — and all three finish.
⚠️ This is not a single-variable comparison. It is three shipped configs. The biggest mismatch is step count: the 2080 Ti run is 20 steps while the other two are 14. Going 20 to 14 measured 14.5% faster on the GB10, so the 2080 Ti would be quicker at 14 — I have not run it.
The whole config, as of 2026-08
For a 15-second 1080p video with audio on an RTX 5090, this is what I run:
generate  960×540 · length 362 · 14 steps · res_multistep + simple · Spectrum on
correct   ImageScale → 960×540 (bilinear, crop=disabled)
upscale   RTXVideoSuperResolution · scale 2.0 · HIGHBITRATE_HIGH
encode    CreateVideo (fps 24) → SaveVideo (mp4/h264)
launch    python main.py --use-sage-attention
One wiring note that belongs with it: VAEDecodeAudio goes straight into CreateVideo.audio. Only the image path passes through the upscaler. Route the audio through the wrong place and nothing errors — you get a silent video, and you find out when you play it back.
Deep dive
You can skip this section and still use everything above. What follows is how the numbers were obtained, including the measurement I got wrong on the first pass and the prediction that turned out to be half right.
Weighing one node: ComfyUI's cache does the isolation for you
The problem I started with: the pipeline takes around 400 seconds and ComfyUI does not report per-node timing. So "how much of that is the upscaler" had no obvious answer, and for two days I treated it as unanswerable and tuned the parts I could see.
ComfyUI's execution cache keys on node inputs. That is the whole trick:
- Run the graph once, fully. Everything executes, everything caches.
- Resend the same graph with one parameter changed on the upscale node and nothing else touched.
- Every upstream node cache-hits. Only the upscale node and the encode after it actually re-run.
- That run's wall time is the upscale leg.
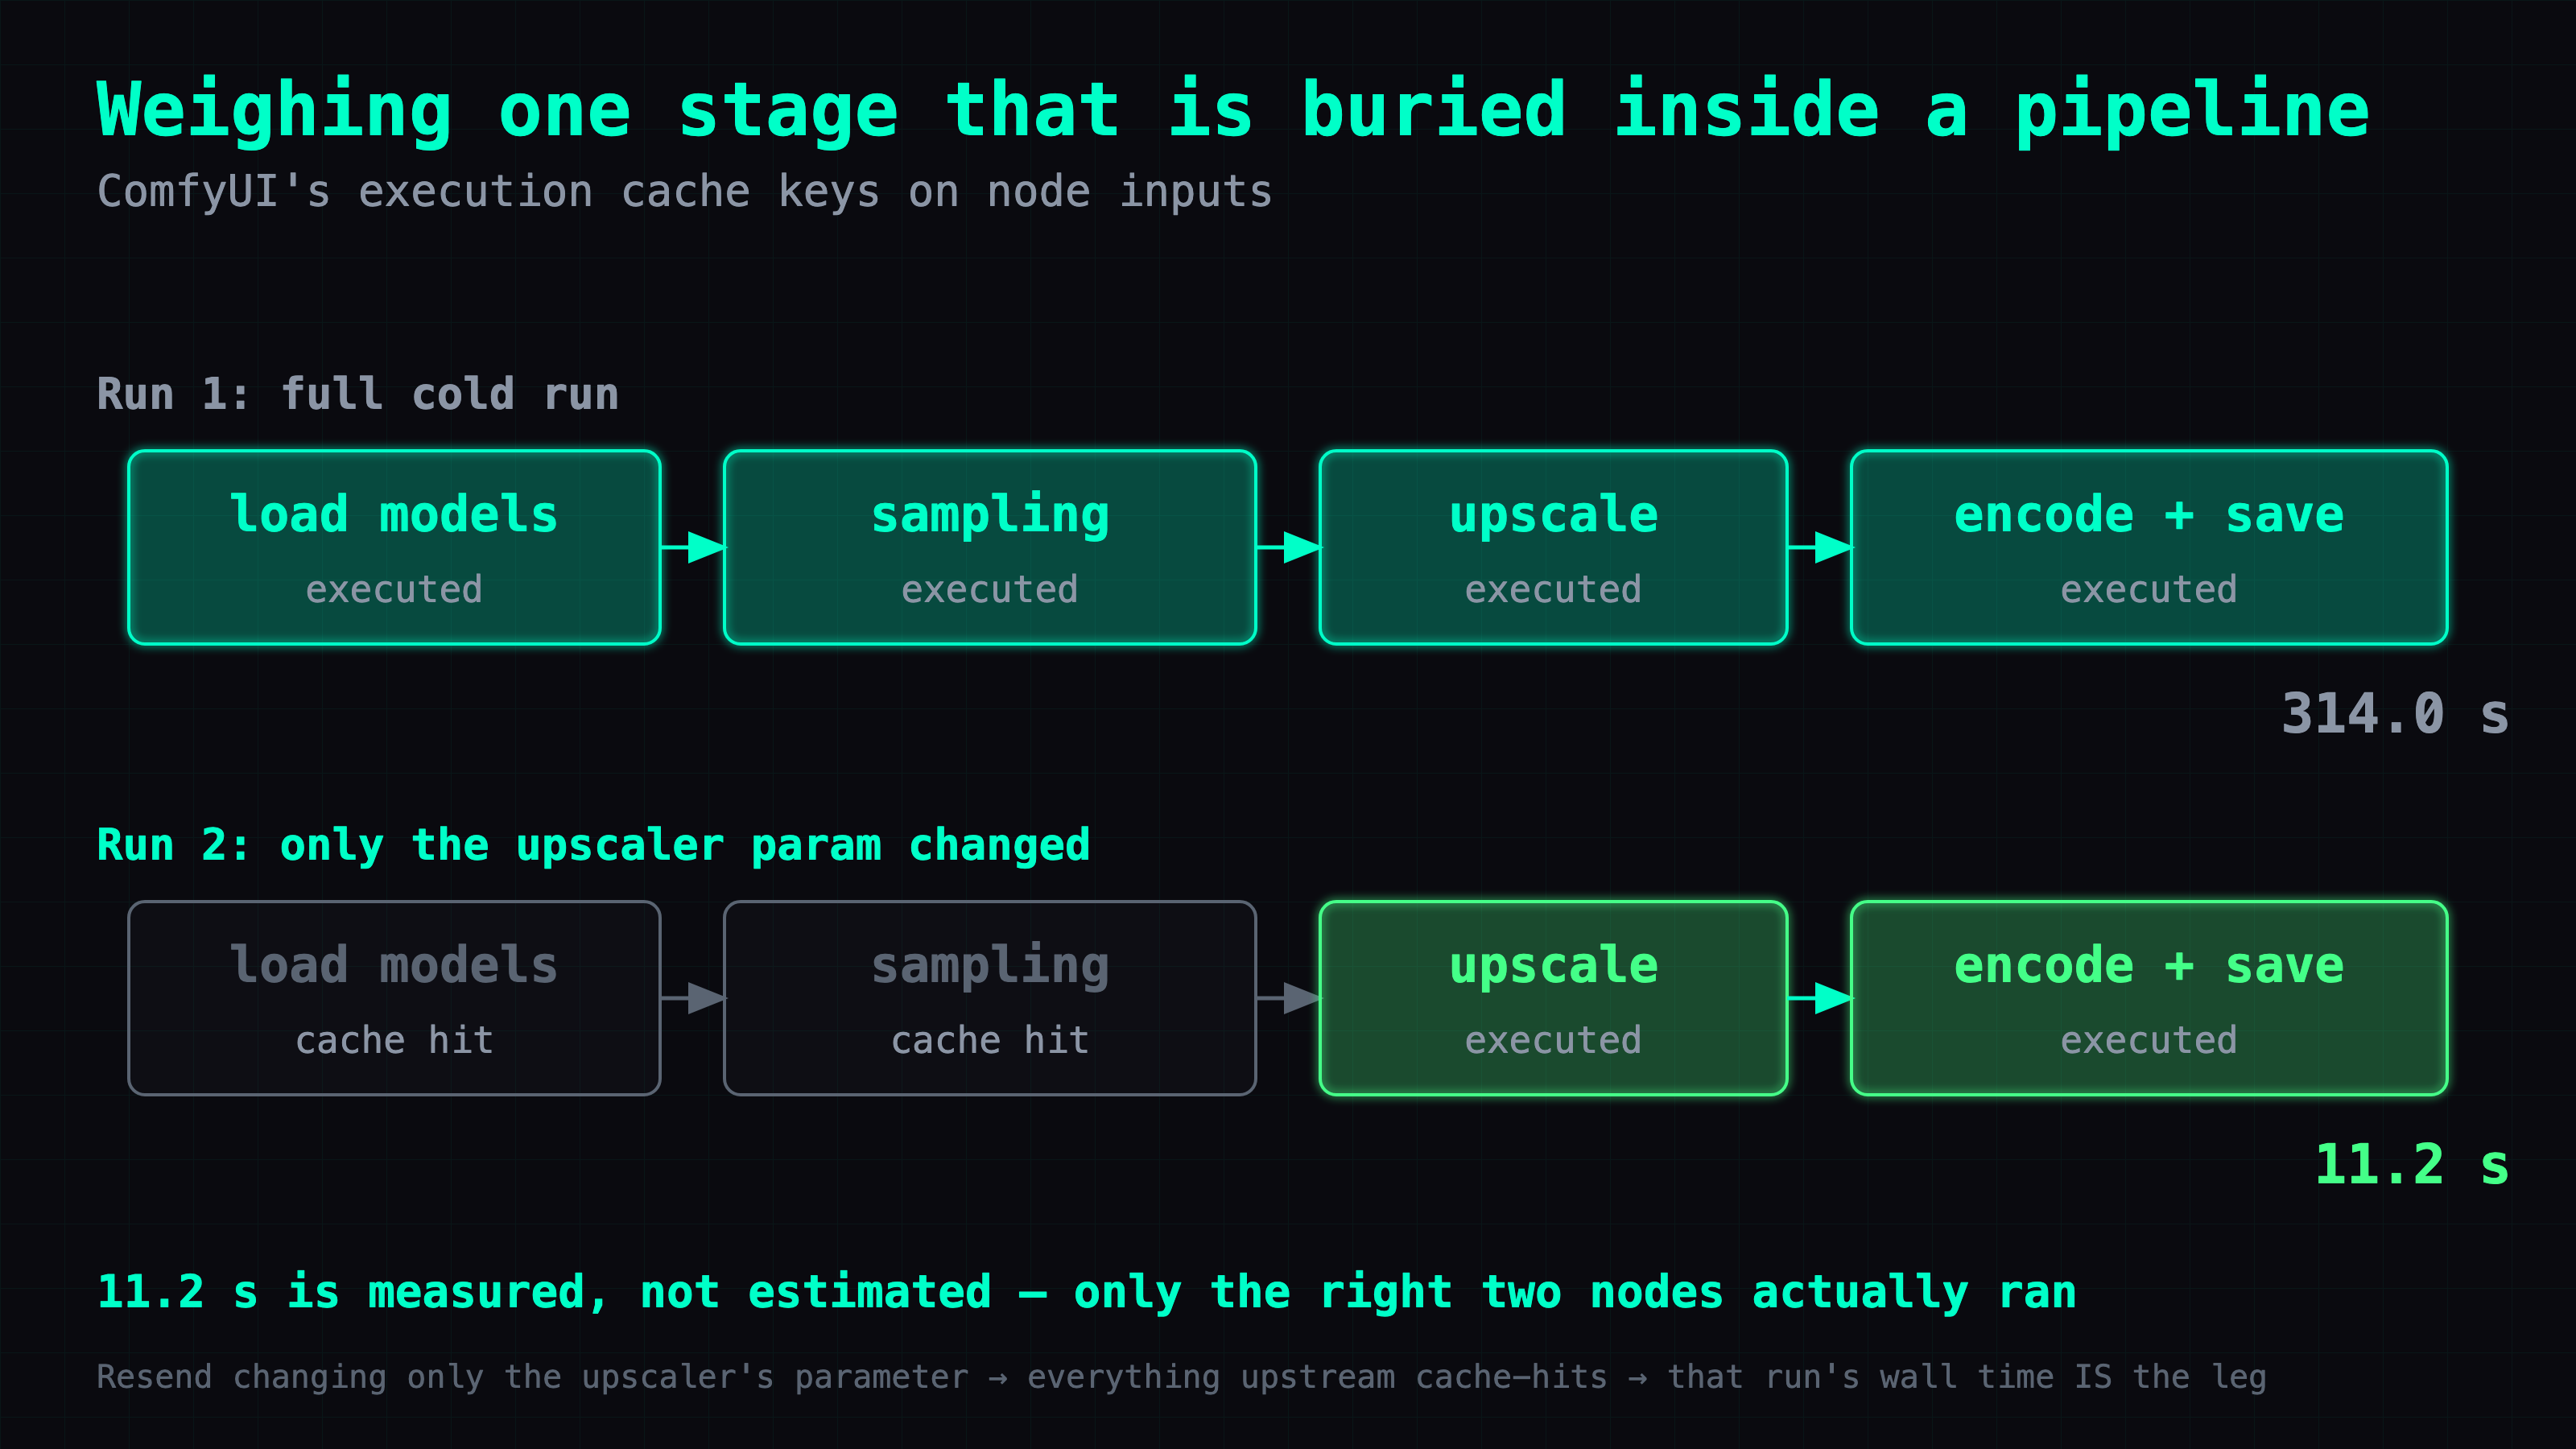
Measured: 314.0 s for the cold full run, 11.2 s for the hot resend. So on the VSR configuration, the upscale costs 11.2 seconds.
To get Real-ESRGAN's cost, subtract VSR's leg from that 97.8-second difference. The two full runs differ by 97.8 s, and VSR's leg is 11.2 s, so ESRGAN's leg is about 109 s. That derivation only holds if every other node is genuinely identical, so I diffed the two workflow JSONs before trusting it: node 16 was the sole difference.
Why did the first hot run take 32.4 s instead of 11.2?
The first time I ran the resend it came back in 32.4 s, not 11.2.
My immediate explanation was that switching the quality level forces a TensorRT engine reload, so the first run after a change pays a one-time model load. That is a completely reasonable story. It fits the symptom, it fits how TensorRT works, and it is wrong.
The execution_cached lists from /history say what actually happened:
run 1 (HIGH)        cached = 1,2,3,4,5,6,7,8,9,10,12,15
run 2 (HB_ULTRA)    cached = 1,2,3,4,5,6,7,8,9,10,11,12,15,18
run 3 (ULTRA)       cached = 1,2,3,4,5,6,7,8,9,10,11,12,15,18
Run 1 is missing nodes 11 and 18. It was a partial cache, so two extra nodes re-executed — no model load involved at any point.
The lesson: read the execution_cached node list; don't reason backwards from wall-clock seconds. Seconds will hand you a plausible story, and a plausible story does not have to be true. I had a mechanism, a justification and a number that agreed with each other, and the only thing that settled it was a list the API had been returning the entire time.
All four quality modes for 55 seconds of GPU time
With the cache trick, sweeping quality modes costs almost nothing — the generation runs once and every mode after that is an 11-second resend.
| Mode | Upscale leg | Output size |
|---|---|---|
HIGH (standard) | 32.4 s ※ | 3.4 MB |
HIGHBITRATE_HIGH | — | 3.6 MB |
HIGHBITRATE_ULTRA | 11.2 s | 3.6 MB |
ULTRA (standard) | 11.2 s | 3.9 MB |
※ partial cache, see above. The real figure is 11.2 s like the others.
The times are effectively identical across modes. There is no speed/quality trade-off here — pick purely on the picture, because the clock does not care which one you choose.
File size works as a proxy for high-frequency content: same frames, same encode settings, so a bigger file means more detail in the picture. Which makes ULTRA the most suspicious of the four at 3.9 MB, given what the resolution sweep showed about where invented detail comes from.
The mode ranking flipped on a 2080 Ti
I ran the same four modes on a 2080 Ti to see whether the ordering held. It did not. There ULTRA came out smallest at 643 KB, against HIGHBITRATE_ULTRA at 703 KB — the exact opposite of the 5090 result.
I have not tracked down why. It could be the TensorRT engine selected for the older architecture, or a different code path in nvidia-vfx, and I have not done the work to say which.
The actionable conclusion survives not knowing: pick the mode on your own machine. The ranking is not a property of the modes.
My prediction was half wrong: the face does not collapse, it goes smooth
Before pulling frames from the 480×270 run, I wrote down what I expected: "the face will collapse."
It does not. Frame 180 shows structure, placement and proportion all intact. Eyes are where eyes go, the jawline is where the jawline goes, nothing is smeared or doubled. What degrades is texture. Skin becomes a smooth even gradient. Hair goes from individual strands to a single block.
So the face-pixel ruler pointed in the right direction and got the failure mode wrong. Not enough pixels does not produce breakage. It produces smooth and empty.
That distinction has a practical consequence, and it is why I am spending a paragraph on a prediction I got wrong. Breakage you spot instantly, in isolation, on the first playback. Smooth-and-empty needs a side-by-side to see at all — on its own it just looks like a slightly soft clip, which is a thing real footage does. So if you are going to push the generation resolution down, do not judge one clip by itself and decide it is fine. Compare it against the tier above.
What transfers to your machine and what does not
Every number in this article is one machine on one day. Some of it travels and some of it does not.
What changes across machines:
- The x86_64 limit on VSR is hard. There is no ARM binary in the wheel, so this is not a performance question and no amount of patience fixes it.
- The quality-mode ranking flips. See the 2080 Ti above. Sweep it yourself; it costs 55 seconds.
- SageAttention's payoff depends on architecture. sm_120 gave 18.8%, sm_121 gave 20.1%, and older architectures are a different story covered in a separate article.
The ratios and the method do transfer: whether the upscale leg is worth measuring at all, how to weigh it separately from everything else, and why HIGHBITRATE is the right family for diffusion output regardless of which member of it wins on your card.
The cache-separation trick is not about upscalers. Any stage of any ComfyUI pipeline can be weighed on its own, as long as you can change that stage's inputs and nothing else — which is most stages, most of the time.
I spent two days on the sampler because the sampler is the part that feels like the engine. The stage that actually made the difference sat at the end of the graph the whole time, costing 109 seconds a run, and the only reason I never fixed it is that I never put a number on it.
FAQ
- How much faster is RTX Video Super Resolution than Real-ESRGAN?
- On an RTX 5090, upscaling 362 frames from 960×540 to 1920×1080 took about 109 seconds with Real-ESRGAN x2plus and 11.2 seconds with RTX Video Super Resolution. That is close to 10× on the upscale leg alone, and it moved the whole pipeline from 411.8 s to 314.0 s.
- Does SageAttention 2.2.0 speed up MiniMax-H3 on an RTX 5090?
- Yes. On sm_120 it cut the same render from 507.0 s to 411.8 s, or 18.8%. A GB10 (sm_121) tested the same day gave 20.1%, so two independent machines agree on the rough size of the win.
- Why does pip install sageattention not give me SageAttention 2.x?
- The newest sageattention package on PyPI is 1.0.6, which is a different generation of the kernel. Version 2.x needs a prebuilt wheel from elsewhere or a build from the thu-ml/SageAttention repository. Installing 1.0.6 by accident is silent: ComfyUI starts fine and the numbers just do not match.
- Why is my ComfyUI 1080p output 1056 pixels tall?
- MiniMax-H3's _empty_av_latent() computes height as height // 16. For 540 that floors to 33 and multiplies back to 528, so a 2× upscale gives 1920×1056. Insert an ImageScale node set to 960×540 with bilinear and crop disabled between the H3 node and the upscaler.
- Which RTX VSR quality mode should I use for diffusion output?
- One of the HIGHBITRATE_* modes. NVIDIA's standard LOW/MEDIUM/HIGH/ULTRA modes are trained on compressed video and actively remove compression artifacts, but diffusion output has none, so those modes can read real texture as artifact. HIGHBITRATE_* skips artifact suppression entirely.
- Can I run RTX Video Super Resolution on an ARM machine?
- No. The nvidia-vfx package ships only manylinux_2_27_x86_64 wheels, so Linux and Windows on x86_64 work and ARM does not. There is no ARM binary in the wheel at all, which makes this a hard limit rather than a performance question.
- Can I generate at a lower resolution and upscale to 1080p instead?
- Down to a point. On this setup 960×540 is the floor: 720×405 barely holds up and 480×270 comes out too soft. The warning sign is counterintuitive — the 480×270 run produced a larger file (7.5 MB against 3.4 MB), because the upscaler invented high-frequency detail the source never contained.
- How do I measure how long a single ComfyUI node takes?
- Run the graph once in full, then resend it with only one parameter changed on the node you want to weigh. ComfyUI's execution cache keys on node inputs, so everything upstream cache-hits and the second run's wall time is that node's cost. Check the execution_cached list in /history to confirm which nodes actually re-ran.
Read next
- 2026-09-13[Benchmark] Roll cheap, then enhance the keeper: NVIDIA's two-stage MiniMax-H3 + LTX-2.5 pipeline explained
NVIDIA's Sol-H3 two-stage recipe on an RTX 5090: MiniMax-H3 drafts at 672×384 in 25.5 s, LTX-2.5 refines only the take you keep. Downloadable ComfyUI workflow.
- 2026-09-11[Benchmark] LTX-2.5 vs MiniMax-H3 on one RTX 5090: 29s vs 81s for the same Chinese dialogue clip
LTX-2.5 and MiniMax-H3 on one RTX 5090, same Simplified Chinese line: 28.67s vs 81.22s end to end, both at CER 0%. Files, params, VRAM ceiling.
- 2026-09-06[Benchmark] Two characters in one shot: MiniMax-H3 Ref2VA takes multiple reference images
Ref2VA is the only MiniMax-H3 mode that takes several reference images. Two characters, 243 frames, 437 s on one RTX 5090, and CER 6.8% on the dialogue.
- 2026-09-03[Benchmark] From OOM to 8.6 minutes: a MiniMax-H3 config stack for one RTX 5090
MiniMax-H3 at native 1344x768 on a single RTX 5090: 15 seconds of video in 518 s. What KJNodes chunking, torch cu130 and the NVFP4 kernels are each worth.
Don't miss the next one
Subscribe, and you won't.
One-click unsubscribe anytime.