改裝 2080 Ti 22G · part 17
[Benchmark] A 177B MoE on Three Modded 2080 Tis: 23 tok/s at 128K, 77 on a File Edit
❯ cat --toc
- What you need: three 22 GB cards, one PR, and one GGUF
- Why 177B fits: 10 experts of 512, and a 51B table you look things up in
- The config to copy: 23.14 tok/s at 128K, and no `-ot` anywhere
- 32K to 128K costs 11.5%. 128K to 262K costs 82.5%
- `--spec-type ngram-mod`: 3.51× on a file edit, 0.17% on prose
- Three quants on one yardstick: the 1-bit is 4.6% faster than the 4-bit
- The capability probe could not tell the three quants apart
- A DGX Spark runs the same model. Single-stream decode is not faster
- Speed here depends on the task, not on the quant tier you picked
- Deep dive: the two batches I threw away, and the full table
- The capability scores I published first were 3/7, 5/7, 4/7 — and every cell was invalid
- `-ngl 45` at 262K reaches READY, answers, and then dies at token 83,968
- 88 G of weights, 62 GB of VRAM, and all 48 layers on the GPU
- The first speed batch was measured on a build 11 commits behind, so I voided all of it
- Short prompts gave me the opposite prefill conclusion, so both sets are void
- Two anomalies on the DGX Spark I did not resolve
- Full context / ngl / KV table
- What I verified before each run
TL;DR
Qwen3.8-Flash-Next is 176.94B parameters and it runs on three modded 2080 Ti 22G cards — 23.14 tok/s at 128K context, no tensor overrides. Turn on --spec-type ngram-mod and a file-edit task jumps from 22.09 to 77.56 tok/s, 3.51×, with 90.3% draft acceptance and byte-identical output. Prose gains 0.17%, which is nothing. It fits because only 10 of 512 experts fire per token and 51B of the weights are an n-gram table you gather from, not a matrix you multiply against. Caveat: the 1-bit quant is only 4.6% faster than the 4-bit one, so the smaller file buys you nothing.
A hardware store with 512 aisles is still a small shop to work in, as long as each job sends you down ten of them. And the fat parts catalogue behind the counter eats half the floor space without slowing anybody down, because nobody does arithmetic with a catalogue. You look things up in it.
That is the shape of Qwen3.8-Flash-Next. Here is the line llama.cpp prints when it loads:
model params = 176.94 B
Three modded 2080 Tis have 66 GB of VRAM between them. Those two numbers look incompatible, and they are not, for reasons that are entirely visible in the file header.
This is Part 17 of the modded-2080-Ti series. Part 12 established that on this card quantization buys VRAM and not time. Part 14 got two cards working together with tensor parallel, and Part 16 fixed the NCCL stub trap that made multi-card runs die on their first request. This part is the payoff: the biggest model I have put on this box, ten independent rounds of measurement, and one result I did not expect.
What you need: three 22 GB cards, one PR, and one GGUF
The architecture is qwen4exp. Support arrived through PR #27742, which merged on 2026-08-27 — it was still open while I was measuring. Every number in this article comes from commit 6c5afc86a of that branch, pinned before the merge.
git clone https://github.com/ggml-org/llama.cpp
cd llama.cpp
git fetch origin pull/27742/head:qwen4exp
git checkout 6c5afc86a

cmake -B build -DGGML_CUDA=ON -DCMAKE_CUDA_ARCHITECTURES=75
cmake --build build -j "$(nproc)"
CMAKE_CUDA_ARCHITECTURES=75 is Turing, which is what a 2080 Ti is.
The box: 3× modded RTX 2080 Ti 22 GiB (66 GB VRAM total), EPYC 7402 24C/48T, 123 GB of system RAM. Weights from unsloth/Qwen3.8-Flash-Next-GGUF — get the UD-IQ4_XS split, which is the one I recommend below.
Why 177B fits: 10 experts of 512, and a 51B table you look things up in
Dump the GGUF header before you plan anything, because it answers the fit question by itself.
| key | value | what it means |
|---|---|---|
expert_count / expert_used_count | 512 / 10 | ~6B parameters actually compute per token |
block_count | 48 | 48 layers to place with -ngl |
ple.layers | 1 | only 1 of 48 layers carries the n-gram table |
context_length | 262144 | the trained ceiling, not the usable one |
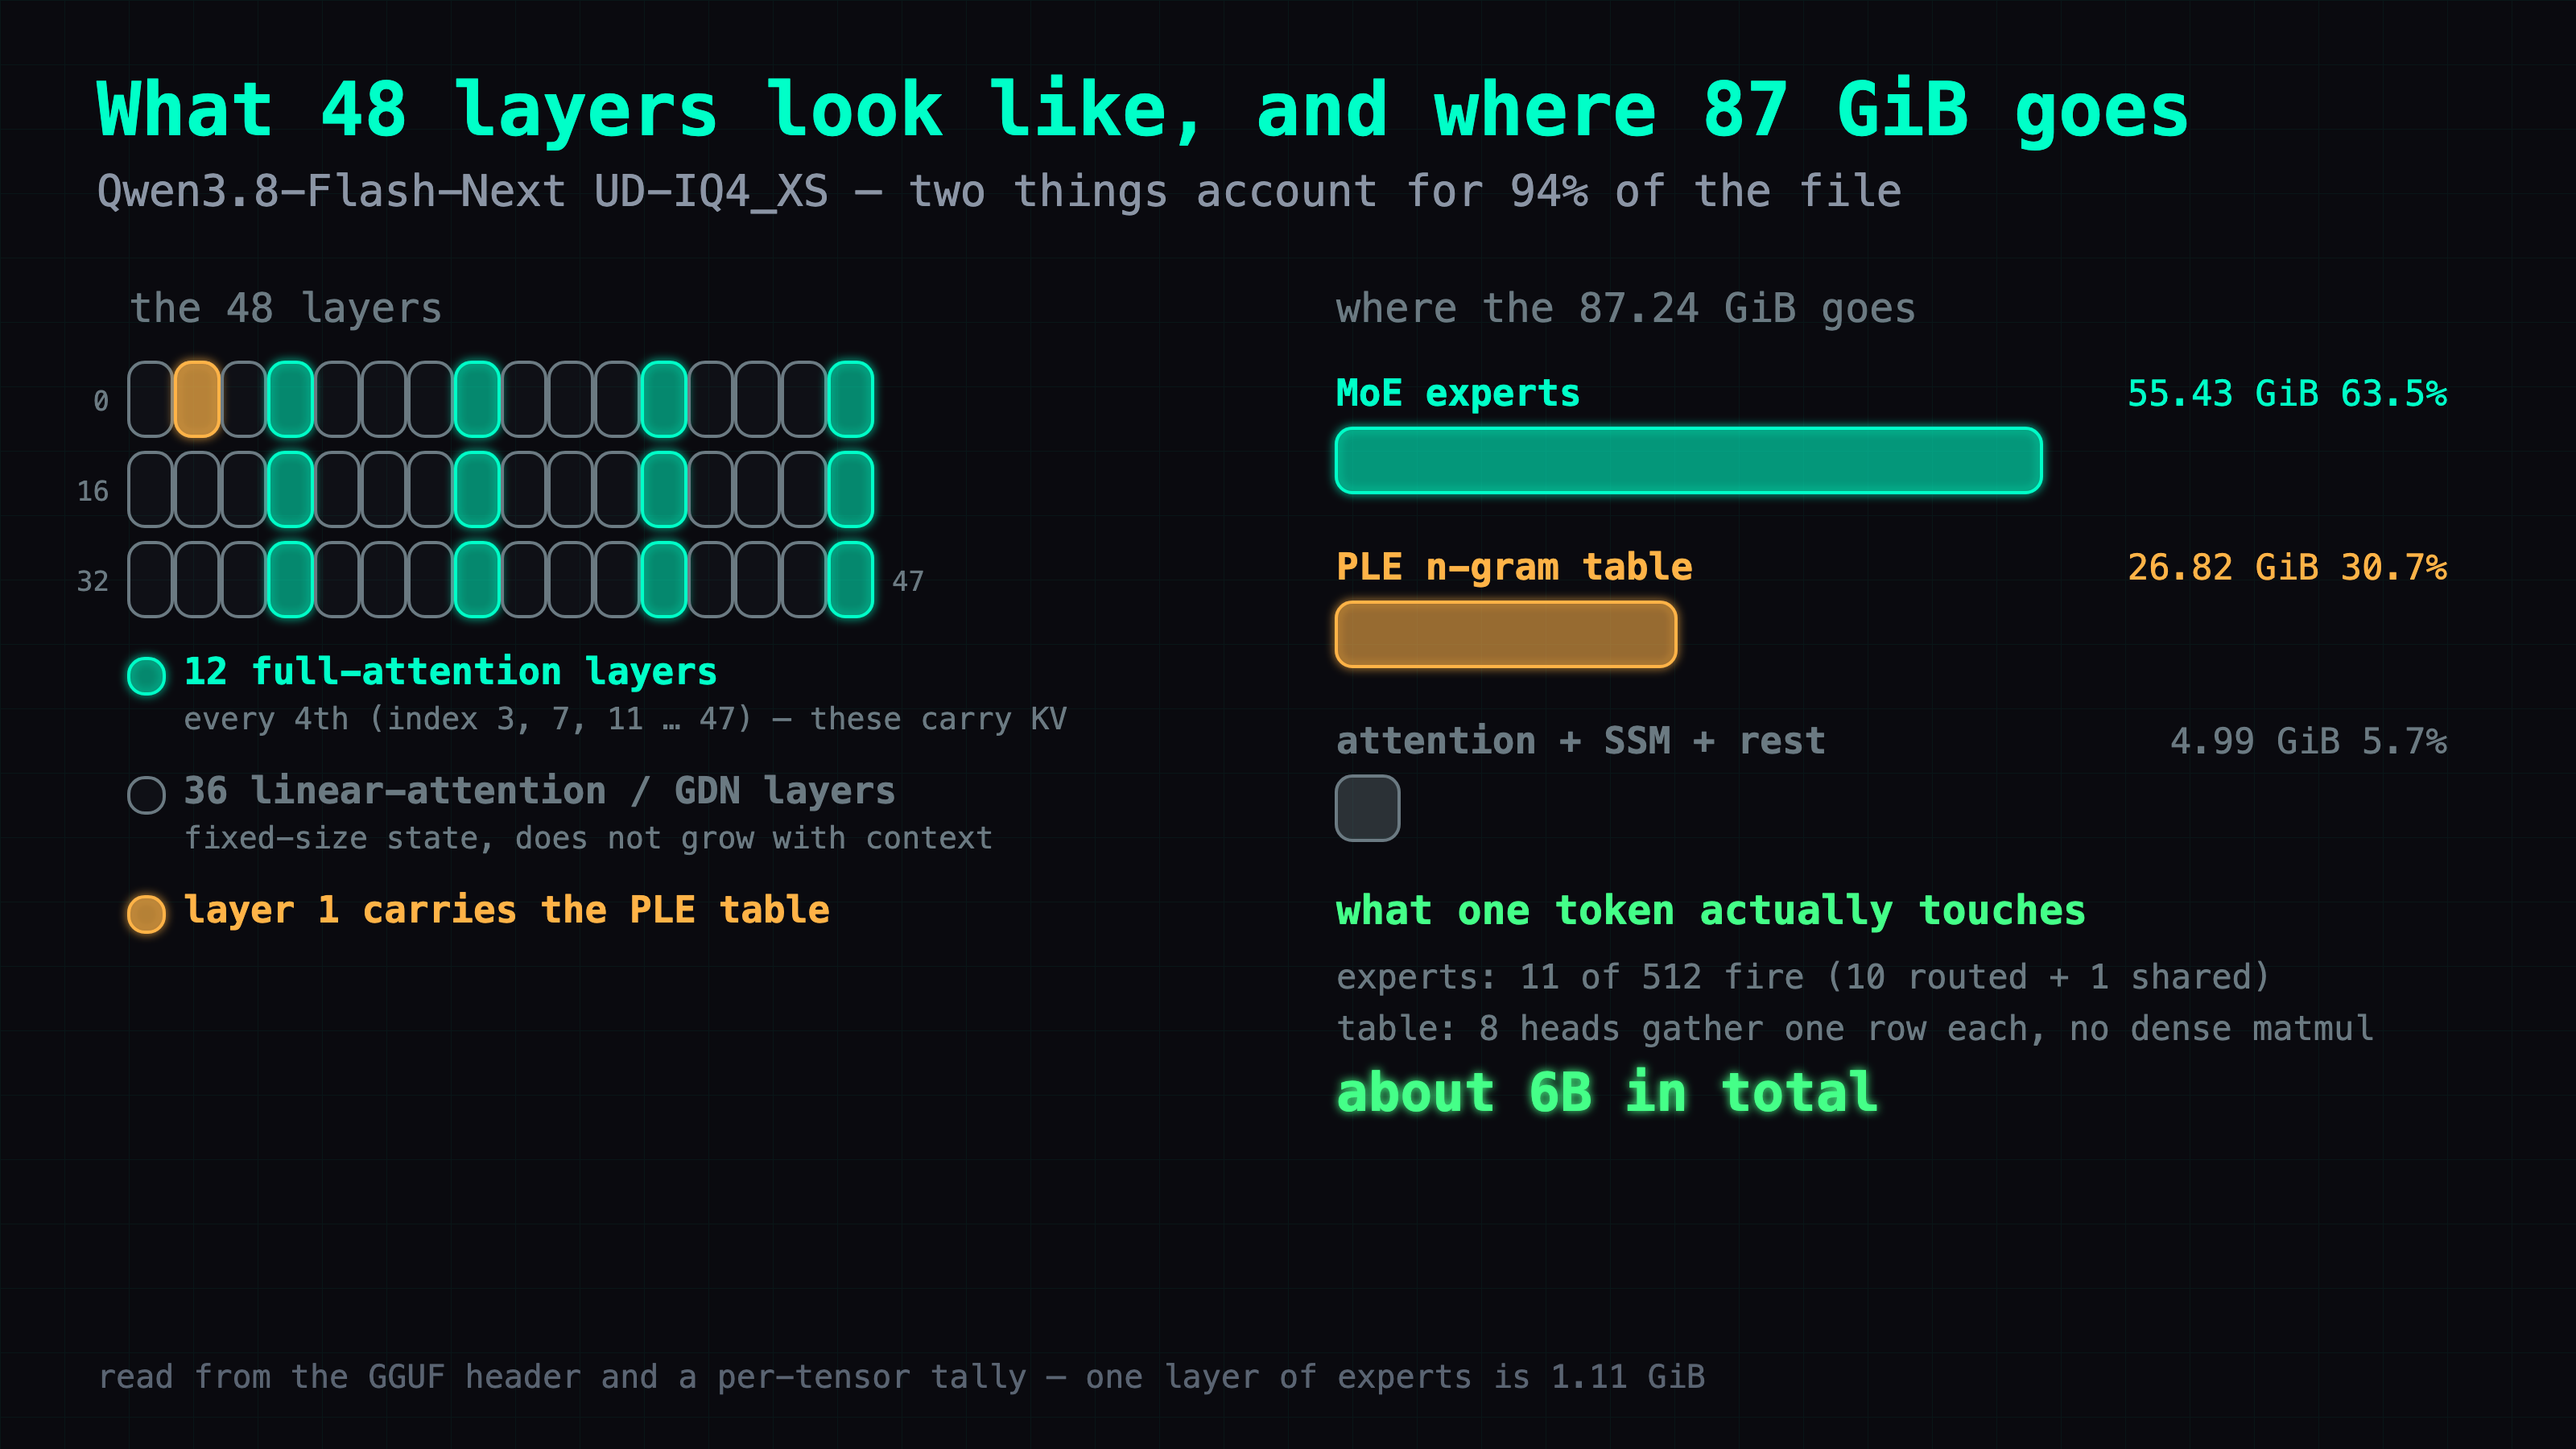
The row to look at is the first one. Ten routed experts out of 512, plus one shared expert, means the model is 177B on disk and roughly 6B in the multiply.
The second thing to look at is ple.layers = 1. With ple.ngram_size = 3 and heads_per_ngram = 8, that block is an n-gram lookup table, and a lookup table is not a weight matrix. The gather is sparse: the rows that come back do get projected and mixed into the hidden state, but what touches the math is those few rows, not the 51B behind them. Because it sits on exactly one layer, "looked up once per token" is literal rather than a figure of speech.
That splits the parameter count into three parts that behave completely differently:
176.94 B  parameters in the GGUF
   ~125 B  backbone: 48 layers × 512 experts, 10 fire per token
             └─ ~6 B  actually multiplied on any given token
    ~51 B  n-gram table (ple.layers = 1): sparse gather, not a dense matmul
       0 B  MTP head: 4 B in the official model card, absent from this GGUF
The official model card says 125B with 6B activated, plus a 51B n-gram embedding and a 4B MTP head — 180B in total. MTP is a small extra head that guesses the next few tokens so the big model can check them in one pass. My GGUF says 176.94B. The missing 4B is that MTP head, dropped at conversion: I scanned all 1,224 tensors in the file and not one of them is a nextn tensor.
So 180B, 176.94B and "6B active" are all correct at the same time. They count different things, and only one of them predicts your speed.
That difference is also what decides where each part lands at runtime:
The config to copy: 23.14 tok/s at 128K, and no -ot anywhere
This is what I run.
llama-server -m Qwen3.8-Flash-Next-UD-IQ4_XS-00001-of-00003.gguf \
  --split-mode layer -np 1 --no-mmap -fa on -t 24 \
  -ngl 46 -c 131072 -ctk q8_0 -ctv q8_0 \
  --spec-type ngram-mod
Four of those flags are load-bearing. So is one that is not in the command at all — the first row below.
| flag | why it is set that way |
|---|---|
no -ot / --override-tensor | zero tensor overrides at 32K, 128K and 262K |
-np 1 | the default opens four slots and roughly halves prefill |
-ctk q8_0 -ctv q8_0 | frees exactly enough VRAM for one more layer |
-ngl 46 | -ngl 47 OOMs at startup here; walk yours down from the top |
Two of those need more than a table cell.
The missing -ot surprised me. All three operating points ran with no tensor overrides. On a 119B MoE last month I spent hours hand-placing expert tensors. Here --split-mode layer plus an -ngl number is the entire placement strategy, and at 32K all 48 layers go on the GPU.
-ctk q8_0 -ctv q8_0 buys a layer, not speed. At 128K with an f16 KV cache the highest -ngl that loads is 45, which gives 22.66 tok/s. Switching the KV cache to 8 bits frees exactly enough VRAM for one more layer: -ngl 46, 23.14 tok/s. One layer, 2.1%.
On -np 1: prefill is the phase where the model reads your prompt before it writes anything, and four parallel slots split that budget four ways. If you are one person at one terminal, say so.
32K to 128K costs 11.5%. 128K to 262K costs 82.5%
Three operating points, each at the highest -ngl that actually loads. Look at the decode column and how it falls off a cliff between rows two and three.
| context | -ngl | KV cache | decode | VRAM used |
|---|---|---|---|---|
| 32,768 | 48 | f16 | 26.16 tok/s | 62,720 MiB |
| 131,072 | 46 | q8_0 | 23.14 tok/s | 61,942 MiB |
| 262,144 | 40 | q8_0, -ub 512 | 4.05 tok/s | 57,044 MiB |
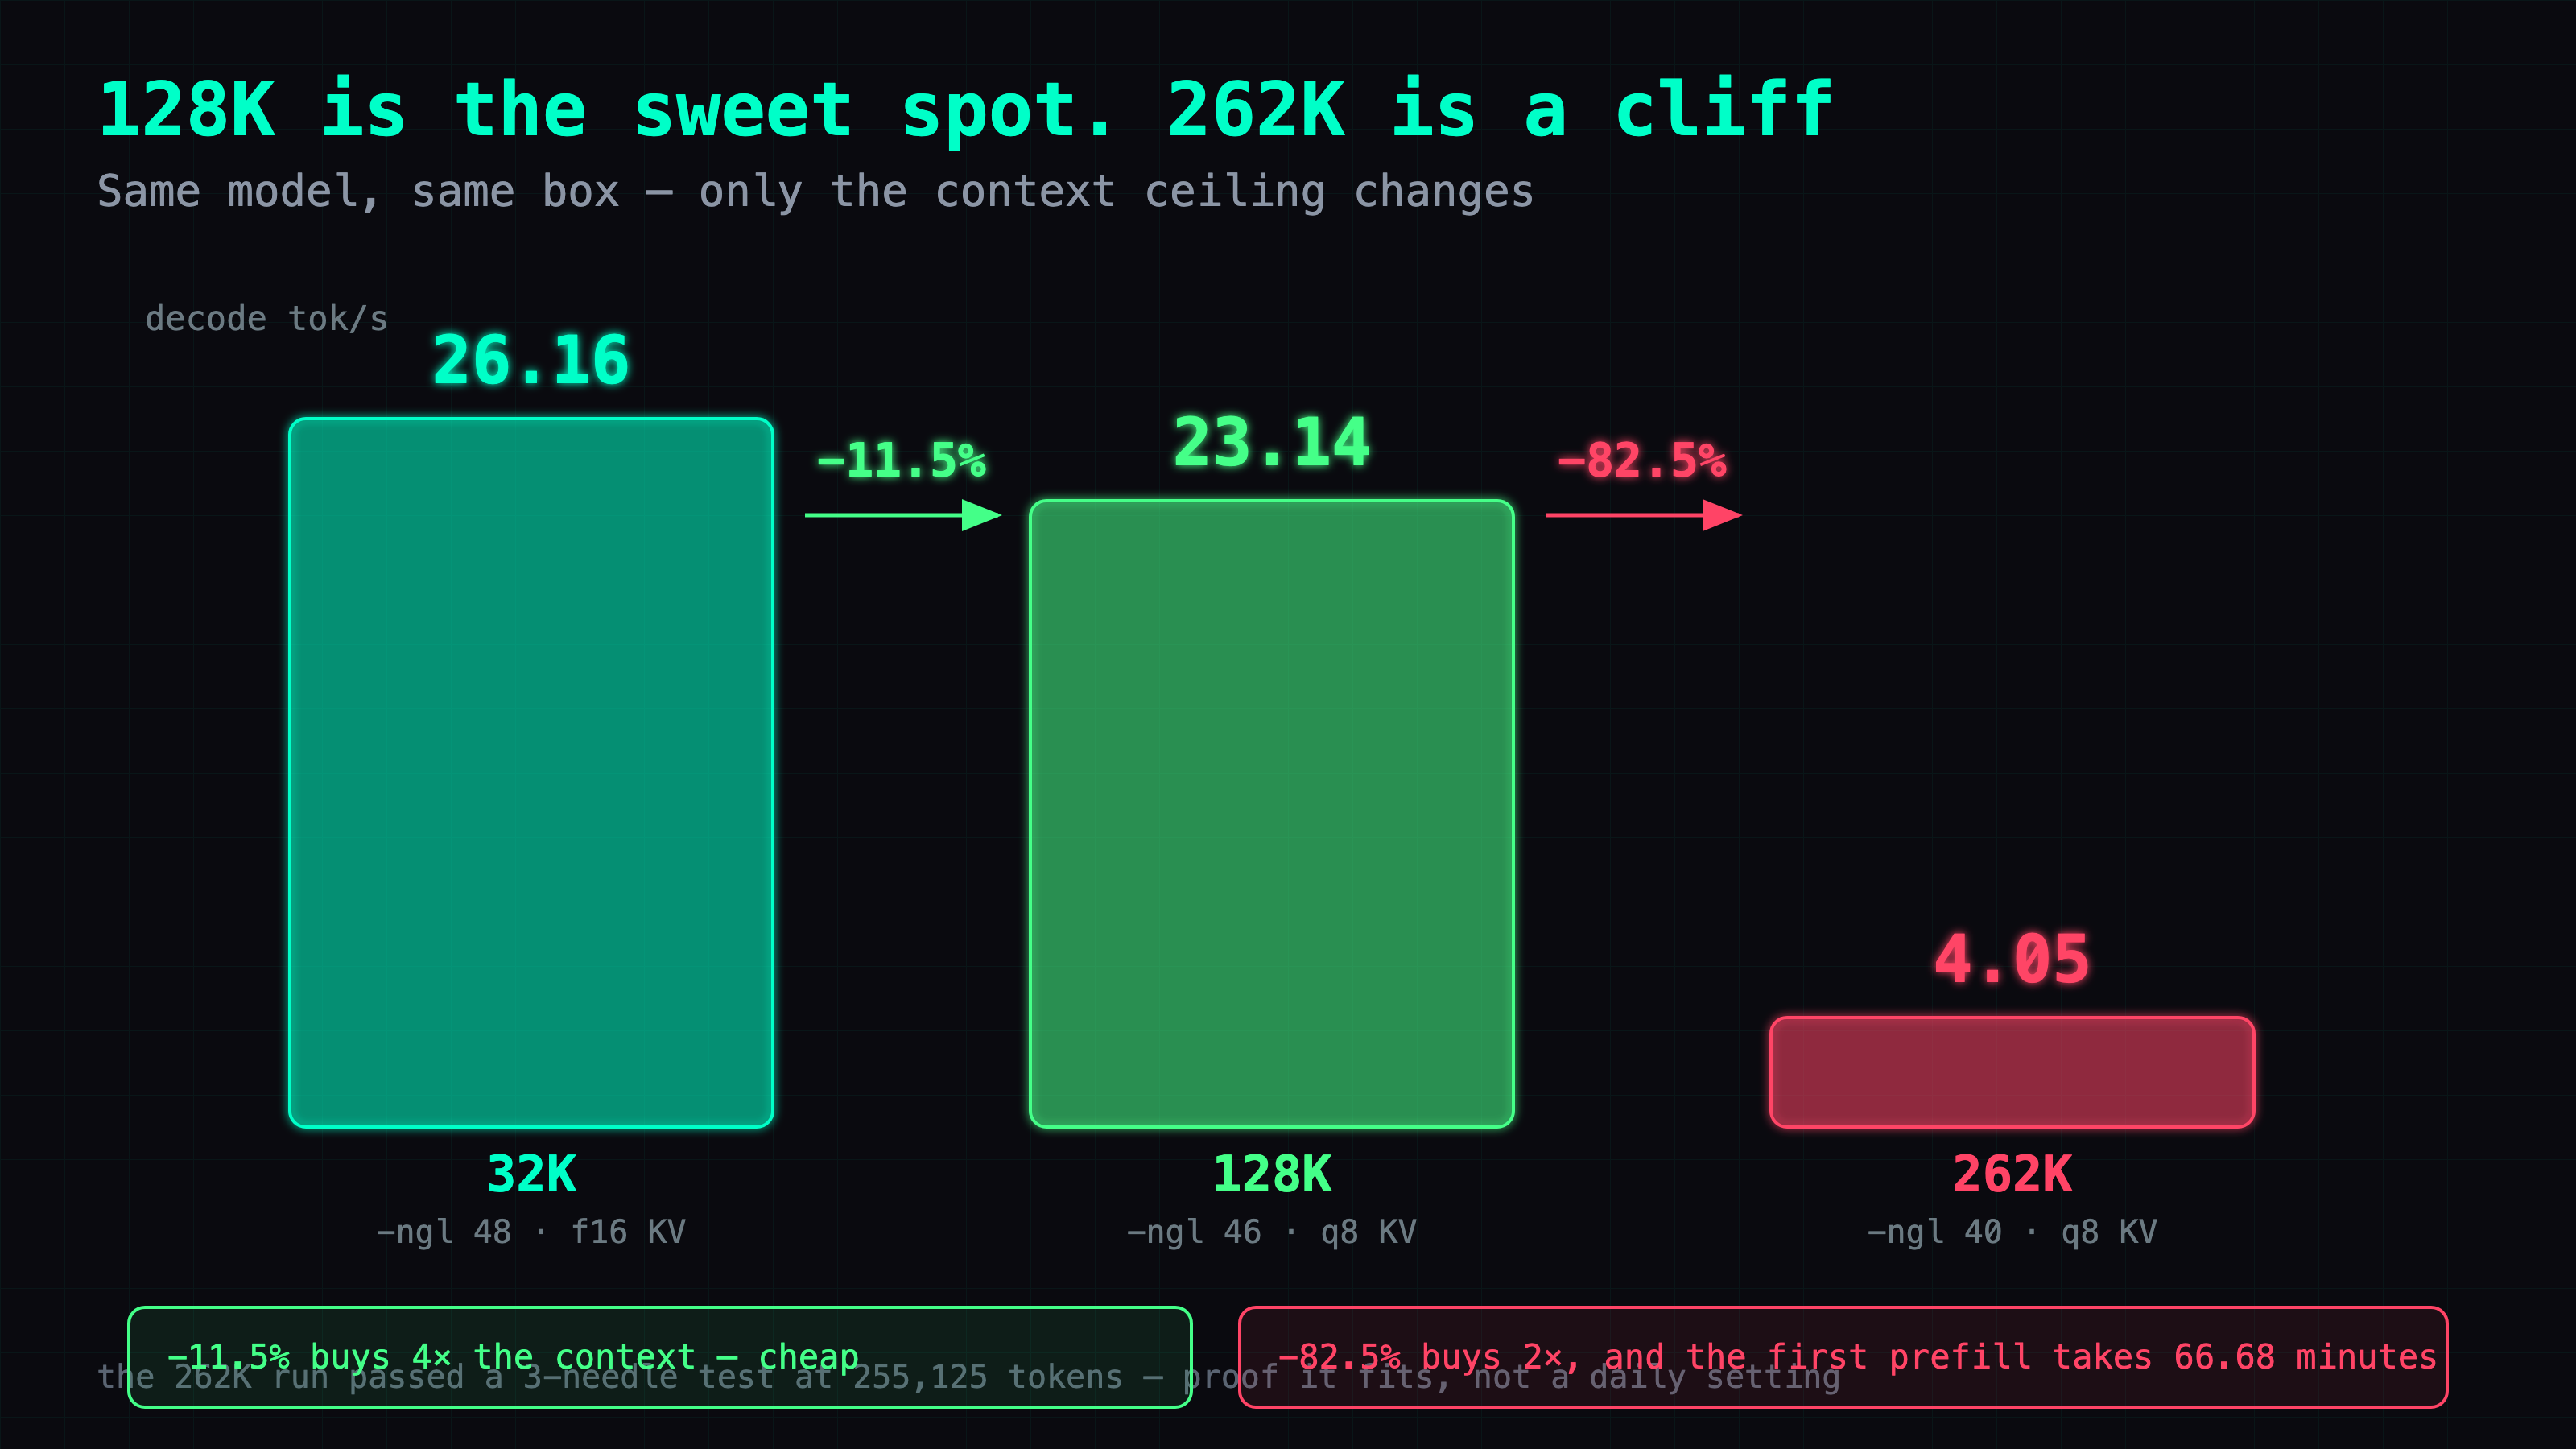
Four times the context costs 11.5%. The next doubling costs 82.5%. The reason is in the -ngl column: 262K needs so much KV cache that eight layers get evicted to the CPU, and eight layers on an EPYC's RAM is what 4 tok/s looks like.
The 262K row still does real work. Its first prefill chewed through 255,125 tokens in 66.68 minutes — 63.77 tok/s. And the context is genuinely there: a needle test, which means hiding facts at known depths and asking for them back, put three distinct facts at roughly 10%, 50% and 90% depth. All three came back.
66.68 minutes to read the prompt, then 4.05 tok/s to answer it. The context works. Sitting in front of it does not.
If you want long context on this hardware, 128K is the operating point. That mirrors what Part 3 found on a 27B at a totally different scale — including the failure mode, which shows up again below.
--spec-type ngram-mod: 3.51× on a file edit, 0.17% on prose
This is the finding I did not see coming.
Speculative decoding normally means running a second, smaller model to draft tokens that the big model then verifies. --spec-type ngram-mod needs no second model at all. It drafts from repetition already present in your context: if a chunk of text is about to appear again, it guesses that chunk and lets the target model check it.
Two tasks, both cold, both at the recommended config. Look at the right-hand column.
| task | speculation off | speculation on | |
|---|---|---|---|
| prose generation | 22.98 tok/s | 23.02 tok/s | +0.17%, i.e. nothing |
| file edit | 22.09 tok/s | 77.56 tok/s | 3.51×, 90.3% accepted |
On prose, llama.cpp did not even emit a draft line. There was nothing to guess.
The file-edit task is deliberately the most ordinary thing an agent does all day: paste a 130-line Python file (upstream conversion/llava.py), ask for the whole file back with one class renamed. Almost every output token already exists in the input, so 90.3% of the drafted tokens survive verification.
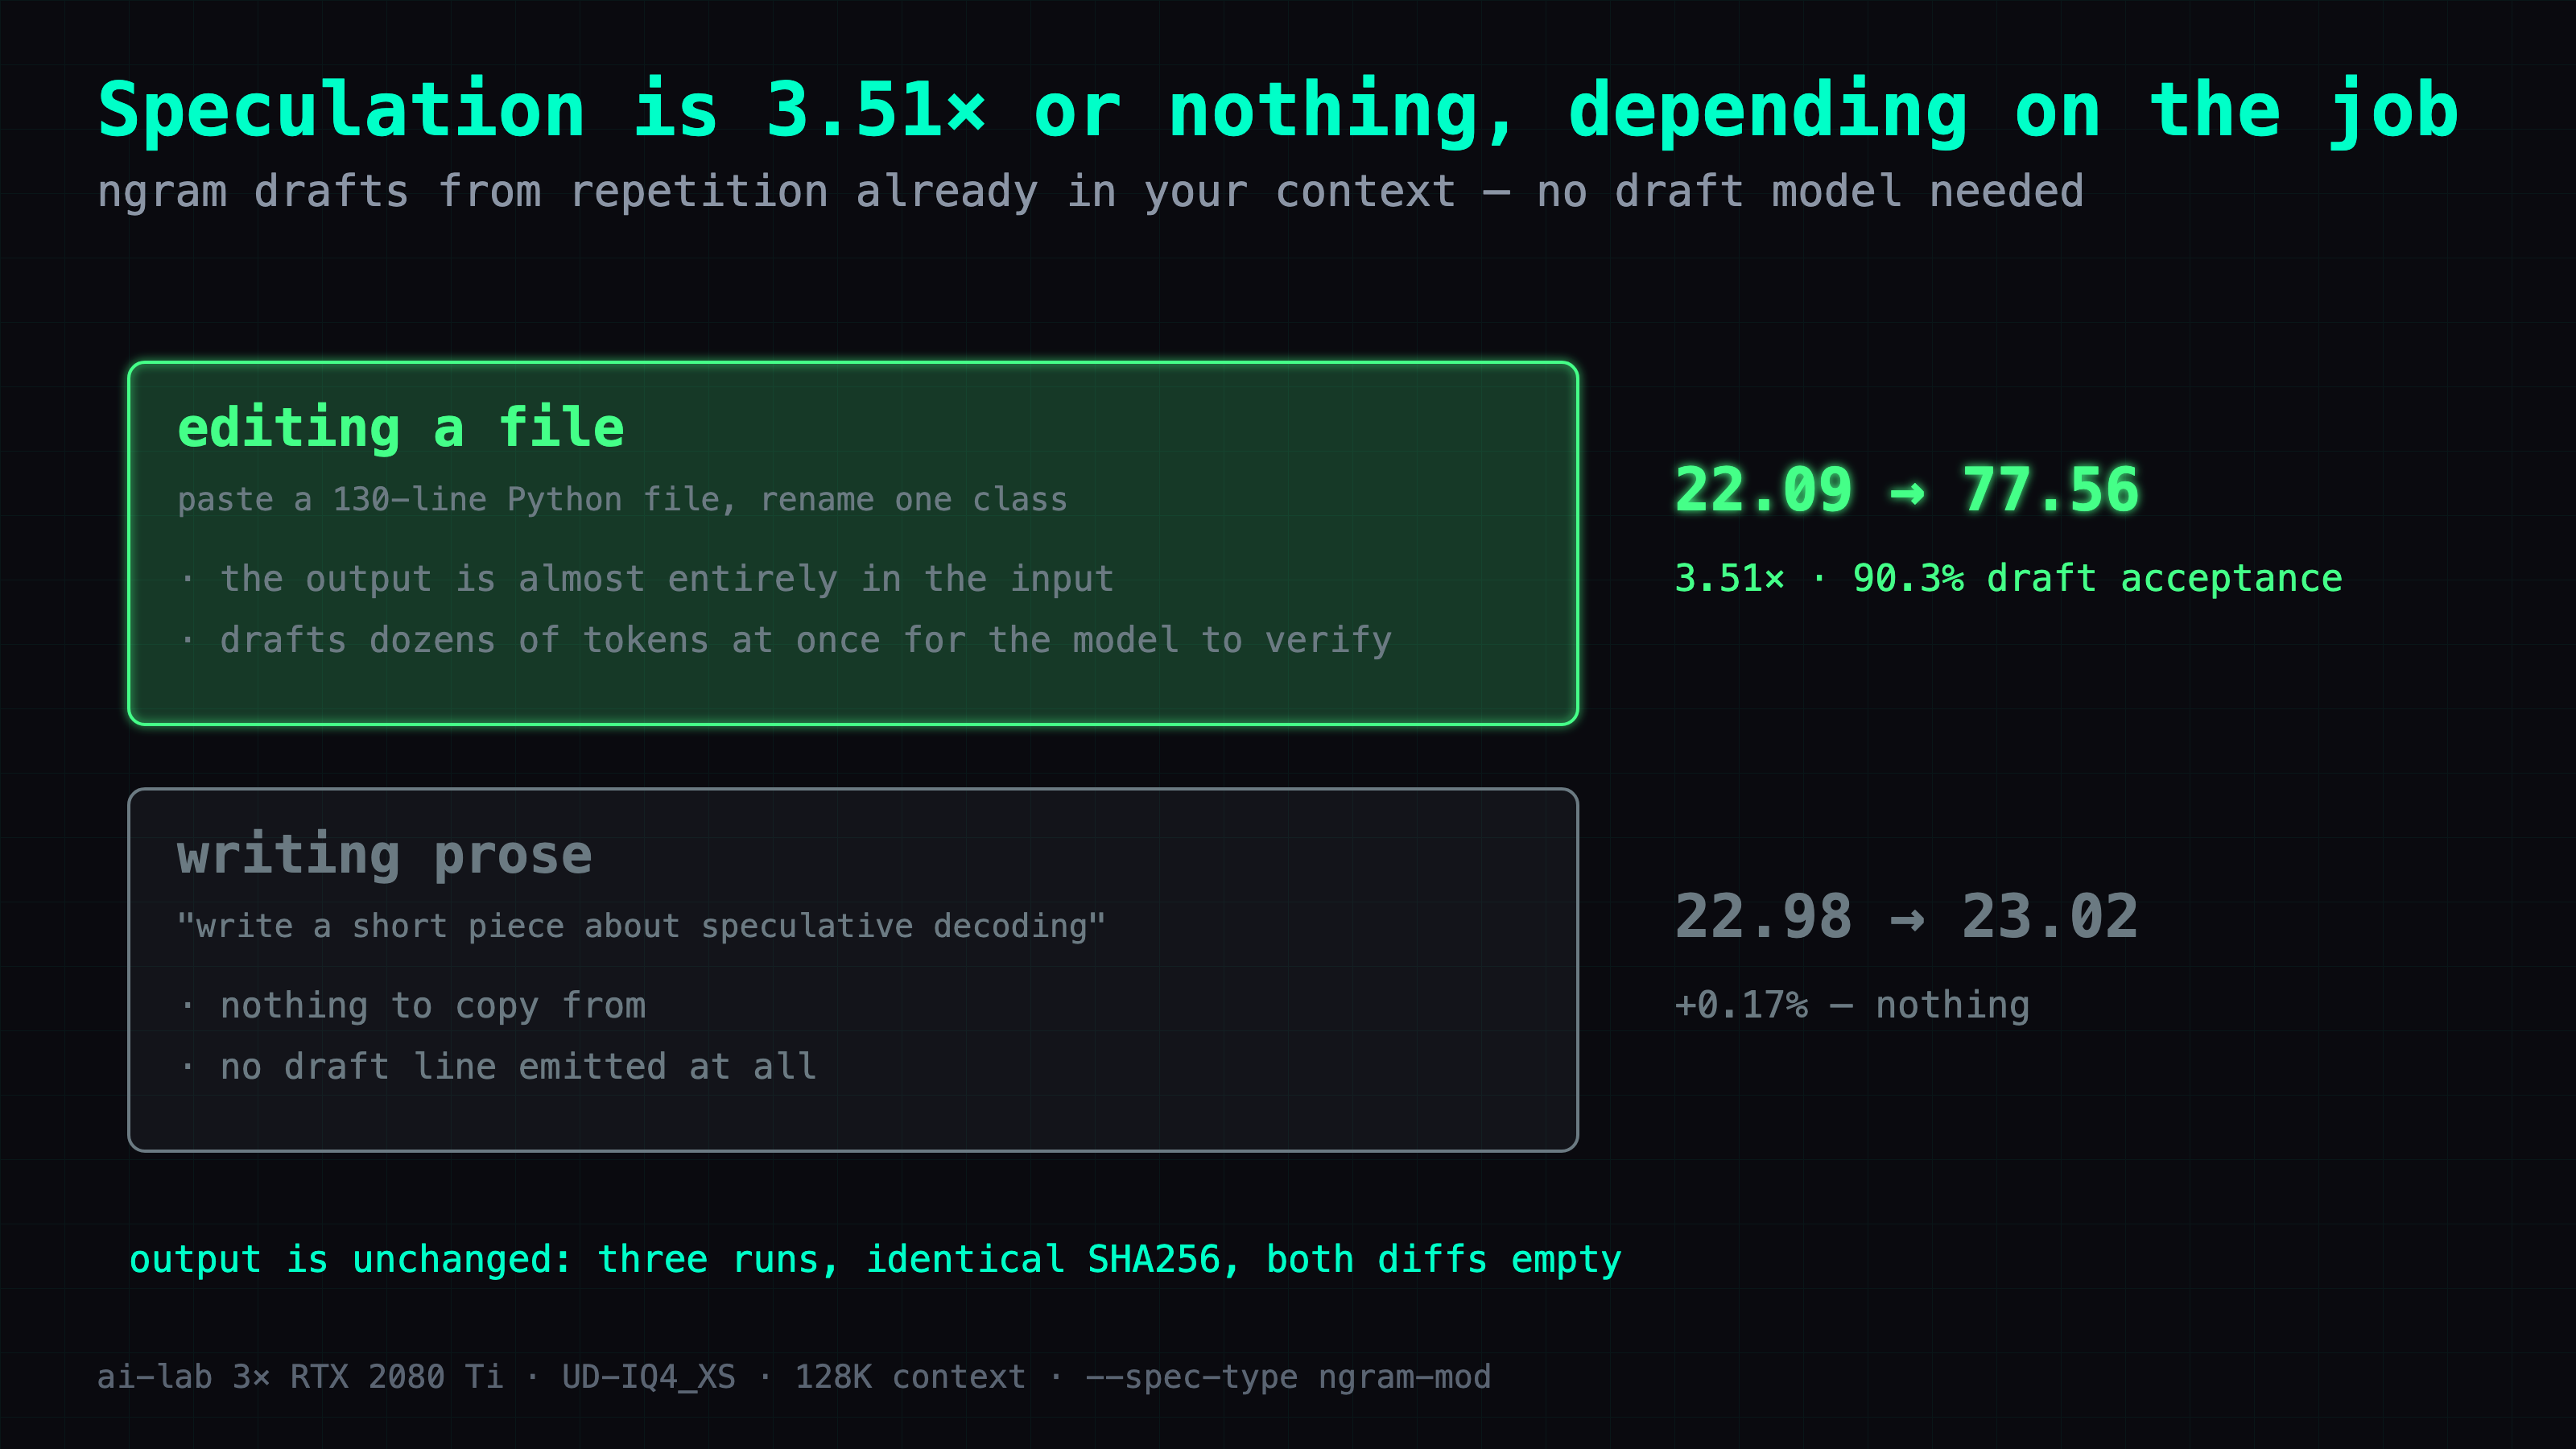
This is not a quality tradeoff. Speculation here is exact — the target model verifies each drafted token, so a draft it would not have produced itself gets thrown away. I ran the speculative version three times and got three SHA256-identical outputs, and both diffs against the non-speculative run were empty.
Cite the cold number, 77.56, not a repeat. Repeats at 128K came in at 67.14 and then 65.42, as draft acceptance slid from 90.3% to 79.3%. The longer the context, the more candidate repetitions there are to guess wrong about.
Three quants on one yardstick: the 1-bit is 4.6% faster than the 4-bit
Same binary, same flags, same 8,121-token prompt. max ngl is the highest layer count that loads.
| quant | size | max ngl | decode | prefill | context verified |
|---|---|---|---|---|---|
| UD-IQ1_S | 68 G | 48 | 26.74 tok/s | 533.08 tok/s | 262,144, needle 3/3 |
| UD-IQ4_XS | 88 G | 48 | 25.56 tok/s | 529.02 tok/s | 262,144, needle 3/3 |
| UD-Q4_K_XL | 104 G | 36 | 16.02 tok/s | 329.52 tok/s | 131,072, needle 3/3 |
Compare rows one and two. The 1-bit quant is 4.6% faster than the 4-bit quant, and that is the whole return on 20 GB of saved space. Both fit entirely in VRAM at -ngl 48, so once everything is already on the GPU, having more room left over does not make anything go faster. That is Part 12's conclusion — quantization buys VRAM, not time — holding at 177B.
Row three is where quant tier does matter, and it matters for one reason: 104 G does not fit in 66 GB. Only 36 of 48 layers land on the GPU, twelve run on the EPYC, and decode comes out 37% below the IQ4_XS row.
Row one used to have a blank cell. It is filled now: IQ1_S runs at 262,144 with -ngl 44, q8 KV and -ub 512, and answers all three needles at 255,207 tokens.
The blank came from my own client, not from the model. The 255K probe was killed by a 3,600-second timeout at 247,850 tokens, 97% of the way in. Raising the timeout to 10,800 seconds was the entire fix. The full prefill takes 64.27 minutes at 66.18 tok/s and decode at full context settles at 4.61 tok/s, so this is a proof that the context works rather than a setting to sit in. I did not try ngl 43 or lower, so 44 is a value that works, not a measured ceiling.
Filling that cell also puts a boundary on the claim above. On an 8,121-token prompt the 1-bit quant is only 4.6% faster. At a full 262,144 it fits 44 layers and decodes at 4.61, while IQ4_XS fits 40 and decodes at 4.05 — 13.8% faster. The 20 GB was always saved; it only converts into speed once context has made VRAM the scarce thing.
The capability probe could not tell the three quants apart
I wrote seven questions designed to expose low-bit degradation, expecting the 1-bit quant to visibly fall over. All three quants scored 6/7. The probe cannot separate them, and reporting that is more useful than quietly dropping it.
The column worth looking at is the one where nothing varies.
| quant | score | the failure |
|---|---|---|
| UD-IQ1_S | 6/7 | Q6 |
| UD-IQ4_XS | 6/7 | Q6 |
| UD-Q4_K_XL | 6/7 | Q6 |
All three failed the same question, and the problem was my grading rubric, not the models. Q6 asked for code: the code compiled, passed every assert I wrote, and came in at 38 non-blank lines against a criterion that demanded 40 to 60. That is a length check I wrote badly, failing a correct answer three times.
What this does not tell you is that low-bit quantization is free. It tells you that seven questions of mine cannot detect the difference — a null result on a probe, not a finding about the model. The first version of this table did show a clean degradation curve, and it was an artifact of my own harness. That story is in the deep dive.
A DGX Spark runs the same model. Single-stream decode is not faster
The DGX Spark is worth comparing because its 121 GB unified-memory pool sits at the opposite end of the design space: one pool, and no quant-tier-versus-context tradeoff at all. It runs the larger UD-Q4_K_XL, loads the full 262,144 context directly in 4m40s, and sits at roughly 104 GB resident.
| 3× 2080 Ti, UD-IQ4_XS | DGX Spark GB10, UD-Q4_K_XL | |
|---|---|---|
| prose, cold | 23.02 tok/s | 20.51 tok/s |
| file edit, cold | 77.56 tok/s | 76.65 tok/s |
| file edit, repeats | 67.14 / 65.42 | 88.02 / 78.74 |
| max context | 131,072 at this quant | 262,144, loaded directly |
The row that matters is the second one: 77.56 against 76.65 is a tie. Different quants and different prompt lengths sit behind these columns — the Spark's prefill of 366.19 tok/s was measured on an 18,092-token prompt against the 2080 Ti box's 8,121 — so treat the table as two boxes doing the same job, not as a controlled head-to-head.
What the Spark buys is the absence of a tradeoff. It holds 104 G of weights and a 262K context in the same pool, and I never had to choose. What it does not buy is single-stream decode speed. Three secondhand cards match it.
Two things on the Spark I cannot explain, and they are in the deep dive rather than hidden: it went unreachable for about three minutes during load, and one of its three file-edit outputs came back without its Markdown code fence — which speculation is not supposed to be able to do.
Speed here depends on the task, not on the quant tier you picked
Line up the three big numbers from this box. The same model, the same cards, the same week.
| decode | |
|---|---|
| prose, 128K | 23.02 tok/s |
| file edit, speculation on | 77.56 tok/s |
| 262K, eight layers on the CPU | 4.05 tok/s |
That is a 19× spread with the weights never changing. Meanwhile the entire distance between a 1-bit quant and a 4-bit quant is 4.6%.
I spent most of a week picking quants, and the quant was the least important decision in the whole exercise. What the model is being asked to do — write prose, edit a file it can see, or reach across a quarter-million tokens — moves the number by an order of magnitude. Choose the operating point for the task first. The quant tier only starts mattering again at the moment it decides how many layers fit on the card.
Deep dive: the two batches I threw away, and the full table
You can skip this section and still reproduce everything above. What follows is the measurement log and the complete dataset. What follows is the measurement log — the failures, the numbers I voided, and the full data at no row limit.
The capability scores I published first were 3/7, 5/7, 4/7 — and every cell was invalid
The first capability batch produced a beautiful result. IQ1_S 3/7, IQ4_XS 5/7, Q4_K_XL 4/7 — degradation visible, monotonic in the direction I expected, exactly the story I had set out to tell.
I expected to spend the next hour writing that up. Instead I did the thing I do when a result agrees with me too well, which is open the raw responses before believing them. What I expected to find was ordinary wrong answers: a bad algorithm, a hallucinated API.
What I found was this, on cell after cell:
finish_reason = length
completion_tokens = 512
content_len = 0
The model had spent its entire token budget inside a thinking block and emitted zero characters of actual answer. My judge saw an empty string, called it wrong, and scored it FAIL. Every single one of those 21 cells was scoring "did not answer" as "answered incorrectly".
Three fixes, all of them to my harness:
max_tokensfrom 512 to 4096.- Thinking off through the request field, not the prompt:
"chat_template_kwargs": {"enable_thinking": false}. - A three-state judge — PASS, FAIL, and INVALID, where INVALID is excluded from the denominator instead of counted as a failure.
After the rerun all 21 cells were valid, and the scores came out 6/7 across the board. The clean degradation curve evaporated.
My original expectation was wrong at a level below the one I was checking. I had assumed a wrong answer and a missing answer are different enough that I would notice, so I only ever validated the scoring rule. Both arrive at a judge as a string that is not the right answer. The distinction that matters — did the model answer badly, or did it never get to answer — lives in finish_reason and completion_tokens, and my harness was not looking at either. A judge with only two states cannot report "this cell is broken", so it silently reports "the model is bad" instead, and the shape it produces is a degradation curve.
One useful takeaway. /no_think in the prompt is not reliable on its own. The old batch still produced 221 characters of reasoning_content with it in place. With the request-level enable_thinking: false, all 21 requests came back with a reasoning length of exactly 0.
-ngl 45 at 262K reaches READY, answers, and then dies at token 83,968
At 262K I started from the top and walked -ngl down until the server loaded. It loaded at 45. It printed READY, answered short requests correctly, and looked completely healthy.
My expectation, and I want to be precise about it because it is the wrong one: I believed that if the KV cache is allocated at startup for the full declared context, then a server that reaches READY at -c 262144 has already reserved everything it will ever need. Loading is the hard part; after that you are just doing arithmetic.
So I fed it the real 255K prompt. It died partway through:
CUDA1 needs another 1245.72 MiB
At token 83,968. Not at load, not at 262,144 — a third of the way in, needing 1.2 GB that nothing had reserved. Dropping to -ngl 40 fixed it and cost 82.5% of decode, which is the 4.05 tok/s row.
The reflection is that "loads successfully" and "finishes the job" are different claims, and I keep having to relearn it. Part 3 hit this exact shape on a 27B — max the context, watch it load, watch it crash a few turns into real use. I assumed that lesson was about that model, or about that generation of llama.cpp. It is about the sizing method. Any headroom you did not watch get consumed is headroom you have not proven exists.
Q4_K_XL does the same thing one notch up: -ngl 37 reaches READY and then runtime-OOMs on long prompts. That is why the table above lists its max as 36.
88 G of weights, 62 GB of VRAM, and all 48 layers on the GPU
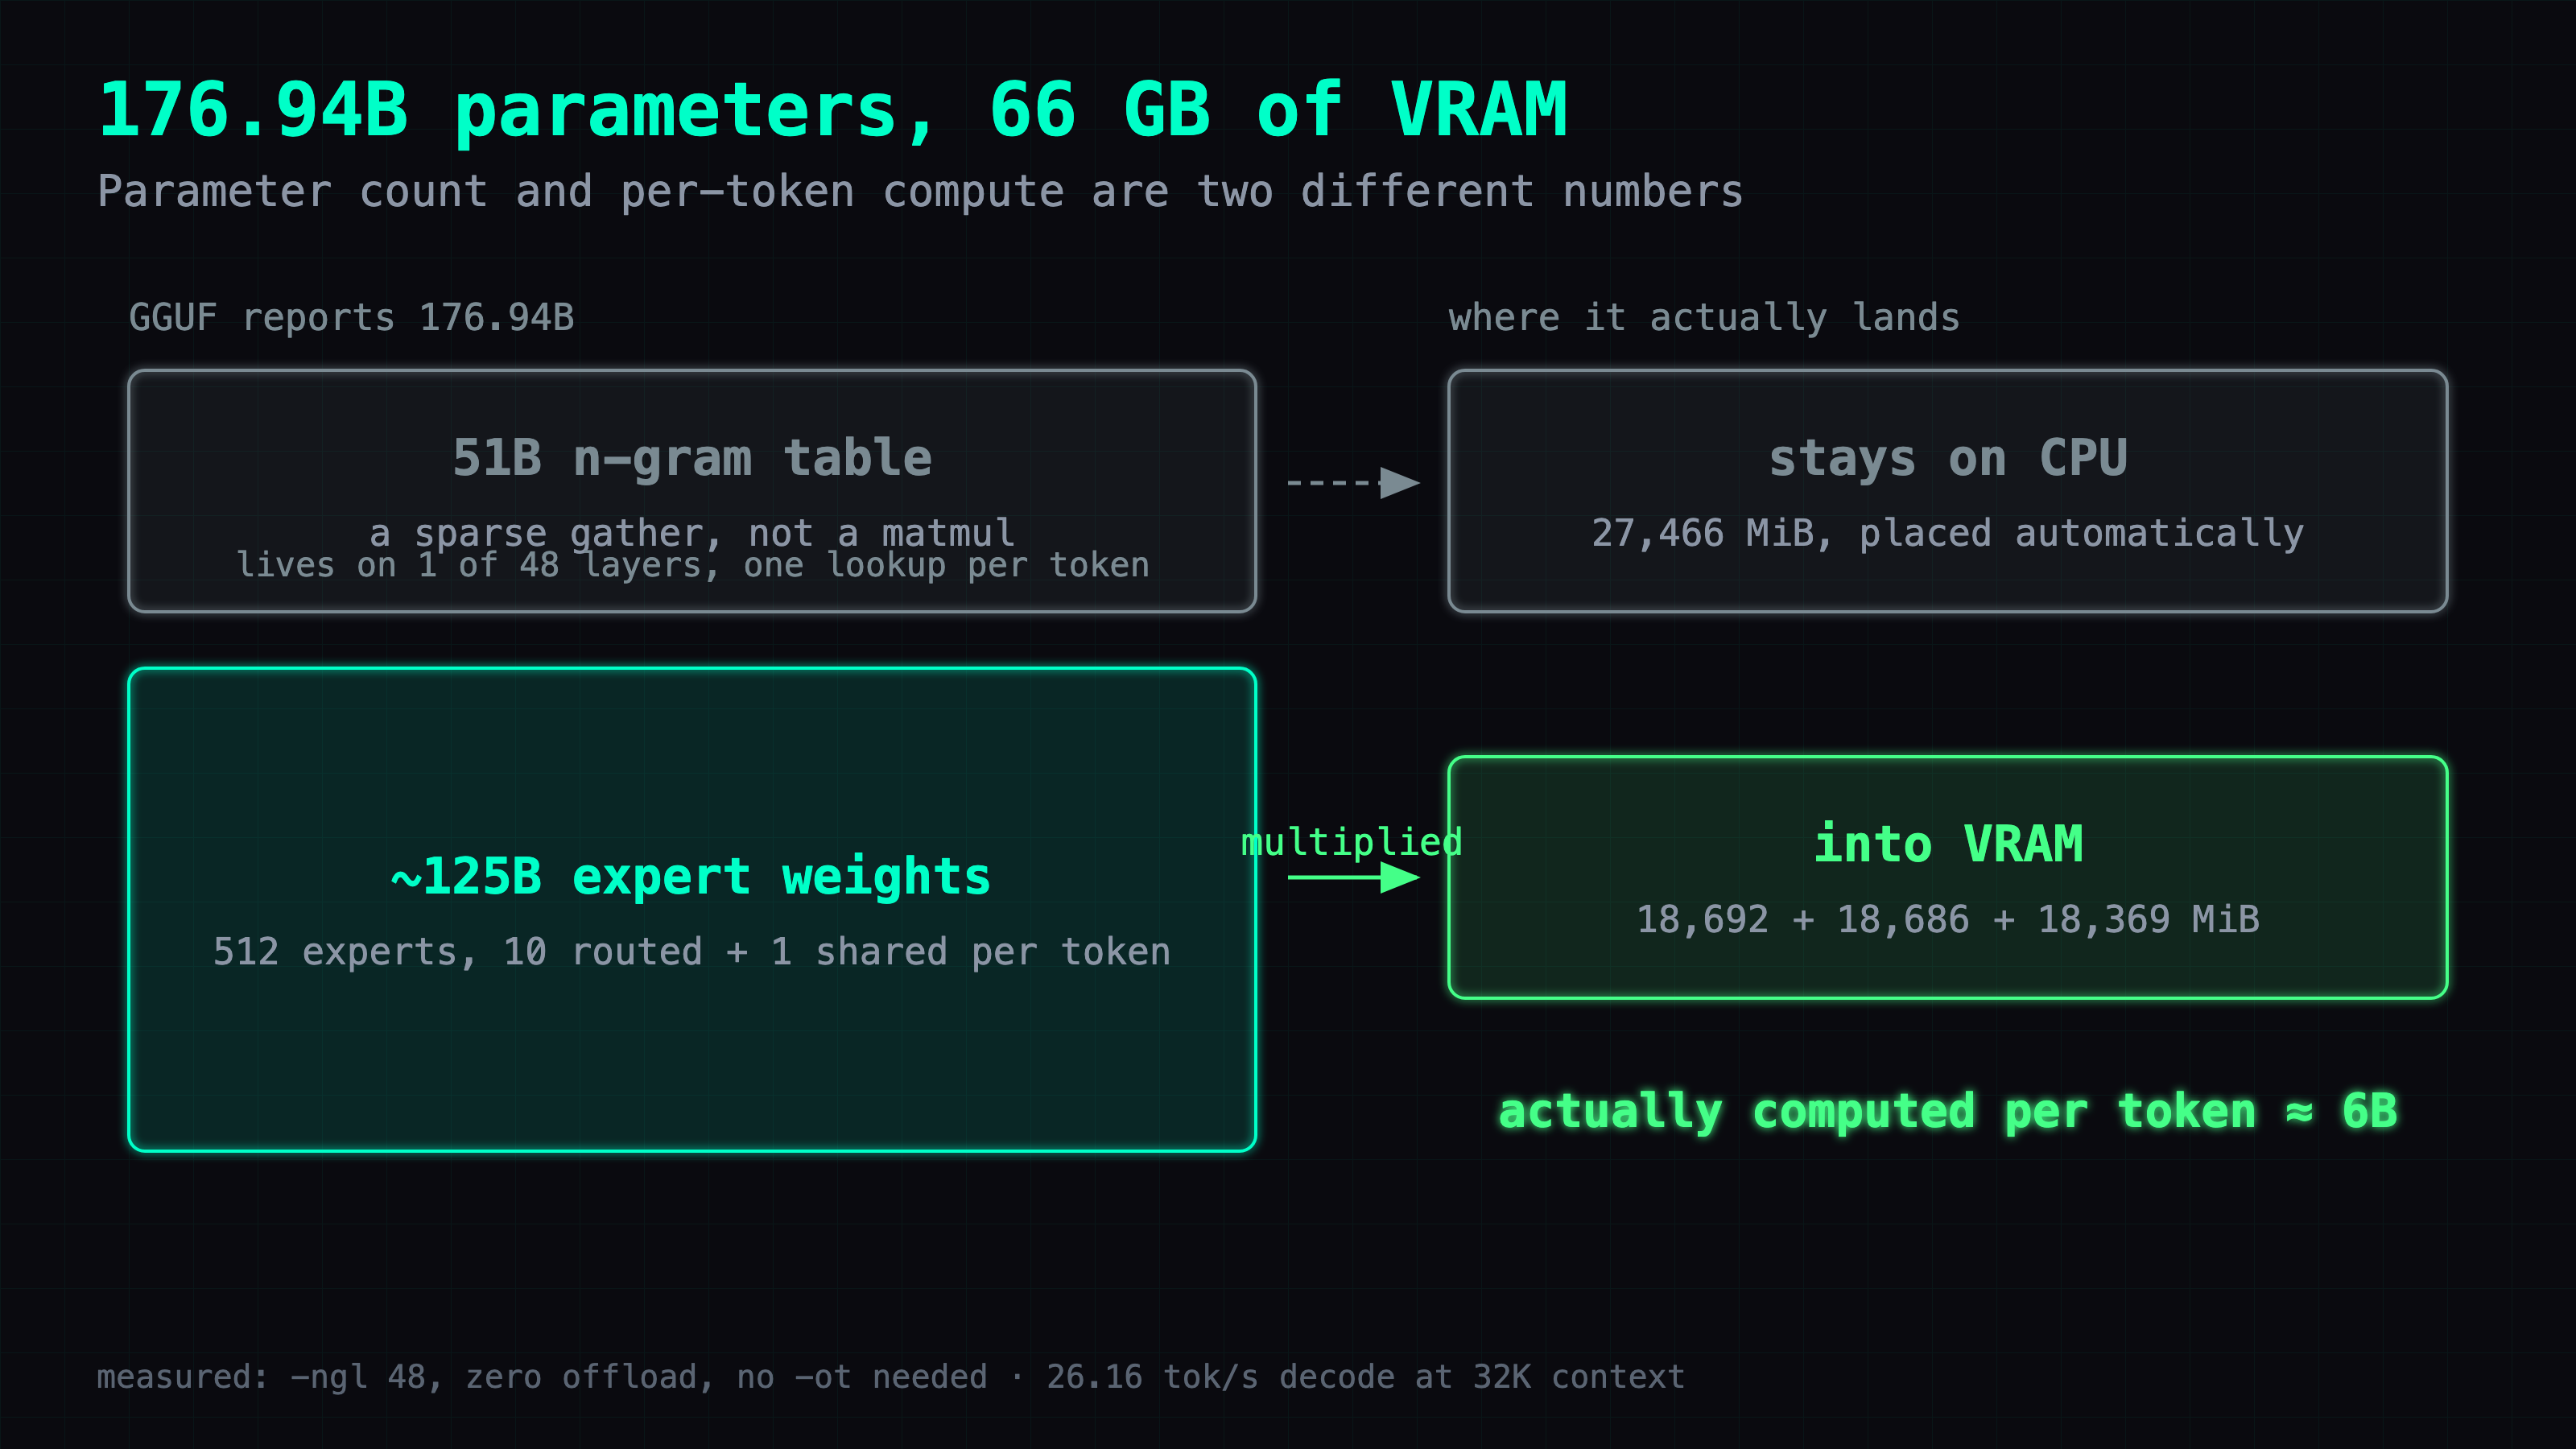
The IQ4_XS file is 88 G. The box has 66 GB of VRAM. I expected -ngl 48 to fail immediately, and planned to spend the evening hand-placing expert tensors with -ot the way I did on the 119B.
It loaded. -ngl 48 at 32K, all 48 layers on the GPU, 62,720 MiB resident across three cards. No overrides.
I did not chase this down tensor by tensor, so what follows is inference and I am labelling it as such: the gap between the 88 G on disk and the 62,720 MiB resident is roughly what a 51B table costs at this quant, and the header says that table lives on one layer. Plausible. Not confirmed.
What I got wrong was more basic than the mechanism. I was treating -ngl 48 as "all the bytes are on the GPU" when it means "all 48 blocks are on the GPU", and I had just finished reading a header that told me one of those blocks is a lookup table rather than a stack of weight matrices. Layer count and file size measure different things in this architecture. I read the header, understood it, and then sized the run as if I had not.
The first speed batch was measured on a build 11 commits behind, so I voided all of it
The first full speed sweep looked fine. Numbers in a plausible range, consistent across repeats, nothing anomalous.
Then I checked what I had actually built. The branch had moved 11 commits since my checkout, on an architecture whose support is still an open PR — which means those commits are exactly the ones fixing how this model runs.
I expected the rebuild to move things by a rounding error, keep the old numbers as a sanity check, and get on with it. Instead I threw the whole batch away without comparing, and reran everything on 6c5afc86a. Every number in this article comes from that commit.
Looking back at that expectation: what would a comparison have been worth? My instinct was to diff old against new and report the delta as a finding. But the delta between two arbitrary points on a moving branch is not a property of anything — it is not the model, not the hardware, not even a release. It is the state of somebody's branch on a Tuesday. Voiding beats reporting when the independent variable is not a variable anyone can look up.
That is the same call I made on the capability batch. Both times the numbers were tooling artifacts, not properties of the thing under measurement.
Short prompts gave me the opposite prefill conclusion, so both sets are void
Early rounds recorded prefill on whatever prompt was handy — 43 to 81 tokens. I treated those numbers as real and drew a conclusion about which configuration prefills faster.
Then a later round, on a proper 8,121-token prompt, ranked the configurations the other way round.
I expected short-prompt prefill to be noisy. Noise averages out and you top up repetitions until the spread closes. What I got was not noise. It was bias: at 43 tokens, fixed per-request overhead dominates, so I was ranking setup cost rather than throughput. Two conclusions pointing in opposite directions do not average into a weaker conclusion. They void each other.
The rule I now apply: prefill counts only on prompts of 8,000 tokens or more. In the context table above, that means only the 262K row's prefill figure is trustworthy — 63.77 tok/s on a 255,125-token prompt. I have left the other rows' prefill out of the table entirely rather than print numbers I would not defend. The quant comparison table's prefill column is fine, because that one was run on the 8,121-token prompt on purpose.
Two anomalies on the DGX Spark I did not resolve
I am documenting both without an explanation, because a comparison that reports only the clean results is not much of a comparison.
It vanished from the network for three minutes. During the 4m40s model load, Tailscale and SSH were both unreachable for roughly three of those minutes. No reboot. No OOM kill in dmesg. The server was healthy afterwards and served every request I sent it. My working theory going in was memory pressure triggering a kill, and dmesg says otherwise, so I have a symptom and no cause.
One output lost its code fence. The third file-edit run came back without its Markdown code fence, so strict byte-identity failed on the Spark while the 2080 Ti box returned three identical SHA256s from the same task.
This one bothers me more than the network drop, because it should not be possible. Speculation is exact by construction — the target model verifies every drafted token, so the output is supposed to be indistinguishable from the non-speculative one. My expectation was that byte-identity is a property I could rely on and use as a correctness gate, and on one machine it held perfectly three times out of three. On the other it did not. I do not know whether the cause is sampling nondeterminism, something in the GB10 path, or the harness, and I did not isolate it. Until I do, byte-identity is evidence on this box and not a guarantee on all of them.
Full context / ngl / KV table
Every operating point I loaded, including the ones that failed. Decode in tok/s, VRAM as the total across all three cards.
| context | -ngl | KV | decode | VRAM |
|---|---|---|---|---|
| 8,192 | 45 | f16 | 22.62 | 58,020 MiB |
| 8,192 | 45 | q8_0 | 22.41 | 57,910 MiB |
| 32,768 | 49 | f16 | OOM at startup | — |
| 32,768 | 48 | f16 | 26.16 | 62,720 MiB |
| 32,768 | 48 | q8_0 | 25.71 | 62,304 MiB |
| 131,072 | 47 | q8_0 | OOM at startup | — |
| 131,072 | 46 | q8_0 | 23.14 ← recommended | 61,942 MiB |
| 131,072 | 45 | f16 | 22.66 | — |
| 262,144 | 45 | q8_0 | OOM at token 83,968 | — |
| 262,144 | 40 | q8_0, -ub 512 | 4.05 (prefill 63.77) | 57,044 MiB |
Three things this table shows that the three-row version above cannot.
Rows one and two: at 8K, q8_0 KV is very slightly slower than f16 — 22.41 against 22.62 — and saves only 110 MiB. At that depth the KV cache is small, so quantizing it saves nothing worth having and costs a little dequantization. The q8_0 recommendation is specific to deep context. Do not carry it down to short-context runs.
Rows seven and eight are the trade the recommendation rests on: -ngl 46 with q8_0 KV beats -ngl 45 with f16 KV, 23.14 against 22.66. Same context, one more layer on the GPU, 2.1%.
The -ub 512 on the last row shrinks the physical batch llama.cpp prefills with, which lowers peak scratch VRAM. It is the difference between 262K loading at all and not.
What I verified before each run
--split-mode layer on this box means NCCL is in the path, and NCCL on these cards has a specific trap: Ubuntu's packaged 2.22.3 is a stub under the CUDA 13 driver, and it fails in a way that masquerades as an out-of-memory error. Part 16 covers that in full.
Because a stub NCCL can turn a healthy configuration into a fake OOM, I checked per run rather than trusting the environment variable, by reading which library the process had actually mapped:
grep -o '/[^ ]*libnccl[^ ]*' /proc/"$(pgrep -x llama-server)"/maps | sort -u
Every run in this article resolved to the self-built 2.31.2. That trap already has its own article, so it does not appear anywhere in the data above — which is the point of checking.
Also in this series: Part 16: Fixing NCCL's stub-library error · Part 14: Two modded 2080 Tis reach 59.6 tok/s · Part 12: Why your 4-bit quant isn't faster · Part 3: 256K loaded fine, then crashed in real use
FAQ
- Can three modded 2080 Ti cards run a 177B model?
- Yes. Qwen3.8-Flash-Next reports 176.94B parameters, but the header explains why that number is misleading: 512 experts per layer with 10 used per token, so roughly 6B parameters are actually multiplied on any given token, and another 51B is an n-gram lookup table you gather sparse rows from rather than a weight matrix you multiply against. On 3× 2080 Ti 22G (66 GB of VRAM) with the UD-IQ4_XS quant, it decodes at 23.14 tok/s at 128K context and 26.16 tok/s at 32K. No tensor overrides are needed at any of the three operating points I measured — plain `--split-mode layer` and an `-ngl` number is the whole configuration.
- Is a 1-bit quant faster than a 4-bit quant on a 2080 Ti?
- Not meaningfully. Measured on the same binary, the same flags and the same 8,121-token prompt, UD-IQ1_S decoded at 26.74 tok/s and UD-IQ4_XS at 25.56 — a 4.6% gap for a 20 GB smaller file. Both fit entirely in VRAM at `-ngl 48`, so the space the 1-bit quant saves buys nothing back in speed. The quant that is genuinely slow is UD-Q4_K_XL at 104 G: it does not fit, only 36 of 48 layers land on the GPU, and decode drops to 16.02 tok/s. Quant tier matters when it decides how many layers fit, and stops mattering once everything already fits.
- Does llama.cpp's --spec-type ngram-mod change the model's output?
- No. It is exact speculation: the draft comes from repetition already present in the context, and the target model verifies every drafted token before it is emitted, so any draft the model would not have produced itself is discarded. I ran the same file-edit task three times with speculation on and got three SHA256-identical outputs, with both diffs against the non-speculative run empty. The speedup is real and free on repetitive work — 22.09 to 77.56 tok/s on a file edit, 90.3% draft acceptance — and it is worth nothing on prose, where it measured +0.17% and emitted no draft line at all.
Read next
- 2026-09-28NVFP4 Without FP4 Hardware: Qwen3.8-27B on Two RTX 2080 Tis at 151.7 tok/s
No FP4 hardware, still faster: a self-converted NVFP4 Qwen3.8-27B on two 2080 Tis runs code at 151.7 tok/s (was 116.1) and serves 4 requests at once.
- 2026-09-21Ternary Bonsai 2 on One RTX 2080 Ti: Qwen3.8-27B in 7.2 GB Scores 130 of 140
Ternary Bonsai 2 27B scored 130/140 on one modded 2080 Ti vs 131 for Qwen3.8-27B Q8_0 on two cards. Build steps, the flag that matters, why smaller is slower.
- 2026-08-21[Benchmark] Free 15% Speedup on a 2080 Ti: One Broken Chat Template, One Starving MTP Head
A frozen GGUF chat template was killing my KV cache; a community fix plus MTP draft depth 4 took Qwen3.8-27B from 41.6 to 47.6 tok/s on a 2080 Ti 22GB.
- 2026-10-06Qwen3.8-Flash-Next 177B on One RTX 2080 Ti: Strata Runs Code at 70 tok/s
One modded 2080 Ti 22GB plus 128 GB of RAM runs the 177B Qwen3.8-Flash-Next (IQ3_S) under Strata at 70.3 tok/s on code, next to a 27B on the other two cards.
Don't miss the next one
Subscribe, and you won't.
One-click unsubscribe anytime.