DGX Spark · part 42
[Benchmark] Qwen3.8-27B hits 65 tok/s on one DGX Spark — 12.3 without speculative decoding
❯ cat --toc
- The bottleneck is a doorway, not a workforce
- 273 ÷ 18.77 = 14.54: you can compute your ceiling before you benchmark anything
- Measured: 12.32 tok/s, or 85% of the ceiling
- I chased the remaining 15% down two paths and came back with nothing
- The only lever: get more tokens out of one weight read
- Where 65 tok/s came from: not a better method, a bigger draft budget
- Five runs isn't enough to call a median here
- The same flag is a large win on code and a 12% loss on chat
- Speculative decoding changes your output — and that isn't speculative decoding's fault
- The config that produced these numbers
- Deep dive: how these numbers were taken, and six things I got wrong
- I expected a dense model to cash in the bandwidth savings. It didn't.
- The 85% figure started life as 93%
- Proving it isn't silently dequantizing: use bandwidth, not logs
- Two easy wins, two dead ends
- The costly one: my draft budget was too small, and it took someone else asking
- The second costly one: five runs is not a headline number
- A model I proposed, then had to throw away
- One gotcha that will send you the wrong direction
- Every raw value
- A correction to part 19
- Takeaways
TL;DR
GB10 has 273 GB/s of memory bandwidth. Qwen3.8-27B NVFP4's language backbone is 18.77 GB, and every token reads all of it. That puts a hard ceiling at 14.54 tok/s. Measured without speculation: 12.32, or 85% of the ceiling. Two recommended optimizations came back empty — one was noise, one isn't supported on SM121. Speculative decoding is the only real lever: DFlash2 with a draft budget of 12 gives a median of 65.02 tok/s on coding (10 runs, 56.6–69.3), 5.28x the baseline. The jump from 53.89 to 65 wasn't a better method — my draft budget was just too small.
The bottleneck is a doorway, not a workforce
You can hire ten movers, but the doorway is one person wide. Adding people doesn't help. You either make the furniture smaller or you carry more per trip.
This is part 42 of the DGX Spark series. Part 19 measured NVFP4 losing to FP8 and blamed the hardware. Part 25 fixed half of that, showing NVFP4 wins on bandwidth rather than on compute. This one closes the loop: how much bandwidth is actually left, and where the rest of the speed lives.
Almost none is left. And the speed lives somewhere I got wrong at first — someone had to ask before I found it.
273 ÷ 18.77 = 14.54: you can compute your ceiling before you benchmark anything
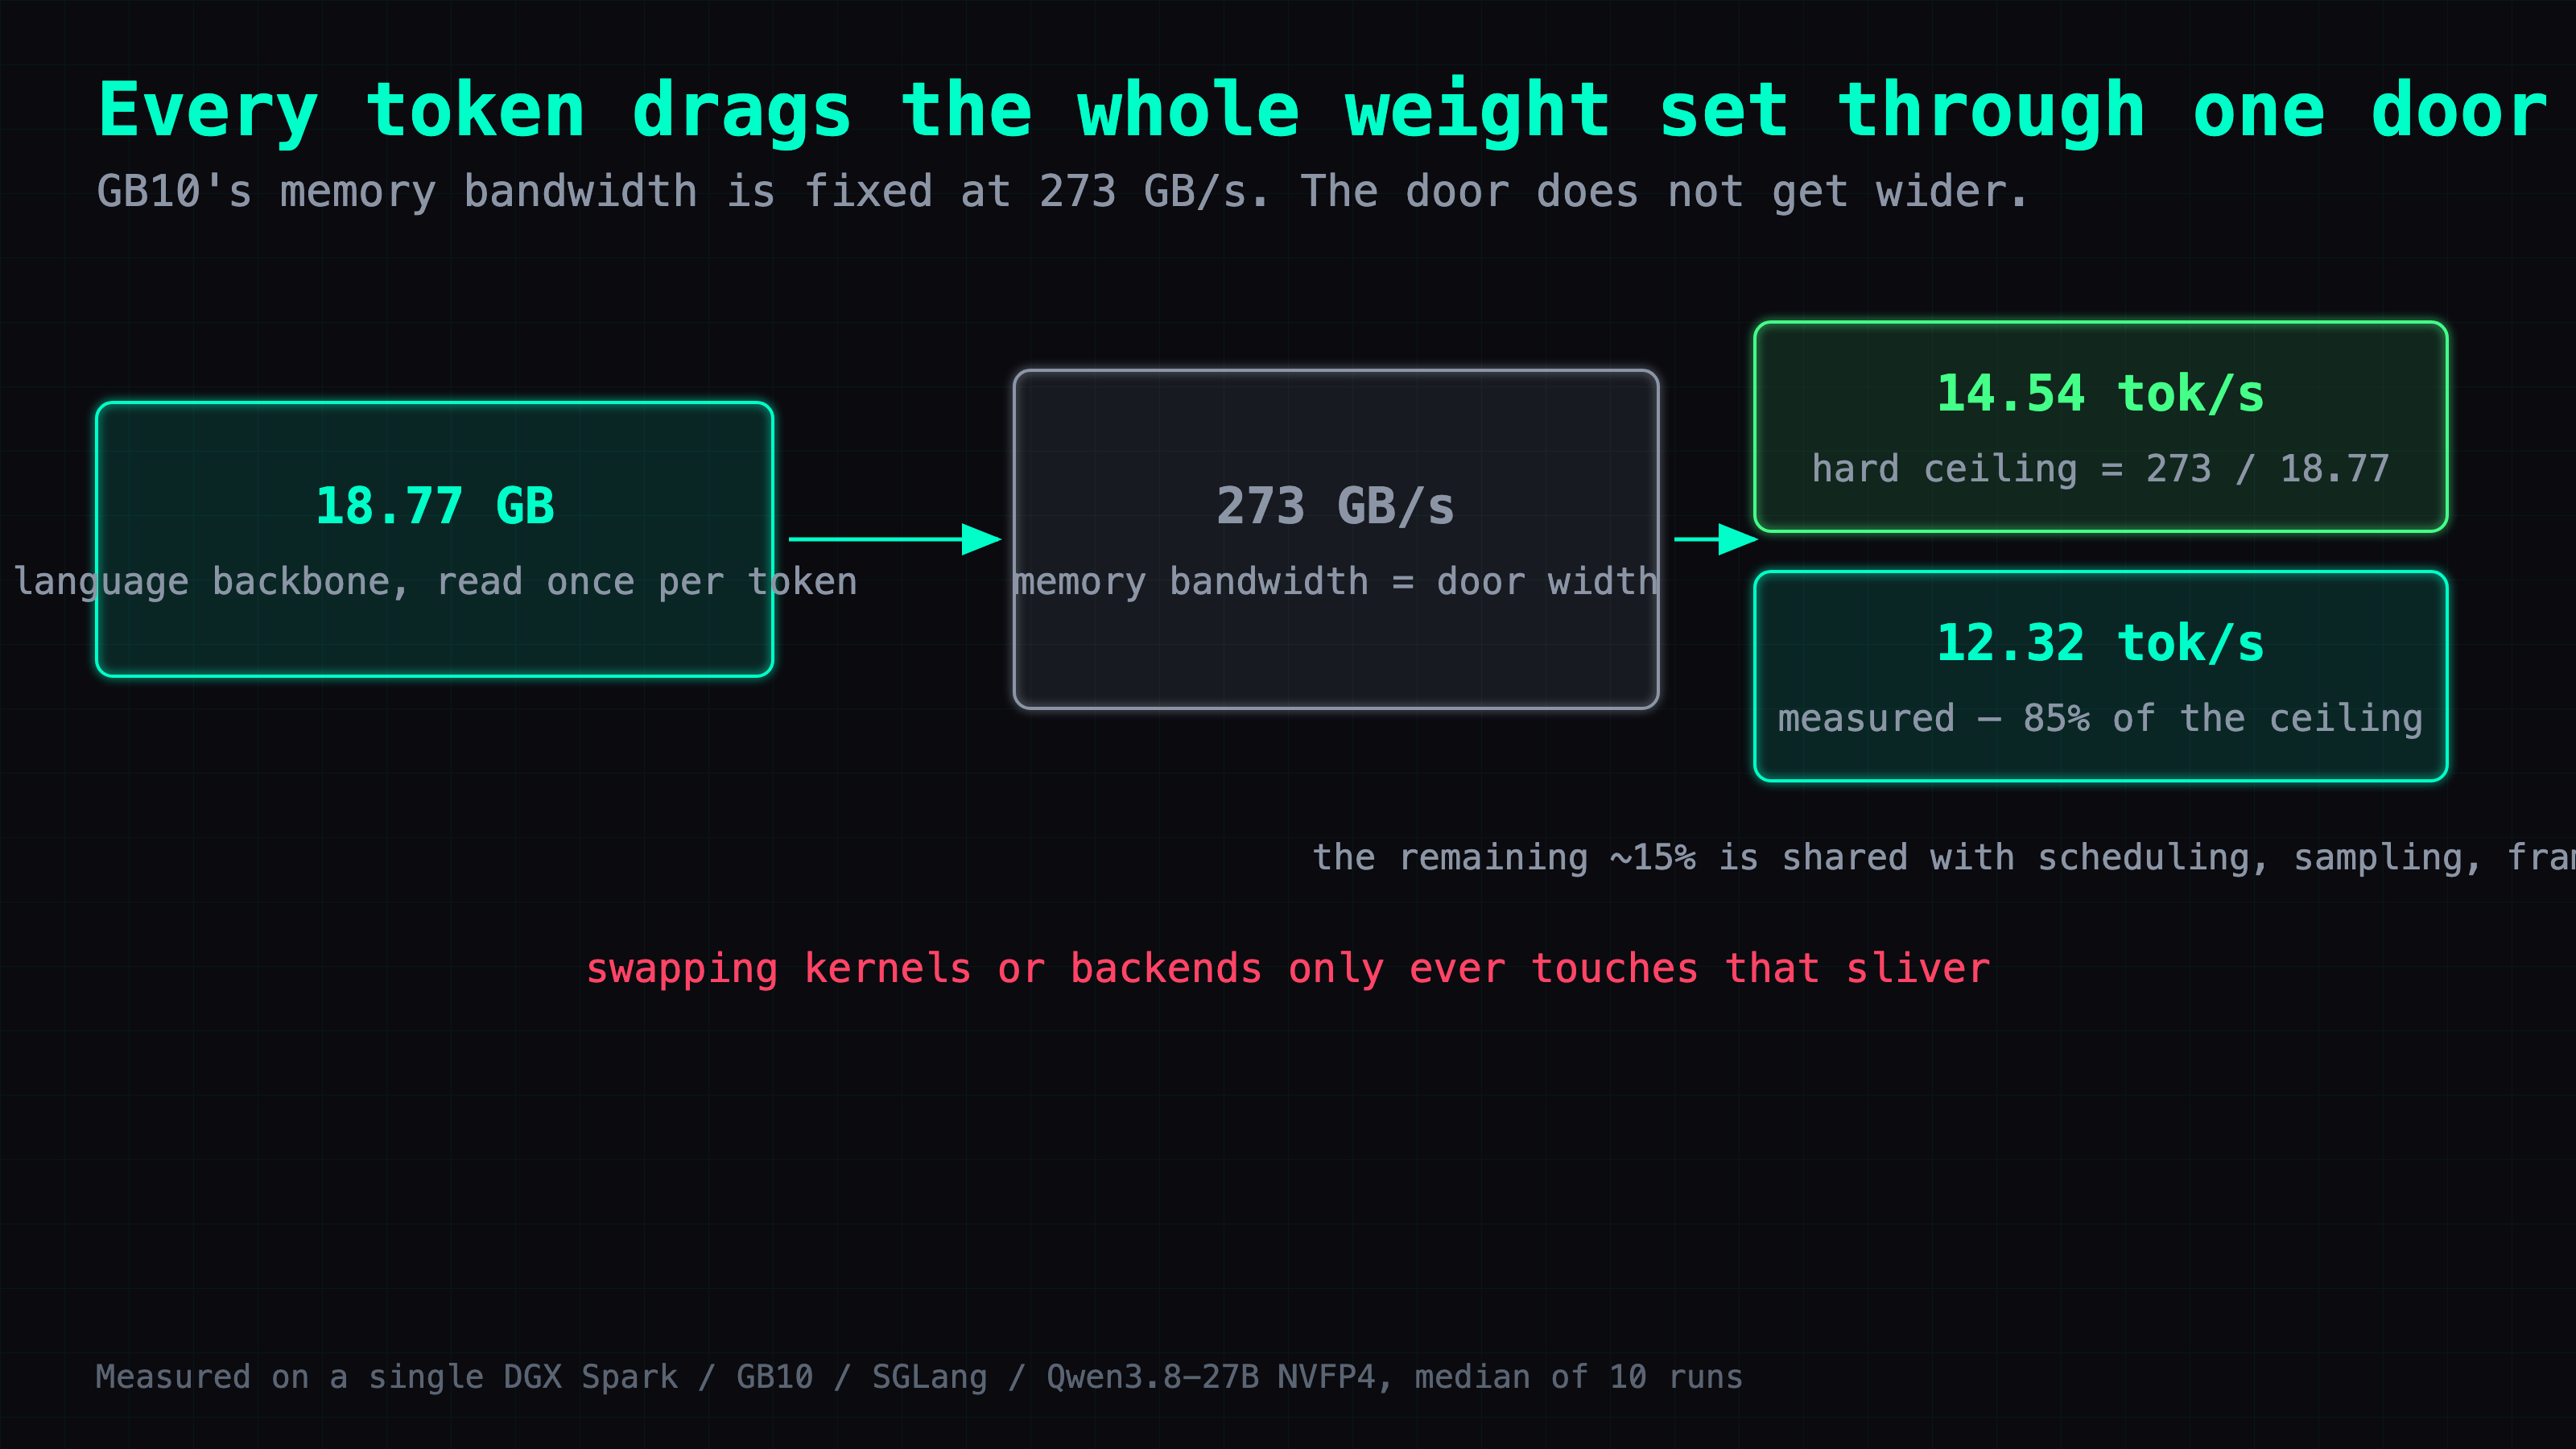
Every token an LLM emits requires reading the entire weight set from memory into the chip. Not part of it. All of it. That gives single-stream generation a hard physical ceiling:
bandwidth ÷ bytes read per token = tokens per second
GB10 runs LPDDR5X at 273 GB/s (NVIDIA spec). The denominator needs care. RadixArk/Qwen3.8-27B-NVFP4 is 20.42 GB on disk, but text-only chat never touches parts of it. Summing the safetensors headers tensor by tensor:
| Component | Size | Read every token? |
|---|---|---|
| Language backbone | 18.77 GB | yes |
| Vision tower | 0.86 GB | only with images |
| MTP head | 0.79 GB | only with speculation on |
The denominator for text-only work is 18.77 GB, not 20.42.
273 ÷ 18.77 = 14.54 tok/s. That's the wall for this model on this box without speculation.
Measured: 12.32 tok/s, or 85% of the ceiling
Running SGLang with a 262144 context, bf16 KV cache and mem-fraction-static at 0.90. Ten runs, each prompt carrying a unique prefix so the cache never engages:
| Median of 10 | 12.3162 |
| Min / max | 12.3022 / 12.3844 |
| Spread | 0.67% |
Long-form prose and short chat came in at 12.42 and 12.33. All three workloads land within 1% of each other.
That flatness is itself the evidence. Compute-bound throughput moves when the work changes. This doesn't move at all, which means the clock is measuring one thing: how long it takes to drag 18.77 GB across the bus.
12.32 ÷ 14.54 = about 85%.
I chased the remaining 15% down two paths and came back with nothing
What's left has to cover scheduling, sampling and framework overhead. But that's an argument, not a measurement, so I tested two candidates that both had outside evidence behind them. Both on the no-speculation baseline:
| Change | Why I tried it | Result |
|---|---|---|
| Pin the container to the ten Cortex-X925 big cores | MiaAI-Lab measured +2–7% | Unmeasurable. Effect +0.029% against 0.751% drift |
Switch to the flashinfer_cutedsl backend | It's in SGLang's backend list | Not supported. Rejected at startup |
The second one failed cleanly:
mm_fp4 does not support backend 'cute-dsl' with capability 121
The first is more interesting. Not only was the effect far below the drift, it changed sign between rounds — +0.056% then −0.135%. That's what noise looks like. Effects don't do that.
So "you can't recover it by swapping kernels" is no longer something I derived. It's two attempts that came back empty.
The only lever: get more tokens out of one weight read
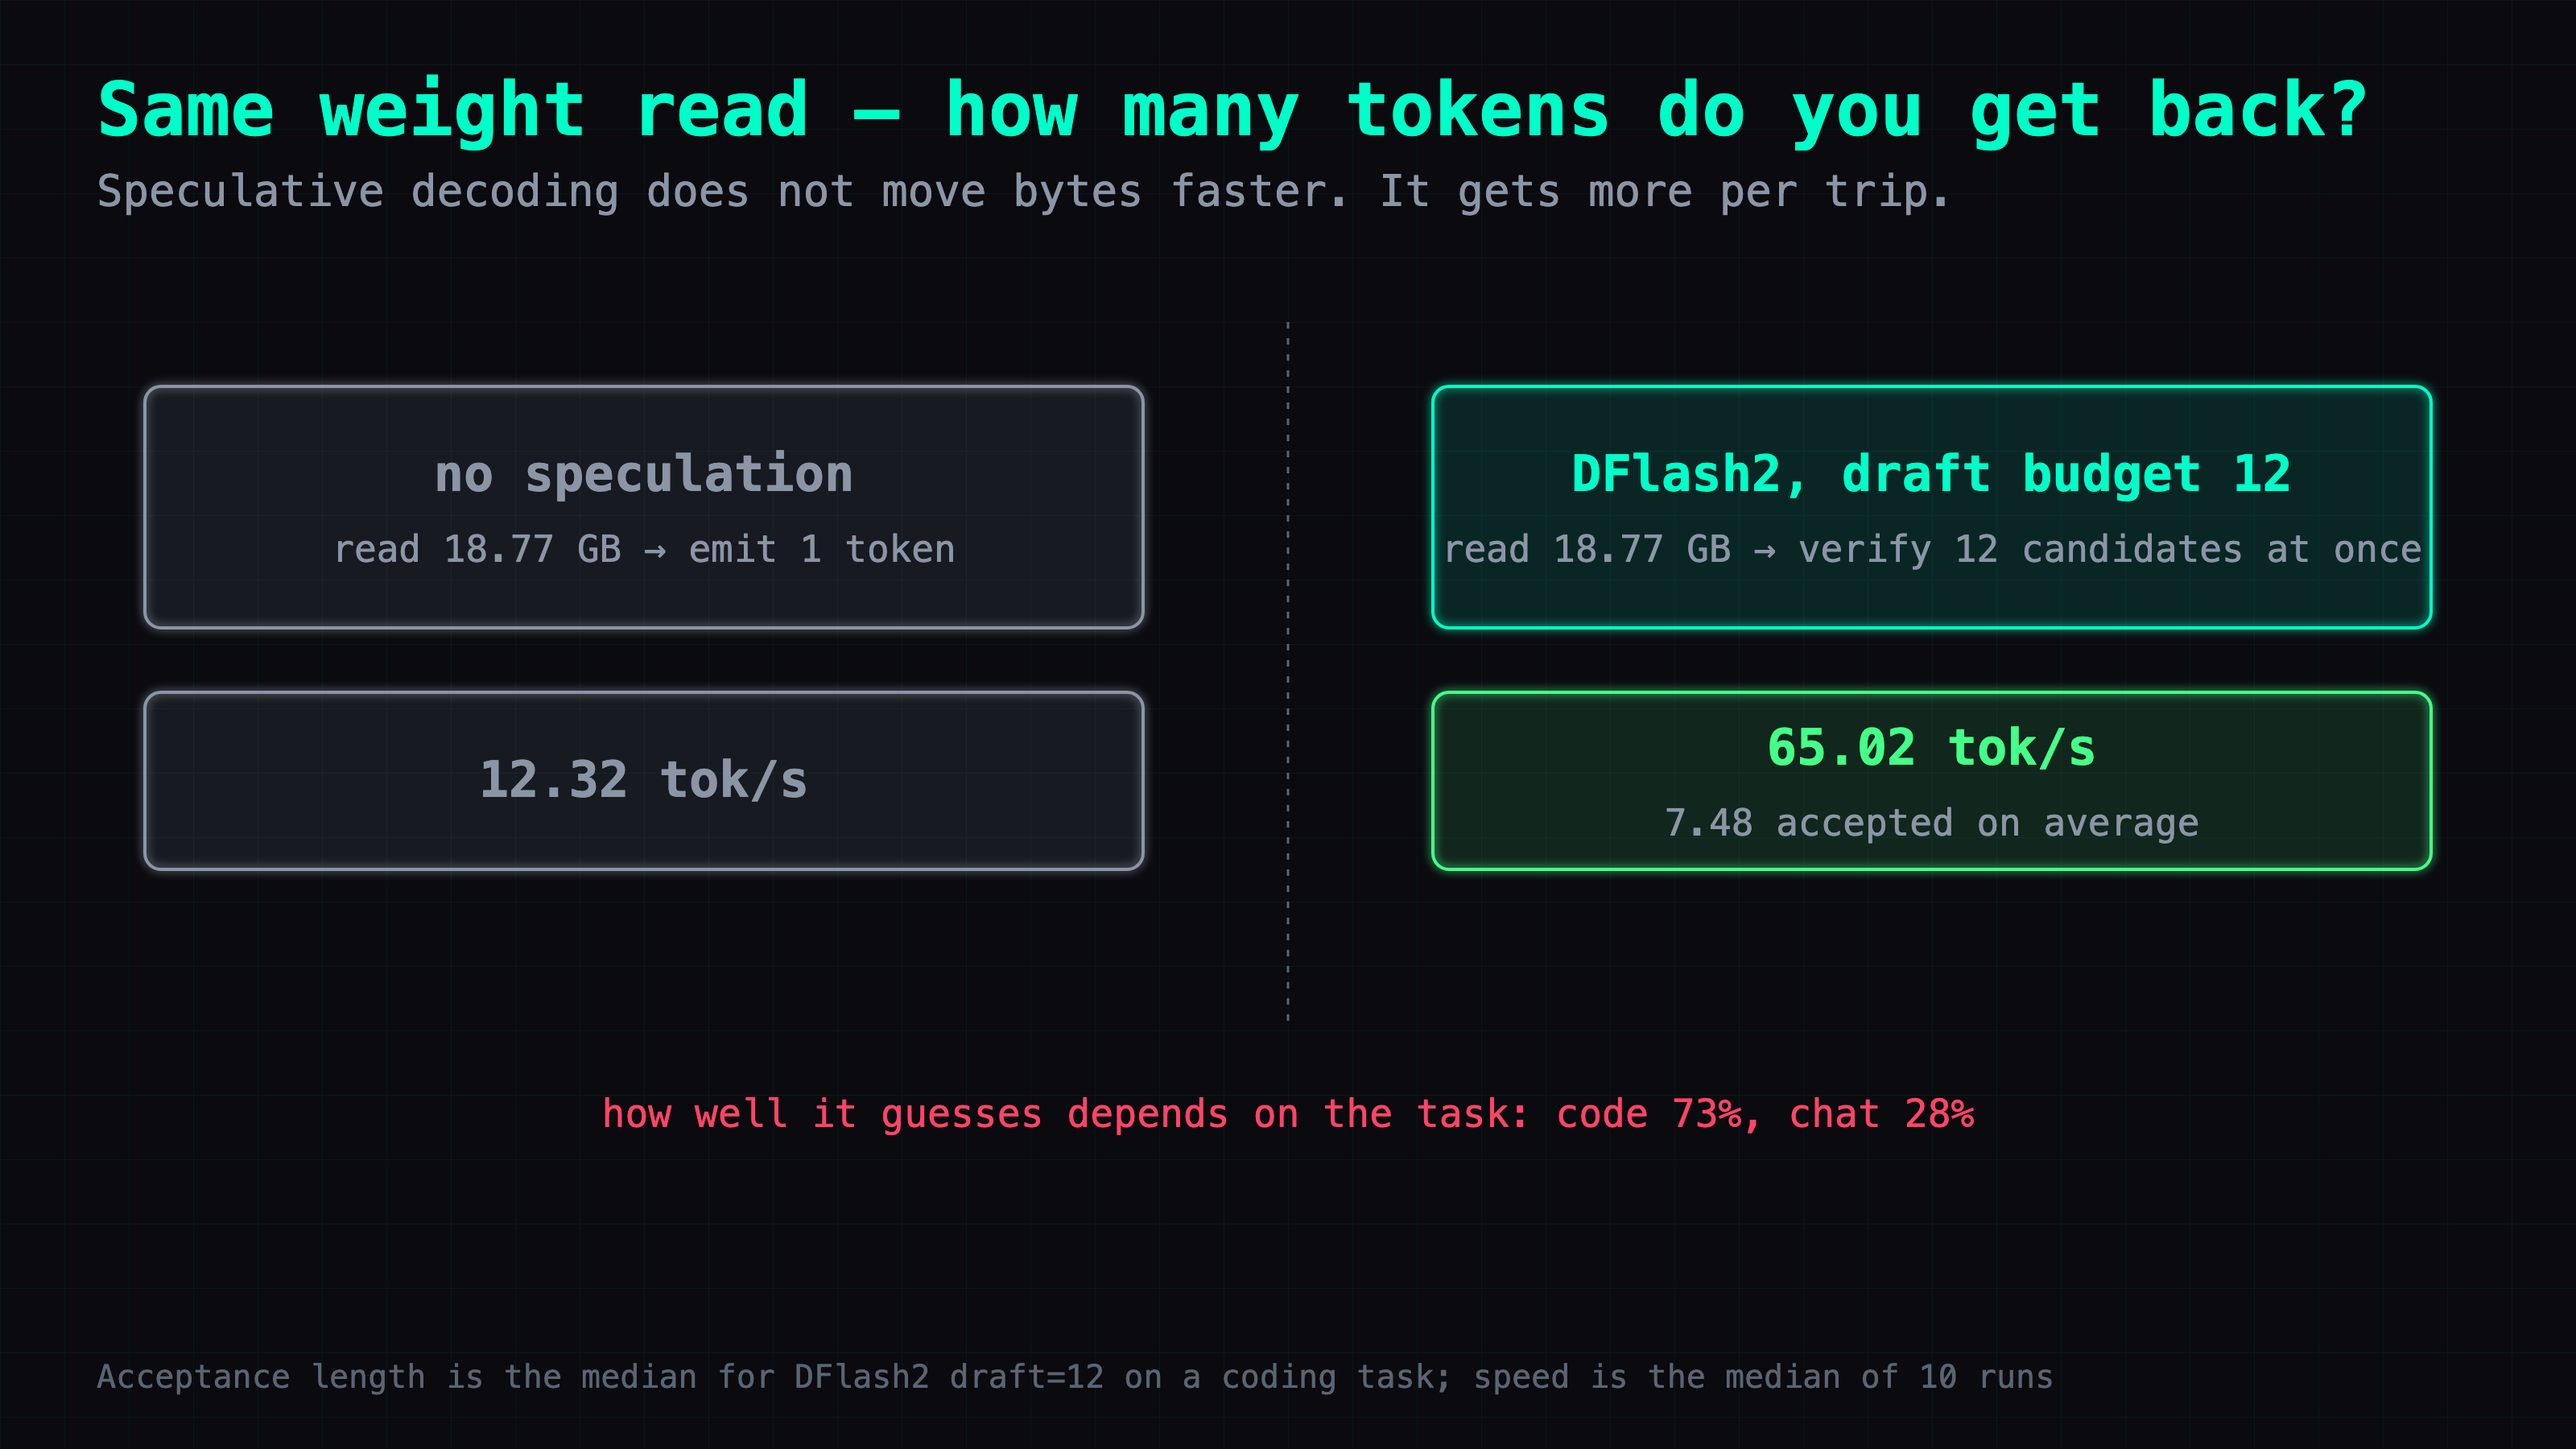
Speculative decoding runs a small fast model ahead of the big one to guess the next several tokens, then has the big model verify the whole batch in one pass. Correct guesses are kept, wrong ones thrown away.
The trick is that verifying a batch and generating a single token cost the big model the same weight read — 18.77 GB either way. Guess well enough and one trip buys you several tokens.
This is where DGX Spark shines. Unified memory makes that verification pass nearly free. On a compute-constrained box, verification becomes the new bottleneck and the discount evaporates.
Where 65 tok/s came from: not a better method, a bigger draft budget
I tested all three speculative decoders. DFlash2 won. But my first number was 53.89, not 65 — and the whole gap sits in one flag.
| DFlash2 draft budget | Coding decode | Acceptance length |
|---|---|---|
| 8 (recipe default) | 53.89 | 6.12 |
| 12 | 65.02 (10 runs, 56.6–69.3) | 7.48 |
| 16 | 69.21 | 8.13 |
Where did the 8 come from? I copied someone else's recipe default. Copying a default inherits their tuning, not their optimum.
The signal for whether there's room left is saturation — acceptance length divided by draft budget:
| Method | Acceptance length | Draft budget | Saturation | Reading |
|---|---|---|---|---|
| DFlash2 | 6.12 | 8 | 76.5% | nearly full, more budget might pay |
| MTP | 4.16 | 5 | 83.2% | fullest of the three, budget-limited |
| DSpark | 4.68 | 8 | 58.6% | guessing badly, more budget won't help |
Not acceptance rate. A high acceptance rate can just mean the budget is so small there's barely anything to get wrong.
Five runs isn't enough to call a median here
I measured draft budget 12 twice. First time, five runs, median 68.57. Second time, fresh container, ten runs, median 65.02, ranging 56.6 to 69.3.
The five-run median landed on the high side. Acceptance rate is bound to the content being generated, so this config's spread is wide by nature — 19.5% here, against 0.67% with no speculation. When spread runs that wide, five runs won't pin a median.
I was about to put 68 in this article's title. Someone asked me to reproduce it first. What's listed here is 65, plus the ratio against the no-speculation baseline from the same session: 5.28x. Ratios survive thermal drift; absolute numbers don't.
The same flag is a large win on code and a 12% loss on chat
Raising the draft budget isn't universally good. It depends on what you're generating:
| Workload | Draft budget 8 | Draft budget 16 | Change |
|---|---|---|---|
| Coding | 53.89 | 69.21 | large gain |
| Long prose | 28.14 | 28.07 | −0.25% |
| Short chat | 26.04 | 22.97 | −11.8% |
Acceptance rate again: the next token in a code block is easy to guess (73.1%), the next token in casual conversation isn't (28.1%). When guessing is hard, a bigger draft just means paying more verification cost and throwing more away.
So the recommendation splits by workload rather than shipping one global default:
| Workload | Use | Measured |
|---|---|---|
| Coding | DFlash2, --speculative-num-draft-tokens 12 | 65.02 (10 runs, 56.6–69.3) |
| Long prose | DFlash2, budget 8 | 28.14 |
| Short chat | DFlash2, budget 8 | 26.04 |
| Restricted to the in-checkpoint MTP head | EAGLE, steps 5 / topk 4 / draft 16 | 41.57 |
Next time you see someone post "DGX Spark does XX tok/s", the first question is what they were generating, not what flags they used.
Speculative decoding changes your output — and that isn't speculative decoding's fault
I assumed this wasn't worth writing about. Checking it changed my mind.
Same prompt, temperature=0, fixed seed. The code that comes out with DFlash2 on is not the same code that comes out with it off. Both are valid implementations. The divergence starts at one capitalized letter inside a docstring and everything downstream follows from there.
My first guess was floating-point jitter. That turned out to be wrong: running either config three times gives byte-identical output every time. So these are two stable paths that disagree with each other.
The answer came from a control with no speculative decoding anywhere in it — same server, same request, once alone and once alongside a second concurrent request:
batch=1          39e462cb7494b66f...
batch=2, req A   b660d8f884b9d35c...
batch=2, req B   b660d8f884b9d35c...
Going from one concurrent request to two changed the output, and the two requests inside that batch agree with each other. Batching changes the reduction order inside the matmuls. Floating-point addition isn't associative, so a near-tied token flips.
So the speculative decoding difference is the same effect. This isn't specific to speculative decoding — anything that changes the batch shape can do it. But you should know it happens — particularly if you have tests that expect identical output from identical input.
The config that produced these numbers
Single DGX Spark (GB10 / SM121 / aarch64 / 128 GB unified memory), driver 580.159.03, using MiaAI-Lab's SGLang recipe — the public setup I found that gets DFlash2 running on this box.
--mem-fraction-static 0.90            # not 0.95
--context-length 262144               # YaRN off
--kv-cache-dtype bf16                 # not fp8
--fp4-gemm-backend flashinfer_cutlass # not auto
--speculative-algorithm DFLASH
--speculative-num-draft-tokens 12     # 12 for code, 8 for chat
0.95 plus a handful of concurrent requests will hard-reboot the machine. The bf16 KV cache has two independent reasons behind it: DFlash speculative decoding is fundamentally incompatible with every KV cache quantization — its draft path needs non-causal attention and the backends reject that combination outright, so the engine won't even start (vLLM #41559), and separately I measured fp8 KV driving output into infinite repetition back in March. And auto is out because this build of SGLang never rewrites it to whatever the autotuner picked, so you lose the audit trail.
One more thing that will make you doubt your own numbers: a DFlash2 stream event carries about 3.75 tokens. Count events and you'll compute roughly 9 tok/s and conclude something is broken. Divide completion_tokens by wall time instead.
Deep dive: how these numbers were taken, and six things I got wrong
Skip this section and nothing above stops working. What follows is the measurement process, the places my reasoning failed, and every raw value.
I expected a dense model to cash in the bandwidth savings. It didn't.
Where I started: every previous NVFP4 measurement on GB10 was on a MoE model, and MoE only lights up a few experts per token, so halving the weight width saves relatively little. Qwen3.8-27B is dense — every token reads everything.
What I expected: dense NVFP4 would clearly beat same-size FP8, maybe by 2x.
What I did: ran the config above across three workloads with speculation off.
What happened: about 12.4. Reports of the same model in FP8 on the NVIDIA developer forum sit around 15 to 20 — someone else's box and settings, not a control.
Where my model was wrong: I missed a layer. Halving the width does save bandwidth, but that saving only converts fully into speed when bandwidth is the sole bottleneck — and it already was, so the saving is already inside the 12.4. On top of that, the FP8 numbers I was comparing against came from someone else's box, engine and prompts. That's not a control group; it's two numbers with three variables between them.
The 85% figure started life as 93%
Where I started: computing the ceiling, I took du -sb on the model directory and got 20.42 GB.
What I expected: model size is what gets read per token.
What I did: 273 ÷ 20.42 = 13.37, measured 12.44, published-in-my-head 93%. Clean number. Nearly shipped it.
What happened: summing safetensors headers tensor by tensor turned up a 0.86 GB vision tower and a 0.79 GB MTP head, neither of which text-only chat reads a single byte from. The real denominator is 18.77 GB, ceiling 14.54.
Where my model was wrong: du is a derived number and I treated it as ground truth. A 1.65 GB error sounds small, but it moved "how much headroom is left" from 7% to about 15% — a factor of two. Those are different answers to "is this worth optimizing".
Proving it isn't silently dequantizing: use bandwidth, not logs
Where I started: NVFP4 has a classic failure mode where the engine loads 4-bit weights but dequantizes back to BF16 on-chip before the math, so none of the bandwidth saving materializes. The file is 4-bit; the speed is BF16.
What I expected: grep the startup log for the kernel path.
What I did: grepped, found fp4_gemm_runner_backend='flashinfer_cutlass' and no marlin — the usual dequant fallback.
What happened: that evidence is too soft. A log printing a format name doesn't prove that path is executing. I've been fooled by exactly that string on another card. So I checked it against physics instead:
| Assumption | Bytes per token | Ceiling | Measured 12.32 is |
|---|---|---|---|
| Really reading 4-bit | 18.77 GB | 14.54 | 85% |
| Dequantizing to FP8 first | 37.5 GB | 7.28 | 169% |
| Dequantizing to BF16 first | 75.1 GB | 3.64 | 338% |
If it were secretly dequantizing, the measured speed would exceed a physical limit. It can't. The weights really are being read at their packed 4-bit width.
Why this generalizes: the method doesn't depend on the engine being honest about what it's doing. Any "is my quantization actually doing anything" question can be attacked this way first.
Two easy wins, two dead ends
Where I started: 12.3 against a 14.54 ceiling left roughly 15% unaccounted for, and I wanted to know whether any of it was reachable.
What I expected: both candidates had outside evidence — big-core pinning was measured at +2–7% by someone else, and flashinfer_cutedsl is a listed backend that auto simply doesn't pick on this arch.
What I did: an A/B/A/B block design, two rounds of five runs per config, with cooldowns in between. Alternating blocks rather than running one config to completion means thermal drift hits both configs equally — and the gap between the two rounds is a direct measurement of the drift itself.
What happened: big-core pinning came in at +0.029% against 0.751% drift, with the sign flipping between rounds. flashinfer_cutedsl was rejected by a capability gate.
Where my model was wrong: I nearly skipped this experiment on the grounds that a 2–7% effect is smaller than my noise threshold. That reasoning was broken. My threshold was calibrated for comparing against other people's published numbers; within one box and one session the variance is 0.4%. "The effect is smaller than the noise" is a measurement design problem, and the fix is to reduce the noise, not to skip the measurement.
The costly one: my draft budget was too small, and it took someone else asking
Where I started: the first round finished with DFlash2 at 53.89 winning every workload. Clean-looking result.
What I expected: each method uses its own recommended settings, fastest one wins.
What I did: gave MTP 5 draft tokens and gave DSpark and DFlash2 8 — the latter two copied from recipe defaults, the first one hardcoded by me. I even wrote an explicit instruction not to sweep that parameter, on the grounds that someone had measured larger budgets performing worse on a different inference engine.
What happened: after being asked "are you sure nothing's off here", I looked at acceptance length instead of acceptance rate. MTP's saturation was 83.2% — it was consuming 4.16 of the 5 tokens it was allowed, the highest of the three. It was budget-limited, not accuracy-limited. Rerunning with a bigger budget put DFlash2 well above where it had been.
Where my model was wrong: two errors stacked. The comparison itself was unfair — a 5-token method against 8-token methods. Worse, I used a parameter sweep from a different engine to forbid an experiment on mine. That conclusion was true in its own context. It was never evidence about my machine.
The second costly one: five runs is not a headline number
Where I started: draft budget 12 measured 68.57 across five runs. I put it in the recommendation table and in a draft of this article's title.
What I expected: five runs is fine; every other config had a spread of 2–8%.
What I did: after being asked to confirm it, spun up a fresh container and ran ten.
What happened: median 65.02, ranging 56.63 to 69.30, spread 19.5%. The five-run median had landed on the high side of the distribution.
Where my model was wrong: I applied an average spread to a config that is unusually unstable. Speculative decoding's acceptance rate is coupled to the content being generated, so its jitter is an order of magnitude wider than the non-speculative case. Above roughly 15% spread, five runs won't give you a stable median. And this number was headed for a public title — better it collapses now than after publication.
A model I proposed, then had to throw away
The first round's three data points fit a suspiciously tidy relationship:
decode ≈ k × baseline × acceptance_length, k between 0.69 and 0.74
I wrote it into the second round's plan as an explicit hypothesis under test, requiring every new config to report its k. Results:
| Config | k | In band? |
|---|---|---|
| DFlash2 draft 12 | 0.700 | yes |
| DFlash2 draft 16 | 0.685 | marginal |
| MTP steps7/topk1/draft8 | 0.576 | no |
| MTP steps5/topk4/draft16 | 0.610 | no |
Falsified. Acceptance length alone doesn't predict throughput — a linear chain draft and a tree draft have different proposal costs, and one coefficient can't carry both.
It's here because of what it demonstrates: an estimate's legitimate job is to design an experiment, not to cancel one. It got falsified, and the falsification is one of this round's results.
One gotcha that will send you the wrong direction
Wanting to pin the FP4 backend explicitly, I added a --fp4-gemm-runner-backend flag. The container exited with code 2 immediately, and the launch script's readiness check had no idea — it kept curling a port that had never opened until it timed out on its own. I spent eight minutes convinced the server wouldn't start. The actual message was in the container log:
sglang serve: error: unrecognized arguments: --fp4-gemm-runner-backend flashinfer_cutedsl
The field is fp4_gemm_runner_backend in the server args, but the CLI doesn't accept the dashed spelling.
"Bad flag" and "server won't start" are indistinguishable at the readiness-check layer — both are connection refused — and the information that separates them lives in a different file. Readiness checks should confirm the thing being checked is still alive before they start waiting for it to get healthy.
Every raw value
Every response had cached_tokens at 0, confirming the prefix cache never engaged. Throughput is always completion_tokens divided by wall time, never stream events. Output length was pinned at 520 tokens per run (finish_reason was length every time), so the only variable is elapsed time.
⚠️ The cells marked as 5 runs are weaker evidence than the two marked 10. See the section on spread above — flagging it rather than presenting them as equal.
Round one: three methods, each on its own default budget (5 runs each)
| Method | Coding | Long prose | Short chat |
|---|---|---|---|
| No speculation | 12.44 | 12.42 | 12.33 |
| MTP n=5 | 35.71 / 79.2% | 24.42 / 45.8% | 21.11 / 37.5% |
| DSpark budget 8 | 42.88 / 52.8% | 19.36 / 15.5% | 17.64 / 13.4% |
| DFlash2 budget 8 | 53.89 / 73.1% | 28.14 / 30.1% | 26.04 / 28.1% |
Round two: fair comparison and parameter sweep (coding only, bracket design REF→M1→M2→M3→D1→D2→REF, drift 1.307%, 5 runs each)
| Cell | Parameters | Decode | Acceptance rate | Acceptance length | Saturation |
|---|---|---|---|---|---|
| REF_A | MTP steps4/topk1/draft5 | 35.70 | 79.40% | 4.16 | 83.2% |
| M1 | MTP steps7/topk1/draft8 | 38.80 | 63.10% | 5.42 | 67.7% |
| M2 | MTP steps4/topk4/draft8 | 38.58 | 51.45% | 4.60 | 57.5% |
| M3 | MTP steps5/topk4/draft16 | 41.57 | 29.75% | 5.47 | 34.2% |
| D1 | DFlash2 draft12 | 68.57 | 62.95% | 7.88 | 65.7% |
| D2 | DFlash2 draft16 | 69.21 | 47.40% | 8.13 | 50.8% |
| REF_B | MTP steps4/topk1/draft5 | 36.17 | 79.64% | 4.19 | 83.9% |
Round three: independent reproduction (fresh container, 10 runs each)
| Config | Ten raw values | Median | Range | Spread |
|---|---|---|---|---|
| No speculation | 12.32 / 12.38 / 12.33 / 12.34 / 12.31 / 12.30 / 12.34 / 12.31 / 12.31 / 12.31 | 12.3162 | 12.302–12.384 | 0.67% |
| DFlash2 draft12 | 56.63 / 63.76 / 68.46 / 68.17 / 66.68 / 62.98 / 64.56 / 65.48 / 63.47 / 69.30 | 65.0181 | 56.63–69.30 | 19.5% |
Ratio: 65.0181 ÷ 12.3162 = 5.28x.
A correction to part 19
In part 19 I wrote this:
This is a silicon-level limitation. No driver update, no firmware flash, no software patch can add a missing transistor circuit.
That sentence is wrong. Part 25 already corrected half of it by showing mma.kind::mxf4nvf4 really does fire on the W4A4 path. The bandwidth arithmetic in this article corrects the other half — the weights genuinely are read at 4-bit width, so the silicon is not missing that capability. What part 19 measured was the software layer picking the wrong kernel path.
I've left part 19 as written and added an update notice at the top instead. The reasoning that went wrong is more useful preserved than quietly corrected.
Takeaways
Where the time went: those eight minutes where the server looked hung. A bad flag and a server that won't start look identical at the readiness-check layer, and what tells them apart lives in a different file.
Reusable diagnostics, three of them. Bandwidth back-calculation: to find out whether your quantization is doing anything, compare measured throughput against the physical ceiling under each hypothesis and discard whatever exceeds it. Saturation: to find out whether speculative decoding has room left, divide acceptance length by draft budget rather than reading acceptance rate. And the batch=1 versus batch=2 control: to determine whether some feature causes a difference, find a setup with none of that feature in it that reproduces the same difference.
What stays with me isn't the multiplier. It's where it was hiding. I used somebody else's finding to forbid a measurement I should have taken, then used a five-run median as a number fit for a headline. Both times I had a reasonable-sounding excuse to skip one observation. Both times it took one question from someone else to surface it.
FAQ
- How fast can a DGX Spark run Qwen3.8-27B?
- On a coding task, DFlash2 speculative decoding with a draft budget of 12 gives a median of 65.02 tok/s across ten runs, ranging 56.6 to 69.3. That is 5.28x the no-speculation baseline on the same box. Long-form prose and short chat land far lower — 28.14 and 26.04 — because acceptance rate tracks the workload.
- Why doesn't swapping kernels or backends speed up my DGX Spark?
- Single-stream decode is bound by moving weights from memory into the chip, not by the math afterward. Measured throughput already sits at roughly 85% of the bandwidth ceiling, and what's left is shared with scheduling, sampling and framework overhead. I tried two recommended optimizations: one measured as noise, the other isn't supported on SM121 at all.
- What should I set num-draft-tokens to for speculative decoding?
- It depends on the workload, not the hardware. On the same model and the same box, raising DFlash2's draft budget from 8 to 12 made coding noticeably faster, but raising it to 16 made short chat 11.8% slower. The signal for whether there's room left is saturation — acceptance length divided by draft budget — not acceptance rate.
- Does speculative decoding change the text the model produces?
- Yes, but that isn't speculative decoding's fault. I ran a control with no speculation at all: sending two concurrent requests instead of one changed the output. Batching changes the reduction order inside the matmuls, floating point isn't associative, and near-tied tokens flip. Anything that changes the batch shape can do this.
Read next
- 2026-05-06Liftoff: Gemma 4 hits 670 tok/s aggregate on DGX Spark (108 tok/s single-stream)
Google announced Multi-Token Prediction drafters for Gemma 4 on 2026-05-05. The vLLM PR was opened and approved the same day; a preview Docker image shipped hours later. I tested it on DGX Spark: Gemma 4 26B-A4B-it FP8 + MTP γ=4 hits 108.78 tok/s single-stream (2.66× baseline), 674.28 tok/s aggregate at concurrency=8. One undocumented trap: the drafter pairs with -it, not base.
- 2026-06-01[Benchmark] NVFP4 W4A4 beats FP8 on a DGX Spark MoE: 67 vs 52 tok/s once CUDA graphs fire
On a GB10 DGX Spark, NVFP4 W4A4 went from 23 to 67 tok/s the moment I dropped --enforce-eager — beating FP8 by 29% and saving 16GB. The catch from Part 32 was real, just dense-only.
- 2026-04-21[Benchmark] NVFP4 Is a Trap on GB10: FP8 Wins by 32% (vLLM + SGLang Tested)
NVFP4 should be faster than FP8 — fewer bits, less bandwidth. On DGX Spark's GB10 (SM121), it's 32% slower. Root cause: missing hardware instruction. Dual-engine proof with vLLM and SGLang.
- 2026-05-30NVFP4 is 1.5× FP8 on a DGX Spark — but it's compression, not the FP4 cores
On a GB10 DGX Spark, NVFP4 beats FP8 by ~1.5× for single-stream decode on a dense model. But the win is bandwidth (smaller weights), not the FP4 tensor cores — the fastest path never touches them.
Don't miss the next one
Subscribe, and you won't.
One-click unsubscribe anytime.