DGX Spark · part 43
[Benchmark] A 177B MoE at Full 262K Context on a DGX Spark: 76.65 tok/s on a File Edit
❯ cat --toc
- Why 104 GiB of weights fit in 121 GB of memory
- The build: one cmake flag decides whether your output means anything
- The config to copy: 262,144 context, 4m40s to load
- 76.65 tok/s on a file edit, 20.51 on prose: one number cannot describe this
- What it can answer: 6/7 on a probe built to separate quant tiers
- DGX Spark vs 3× 2080 Ti: decode ties, the tradeoff does not
- Deep dive: a stalled download, a machine that vanished, and one output that changed
- Why was a 104 GiB download crawling at 74 KB/s?
- The box dropped off the network for three minutes mid-load
- The third identical request produced different output
- Environment
TL;DR
Qwen3.8-Flash-Next in UD-Q4_K_XL is 104 GiB. A DGX Spark holds all of it plus a 262,144-token context in one 121 GB pool, because 51B of the parameters are an n-gram lookup table that can live on the CPU. Load takes 4m40s. A file edit decodes at 76.65 tok/s with ngram speculation; prose at 20.51. Three modded 2080 Tis hit 77.56 on the same edit, so this box did not buy speed. It bought never having to trade quant tier against context. One cmake flag decides whether any of the output means anything.
In a studio apartment the dining table folds down over the bed. Nothing is broken. You just pay for every meal by putting away somewhere to sleep. Move into a place with a real kitchen and dinner does not cook faster — you stop rearranging furniture.
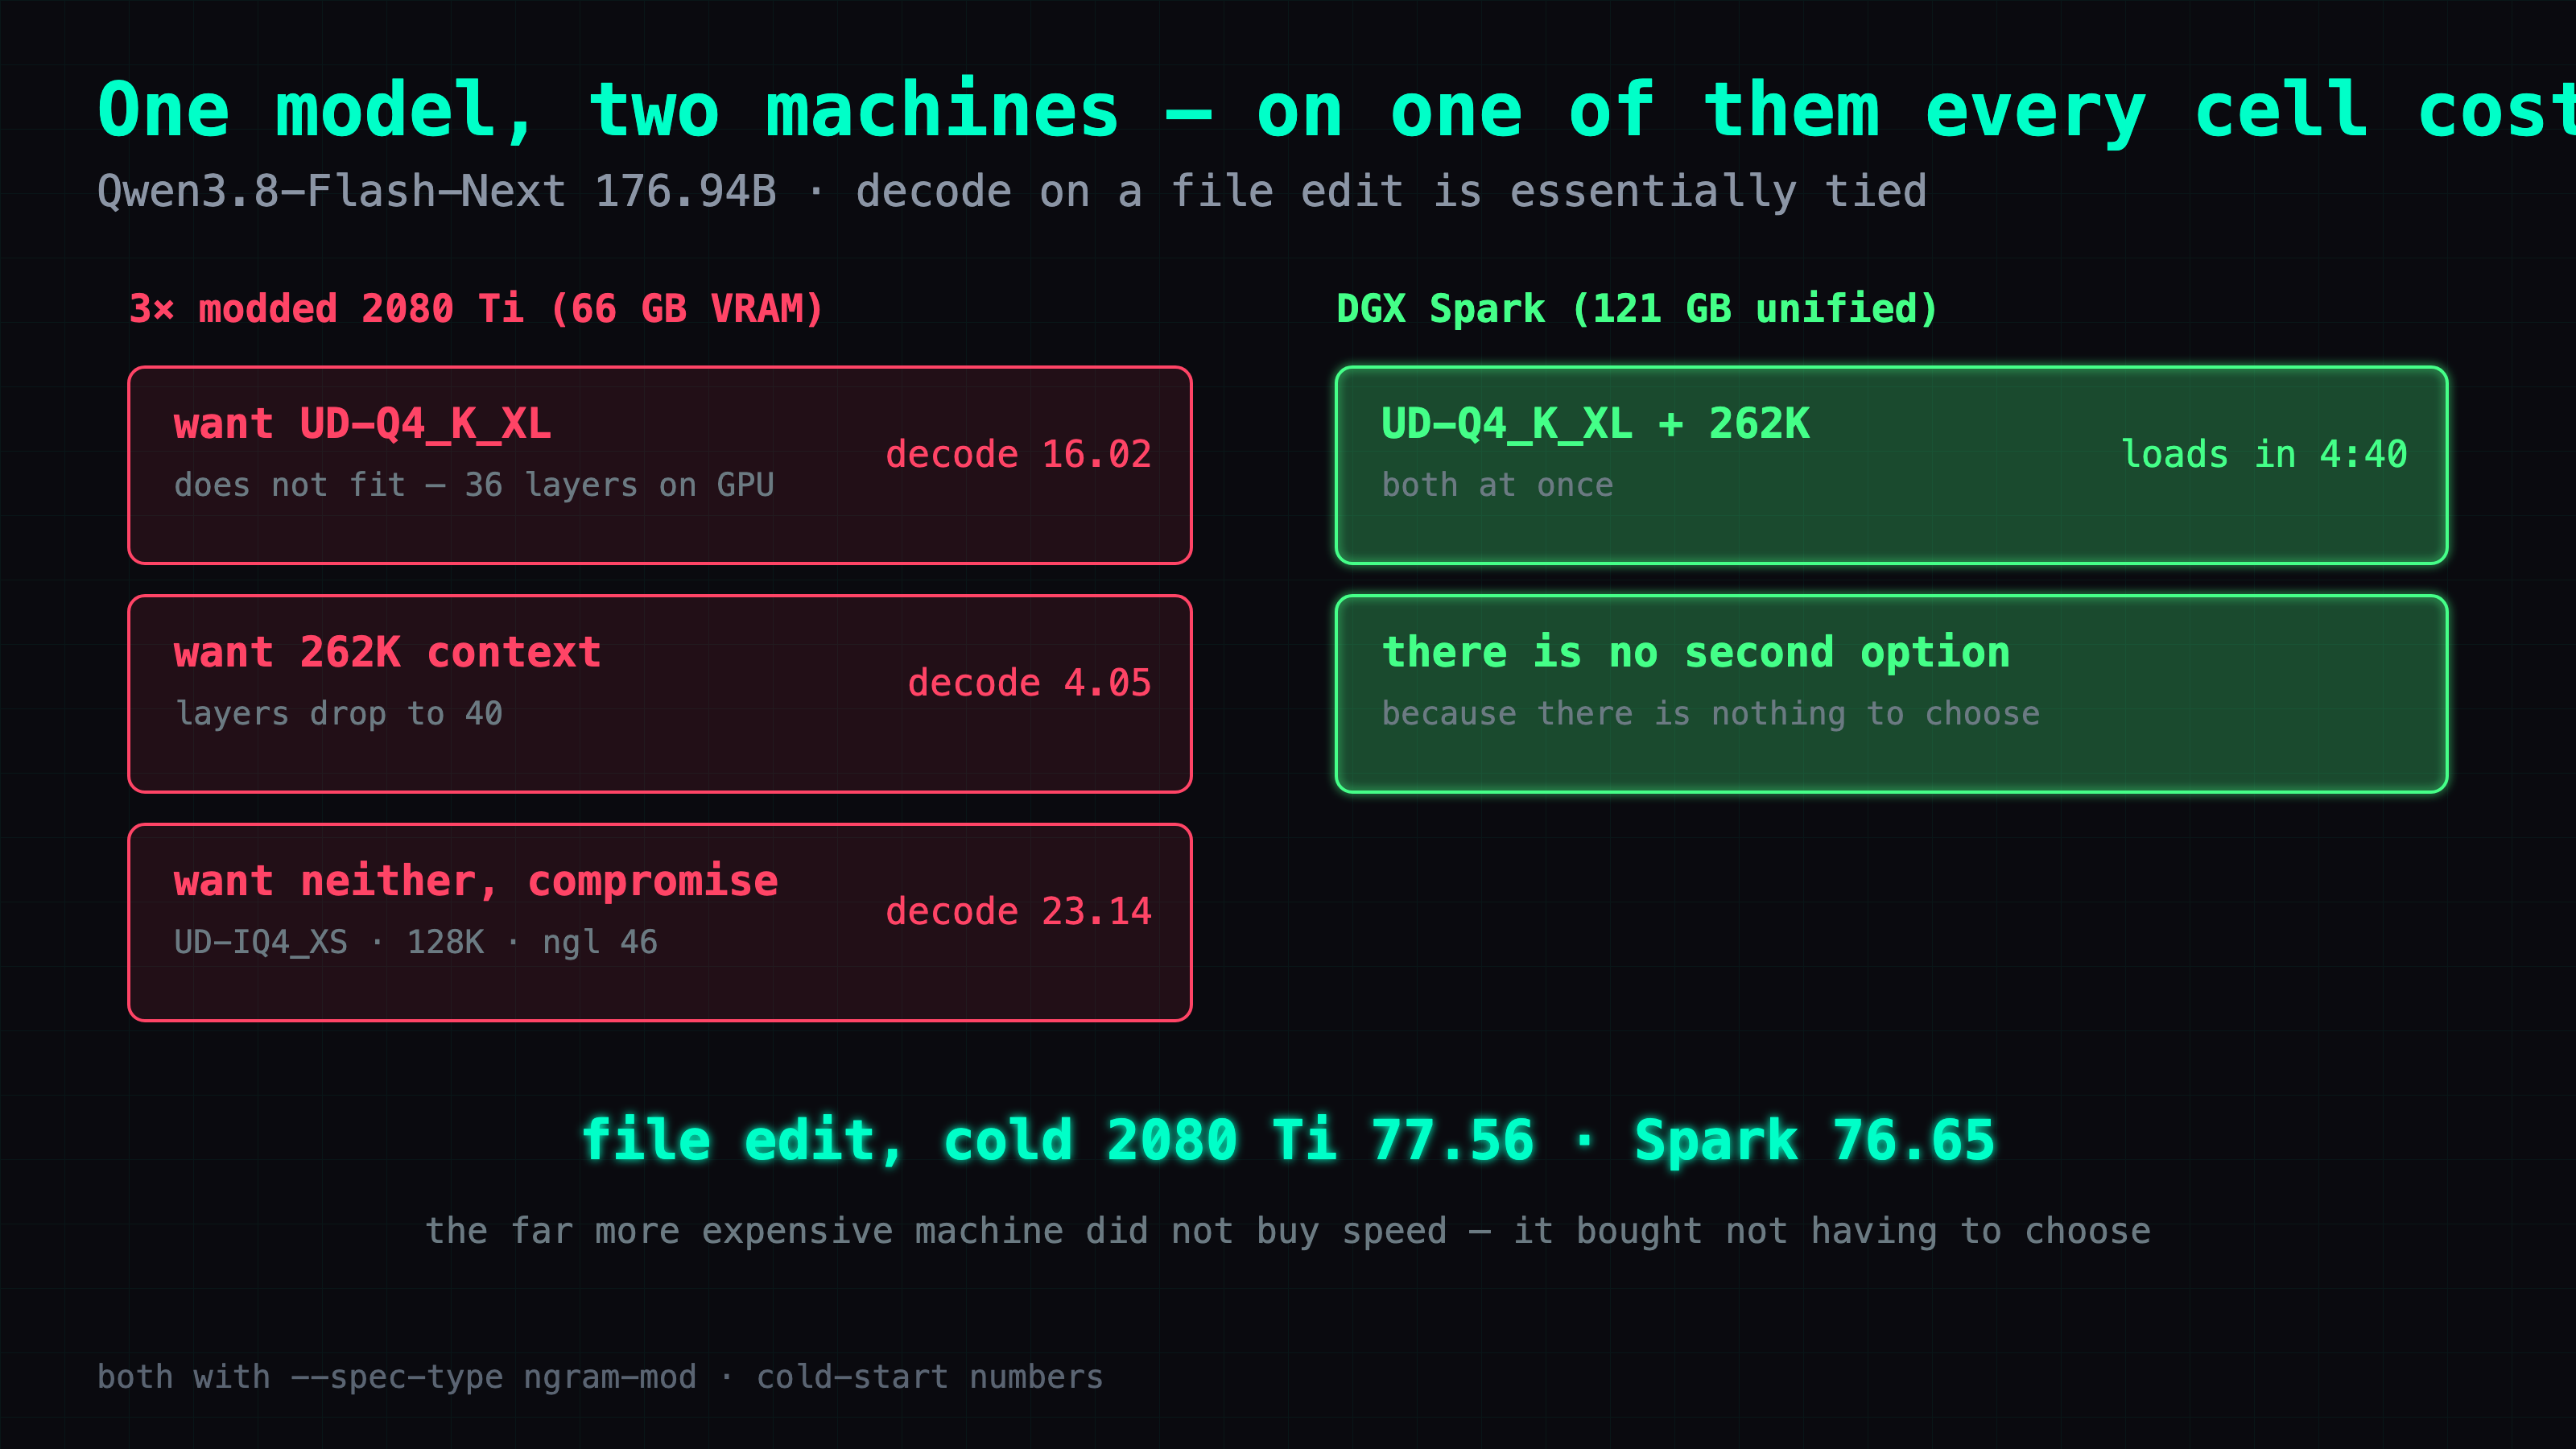
That is the whole difference I measured. On three modded RTX 2080 Ti 22G cards, 66 GB of VRAM total, every operating point for this model costs something. Want the better UD-Q4_K_XL quant? 104 GiB does not fit, only 36 of 48 layers land on the GPU, and decode drops from about 25 tok/s to 16.02. Want the model's native 262,144 context? Layers fall from 48 to 40 and decode at full depth is 4.05 tok/s. Every cell in that grid trades something away. I wrote that box up in A 177B MoE on Three Modded 2080 Tis.
3× 2080 Ti, 66 GB of VRAM: pick the quant tier or pick the context. DGX Spark, 121 GB in one pool: pick both.
This is Part 43 of the DGX Spark series. Part 42 measured this box's memory bandwidth ceiling and found single-stream decode already sitting at 85% of it. This part puts the largest model I have run on it into that same pool: GB10, 121 GB unified memory, 104 GiB of weights loading directly, 262,144 context opening directly. There is no tradeoff left to calculate.
Why 104 GiB of weights fit in 121 GB of memory
104 against 121 sounds like it should not work, and it is not even close to tight. The reason is in what those parameters are.
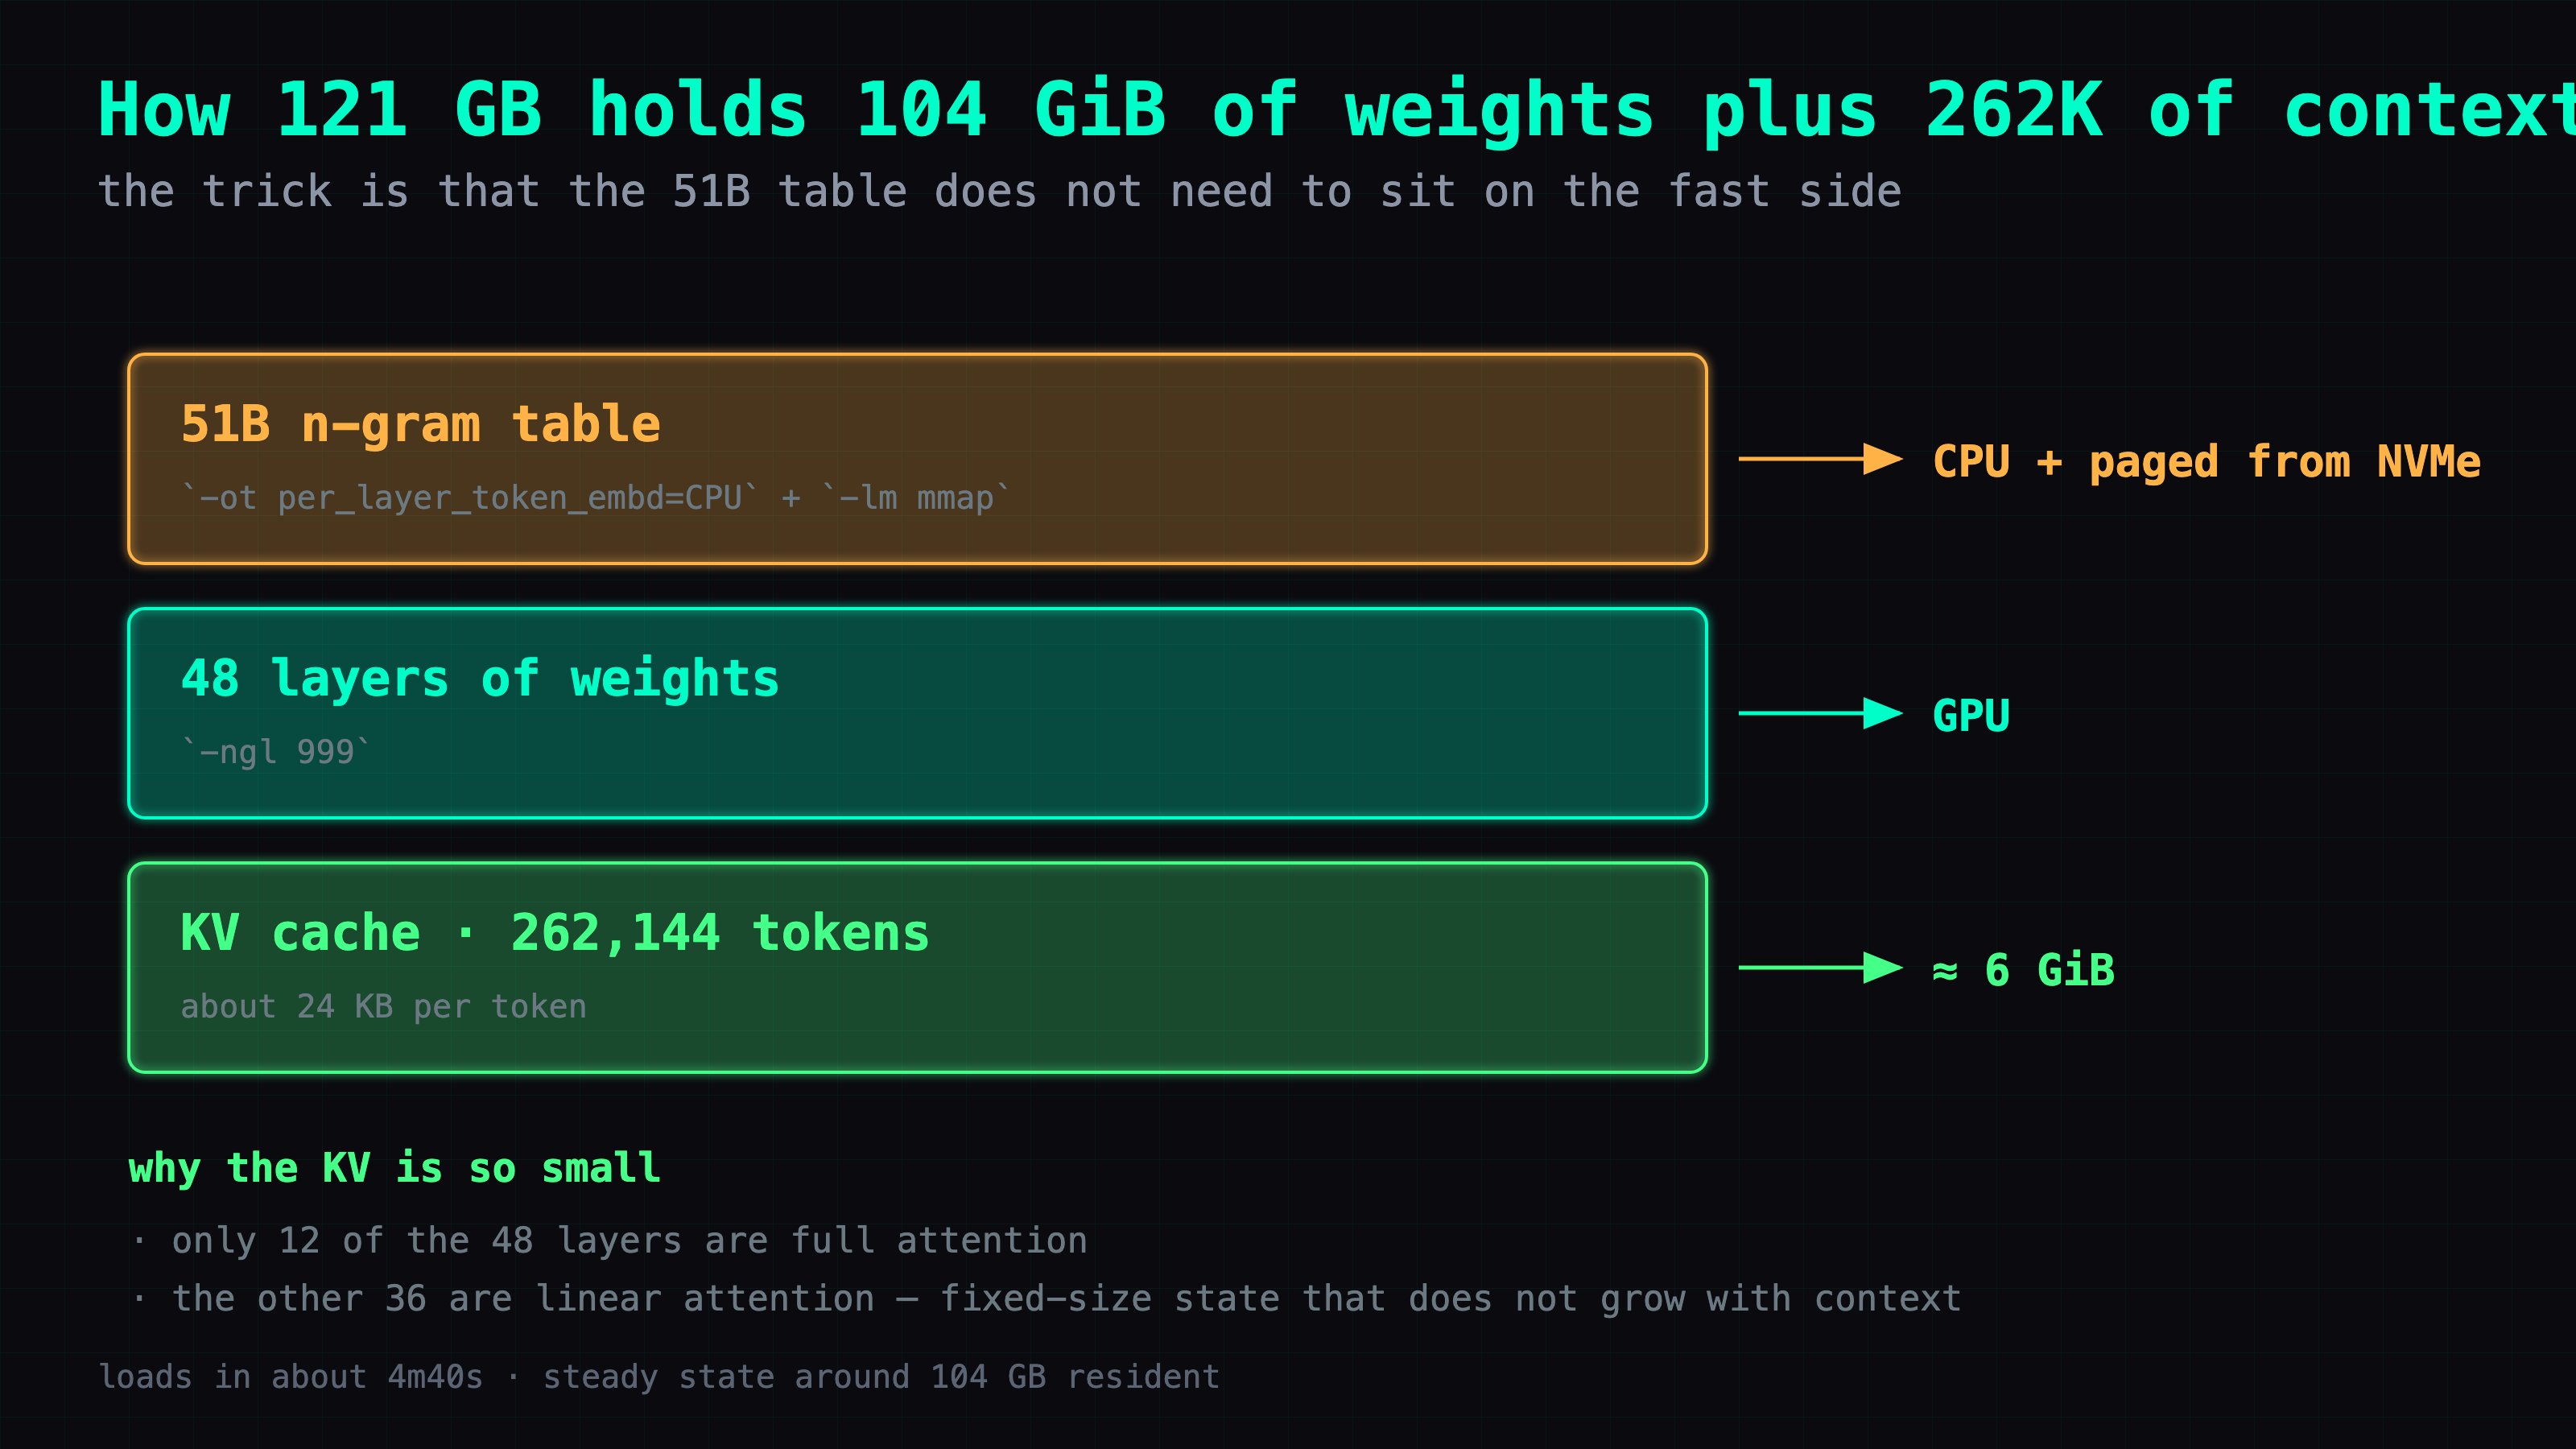
Qwen3.8-Flash-Next reports 176.94B parameters. Of those, roughly 51B is an n-gram lookup table — a structure the model indexes into a few rows at a time, not a weight matrix it multiplies against. Every token pulls a handful of rows out of it. A sparse gather like that does not need to sit on the fast side of the machine, so it can be pinned to the CPU and paged from NVMe through mmap, and the GPU side has room left over.
Look at the last row. That number is the reason a quarter-million tokens is affordable here at all.
| what | where it lives | size |
|---|---|---|
per_layer_token_embd (the 51B table) | CPU, paged from NVMe via mmap | — |
| the other 48 layers | GPU | — |
| dense K/V cache at 262,144 tokens | GPU | ~6 GiB |
Six gibibytes for 262,144 tokens works out to about 24 KiB per token of dense K/V, which is small enough to look like a typo next to a normal transformer. It is small because only 12 of the 48 layers use full attention. The other 36 use linear attention, which keeps a fixed-size running state instead of a per-token cache, so its memory does not grow as the conversation gets longer. Twelve layers of real KV plus thirty-six layers of constant state is why the dense K/V is that cheap.
It is not the whole bill, though. The same commit also allocates a QSA indexer cache for those twelve layers, roughly another 9 KiB per token. Add them and the allocation that actually grows with context is about 33 KiB per token — around 8.25 GiB at 262,144. Still cheap for this much context. Just don't budget from the 6.
The build: one cmake flag decides whether your output means anything
Support for qwen4exp arrived through PR #27742, which merged on 2026-08-27 — it was still open while I was measuring. Every number here comes from commit 6c5afc86a of that branch, pinned before the merge.
git clone https://github.com/ggml-org/llama.cpp ~/llamacpp-qwen4exp
cd ~/llamacpp-qwen4exp
git fetch origin pull/27742/head:pr27742 && git checkout pr27742

cmake -B build -DGGML_CUDA=ON \
  -DCMAKE_CUDA_ARCHITECTURES=121 \
  -DCMAKE_CUDA_COMPILER=/usr/local/cuda-13.0/bin/nvcc \
  -DGGML_NATIVE=OFF -DLLAMA_CURL=OFF -DCMAKE_BUILD_TYPE=Release
cmake --build build --target llama-server -j 16
-DCMAKE_CUDA_COMPILER cannot be omitted. On this box /usr/local/cuda goes through alternatives and resolves to 13.2. Someone in the PR thread ran a clean A/B — same source, same cmake flags, same GGUF, only that one parameter different — and the 13.2 build produced deterministic garbage output without throwing an error, without tripping an assert, and with the server starting and answering normally. The same binary runs other architectures fine, so the binary is the last thing you would suspect. That A/B is not mine. I took the conclusion and avoided the version; I did not reproduce the broken build.
-DGGML_NATIVE=OFF is also required. Leave it on and the ggml-cpu ARM feature detection emits compiler flags that gcc rejects on Grace.
One more thing that will make you stare at your terminal: the same cmake configure prints two CUDA version numbers.
-- The CUDA compiler identification is NVIDIA 13.0.88-- Found CUDAToolkit: /usr/local/cuda/targets/sbsa-linux/include (found version "13.2.78")
The first line is the compiler you are actually building with. The second is just the headers path CMake located. Do not read it as either a failure or a pass.
Smoke-test the binary with a small GGUF you already have before downloading 104 GB. I had UD-IQ1_S (68 G) on disk, so I loaded it and asked The capital of France is:
Paris. Given a list of countries and their capitals, answer the question...
That one check saved four hours. If you download first and only then find the binary emitting garbage, that time is gone and you have no way to tell a bad build from a bad download.
The config to copy: 262,144 context, 4m40s to load
build/bin/llama-server \
  -m Qwen3.8-Flash-Next-UD-Q4_K_XL-00001-of-00004.gguf \
  --alias qwen38-flash-next \
  -lm mmap -ot per_layer_token_embd=CPU \
  -ngl 999 -c 262144 -np 1 \
  --spec-type ngram-mod \
  --temp 1.0 --top-p 0.95 --top-k 20 \
  --host 127.0.0.1 --port 8199
Load takes about 4 minutes 40 seconds, and steady state sits around 104 GB resident.
Four of those flags carry weight:
-ot per_layer_token_embd=CPUtogether with-lm mmapis what makes the memory layout above possible. Without them the 51B table goes where everything else goes, and the fit stops working.-ngl 999puts the rest on the GPU. There are 48 layers, so any number past 48 means all of them.--spec-type ngram-modturns on speculation with no draft model — more on what that is worth below.-np 1must be explicit. More than one in-flight request hits an indexer cache assert inqwen4exp.cppand the server aborts. This is a branch under review, not a shipped feature, and one slot is the supported configuration today.
76.65 tok/s on a file edit, 20.51 on prose: one number cannot describe this
Speculation makes a single throughput figure meaningless, so here are four. The number to quote is the second row.
| task | tok/s |
|---|---|
| prose, cold | 20.51 |
| file edit, cold | 76.65 |
| file edit, repeat 2 / 3 | 88.02 / 78.74 |
| prefill, 18,092-token prompt | 366.19 |
The spread comes from how ngram speculation works. It needs no draft model: it drafts the next few tokens from repetition already sitting in the context, and the model verifies them. Hand it a file and ask for one line changed, and nearly every output token already exists in the input, so the drafts land. Ask for prose and there is nothing to copy, so it drafts nothing and you get the base rate.
A file edit is almost entirely repetition of its own input. Prose is none of it. That is the whole 20-to-77 spread.
Quote 76.65, not the 88. Runs two and three are fast partly because ngram now recognizes my own previous answer sitting in the context. That is the speed of asking the same question twice, not the speed of the setting.
What it can answer: 6/7 on a probe built to separate quant tiers
I keep a seven-question probe for exactly one job — telling quant tiers apart. Explain speculative decoding. Multi-step age reasoning. Write merge_intervals. Multi-step arithmetic with an exact output format. Three instruction constraints held at once. A program of 40 to 60 lines. Strict JSON.
UD-Q4_K_XL scored 6/7. The single failure was the program-length question: the code compiled under py_compile, passed every assert I wrote, and came in at 38 non-blank lines against a criterion demanding 40 to 60. That is my rubric being picky, not the model failing.
Caveat, and it matters. Those seven questions ran on the other box — 3× 2080 Ti — against the same
UD-Q4_K_XLweights and the same frozen criteria. Same weights, different machine. I did not re-run them on the Spark. Read the score as a property of the quant, not as a measurement of this hardware.
DGX Spark vs 3× 2080 Ti: decode ties, the tradeoff does not
Same model, same week, two very different boxes. Look at row two.
| DGX Spark | 3× 2080 Ti | |
|---|---|---|
| quant it can run | UD-Q4_K_XL, 104 G | UD-IQ4_XS, 88 G |
| file edit, cold | 76.65 tok/s | 77.56 tok/s |
| cost of the 262K context | none | decode falls to 4.05 |
Decode is essentially tied. The much more expensive machine did not buy speed.
What it bought is row three. On the three-card box every extra context window and every step up in quant tier has to be paid for out of something else — layers move to the CPU, or the context has to shrink, or you take the smaller quant. Here neither costs anything, because there is one pool and everything is already in it.
That difference is invisible if you only ever run one kind of job. Pick a quant, pick a context, and both boxes give you roughly the same tokens per second. It shows up the moment you want a better quant and a whole codebase in context at the same time, which on the 2080 Ti box is the one combination you cannot have.
Deep dive: a stalled download, a machine that vanished, and one output that changed
Skipping this section does not affect anything above — the recipe stands on its own. What follows is the debugging log: three problems, what I assumed each one was before I looked, and where those assumptions were wrong.
Why was a 104 GiB download crawling at 74 KB/s?
The problem. hf download was pulling the four shards of UD-Q4_K_XL and the log's own estimate was around 74 KB/s. At that rate the download finishes some time next month.
What I expected the fix to be. My home uplink, or Hugging Face throttling me. Both are common causes of a slow download, and both have the same remedy: give up and retry off-peak. I was about to do that.
What I did instead. Ran a range request straight at the Hugging Face CDN as a control — same host, same file, none of the Python client in the path. It came back at about 4.30 MB/s.
Result. Roughly 58× the rate the downloader was reporting, so the network was never the constraint. The culprit is the Xet transfer path in huggingface_hub 1.28.0 doing adaptive concurrency: I watched it walk itself down from 10 parallel streams to 1 and stay there. I kept the partial download, restarted with the Xet path disabled, and the three large shards came down over plain parallel HTTP:
HF_HUB_DISABLE_XET=1 hf download unsloth/Qwen3.8-Flash-Next-GGUF \
  --include "*UD-Q4_K_XL*"
Total: 1:28:26.
Where my expectation was wrong. I reached for "the network is slow" because that is the base rate — most slow downloads really are the network. What I skipped is that the base rate only applies when you have no way to check. Here checking cost one curl with a Range header and about thirty seconds. The general shape: when a suspect layer reports a number, measure one path to the same destination that does not go through that layer. If the two numbers agree the layer is innocent, and if they disagree you already know where to look.
The box dropped off the network for three minutes mid-load
The problem. During the 262K load, SSH died. Then Tailscale stopped answering too. The machine was simply gone.
What I expected the fix to be. An OOM kill had taken the box down, and 104 GB of weights into a 121 GB pool was the obvious reason why. I was already composing the dmesg command to go read the postmortem and planning to back the context off to 131,072.
What I did instead. Waited. Roughly three minutes later Tailscale came back on its own.
Result. No reboot, and nothing had been killed:
dmesg -T | grep -iE 'oom|killed process' # no output
No OOM kill anywhere in dmesg. The server was healthy afterwards, the model had loaded fine, and the total load time was 4m40s — the blackout sat in the middle of it. Nothing needed fixing.
Where my expectation was wrong. I read "unreachable" as "dead," and those are different claims about different subsystems. What actually happened is that the network stack was not getting scheduled while the load saturated memory and I/O. A dropped connection is a symptom that a machine is busy; it is not evidence of a cause of death. This box has exactly one memory pool, and pulling 104 GB into it genuinely occupies the thing — including the parts of the kernel that would have answered my ping. The test that separates the two cases is cheap and I skipped it: if it were an OOM kill the process would be gone when the box came back, and it was not.
The third identical request produced different output
The problem. I sent the same file-edit request three times to check that speculation was not altering results. Runs 1 and 2 had identical SHA256. Run 3 differed. Speculative decoding is not supposed to be able to do that — it verifies every drafted token against the model, so the text should be indistinguishable from an unspeculated run.
What I expected the fix to be. That speculation is not exact on this architecture, or that the qwen4exp branch has a verification bug. I had the llama.cpp speculation path open and was ready to go read how ngram-mod accepts drafts.
What I did instead. Read the diff first. There was exactly one difference: run 3 omitted the Markdown code fence — the three-backtick python opener and its closing line. The program body was byte-identical all three times.
Result. The server in the recipe above runs with --temp 1.0 --top-p 0.95 --top-k 20, and my requests did not override temperature. A fence token is exactly the kind of near-tied choice that stochastic sampling flips. This is sampling randomness, and there is no bug.
Where my expectation was wrong. I conflated two guarantees that sound alike.
Speculation guarantees the distribution you sample from. The sampler still rolls the dice.
Identical text is a property of a deterministic sampler, not of exact speculation, and nothing hands it to you at temperature 1.0. I was about to spend an evening in the speculation code looking for a bug that my own sampler settings explain. Settling it properly needs temperature 0 or a fixed sampler seed, and I have not run that here. On the 2080 Ti box I did run the same model at temperature=0 three times and got three identical SHA256s — that is the valid consistency evidence, and it is on the other machine.
Environment
- DGX Spark: GB10, 121 GB unified memory, sm_121a, aarch64, driver 580.159.03
- llama.cpp: PR #27742 at commit
6c5afc86a, built with CUDA 13.0.88,-DCMAKE_CUDA_ARCHITECTURES=121(CMake rewrites this to121afor this chip) - Model: unsloth/Qwen3.8-Flash-Next-GGUF,
UD-Q4_K_XL, four shards, about 104 GiB - Prefill prompt: the API reported 18,134 prompt tokens, 42 of them cached, so 18,092 were actually evaluated — the 366.19 tok/s is over that evaluated count. My first candidate was only 5,680 tokens, which is too short to measure prefill with — fixed per-request overhead dominates and you end up ranking setup cost. Re-ran with an 18,134-token prompt; the 366.19 tok/s in the table is the 18,092 tokens llama.cpp timed on that run.
FAQ
- Can a DGX Spark run Qwen3.8-Flash-Next at the full 262,144 context?
- Yes, and without trading anything for it. The UD-Q4_K_XL quant is about 104 GiB and GB10 has a 121 GB unified pool. Pin the 51B n-gram table to the CPU with `-ot per_layer_token_embd=CPU`, put the remaining 48 layers on the GPU with `-ngl 999`, and set `-c 262144` directly. The KV cache for a quarter-million tokens is only about 6 GiB, because just 12 of the 48 layers use full attention. Load takes about 4 minutes 40 seconds and steady state sits near 104 GB resident.
- Why does -DCMAKE_CUDA_COMPILER matter when building llama.cpp on a DGX Spark?
- Because `/usr/local/cuda` on this box goes through alternatives and points at CUDA 13.2, and a 13.2 build of the qwen4exp branch produces deterministic garbage without throwing an error, without tripping an assert, and with the server starting and answering normally. Someone in the PR thread ran a clean A/B — same source, same cmake flags, same GGUF, only that one parameter different. Point it at `/usr/local/cuda-13.0/bin/nvcc` explicitly and smoke-test with a small GGUF before downloading 104 GB.
- Is a DGX Spark faster than three modded 2080 Tis on this model?
- Not on single-stream decode. A cold file-edit task measures 76.65 tok/s on the Spark and 77.56 tok/s on 3× 2080 Ti 22G. What the Spark buys is the absence of a tradeoff: on the three-card box the 104 GiB quant only puts 36 of 48 layers on the GPU, and running the native 262,144 context drops decode to 4.05 tok/s. On the Spark neither of those costs exists.
Read next
- 2026-08-30[Benchmark] GLM-5.3-Flash 320B on One DGX Spark: 15.4 tok/s with Vision Working
A 320B-A18B MoE at UD-Q2_K_XL fits in 121 GB. 15.40 tok/s on English prose, 16.23 on Chinese, 23.64 on Three.js code. Vision works only if you drop --spec-type.
- 2026-06-01[Benchmark] NVFP4 W4A4 beats FP8 on a DGX Spark MoE: 67 vs 52 tok/s once CUDA graphs fire
On a GB10 DGX Spark, NVFP4 W4A4 went from 23 to 67 tok/s the moment I dropped --enforce-eager — beating FP8 by 29% and saving 16GB. The catch from Part 32 was real, just dense-only.
- 2026-05-01[vLLM] Nemotron 3 Nano on DGX Spark: 74.75 tok/s NVFP4 — 11.5% Past the Public Baseline
Ten days ago I called NVFP4 a trap on DGX Spark GB10. Today the same hardware hits 74.75 tok/s on Nemotron 3 Nano W4A16, beating my own FP8 ceiling and the public 67 tok/s forum number. The 4-layer patch stack, the quant variant choice, and the bandwidth math behind it.
- 2026-04-28[llm-compressor] Self-Quantizing a 35B Abliterated MoE to FP8 on DGX Spark: 4 OOMs, 3 Prefix Bugs, and Why the First Success Wasn't Actually FP8
Quantizing huihui-ai's Qwen3.6-35B-A3B abliterated to FP8 for vLLM on a 128 GB UMA box. Seven attempts, two distinct OOM modes, a model class that silently breaks vLLM's loader, and why streaming save_pretrained returns BF16 not FP8. Final result: 51.72 tok/s, 1.68× BF16.
Don't miss the next one
Subscribe, and you won't.
One-click unsubscribe anytime.