DGX Spark · part 44
[Benchmark] GLM-5.3-Flash 320B on One DGX Spark: 15.4 tok/s with Vision Working
❯ cat --toc
- The flagship does not fit; Flash is a different model that does
- Take UD-Q2_K_XL, not the officially recommended IQ3_XXS
- CUDA toolkit 13.2 builds clean, serves fine, and returns garbage
- 262K and 32K both load in 85 seconds
- Chinese prose runs 5.39% faster than English, and the draft acceptance says why
- Three.js code decodes at 23.64 tok/s, 52% faster than prose
- Vision works, but you have to drop one flag
- It is the slowest of the four models on this box
- Takeaways
- Deep dive: why an image request returns HTTP 500 when `--spec-type` is on
- The error names the draft context, not the vision path
- Is this unimplemented, or a path that quietly does not take effect?
- The upstream fix is one file, and I measured it rather than trusting it
- Deep dive: two operational traps that each cost an hour
- An empty `content` field is not the model failing the task
- `llama-server --help` gets truncated when the GPU is busy
- Environment
TL;DR
GLM-5.3-Flash (320B-A18B) at UD-Q2_K_XL is 108.72 GB and fits one DGX Spark's 121 GB pool with a 262,144-token context, ready in 85 seconds. English prose decodes at 15.40 tok/s, Chinese at 16.23, Three.js code at 23.64; the spread tracks MTP draft acceptance, 36.01% versus 41.03%. Vision works, but only with --spec-type off: the draft runs in its own KV cache and image embeddings leave a hole in it, so every image request returns HTTP 500. Build with CUDA toolkit 13.0. A 13.2 build compiles clean, serves fine, and returns garbage.

A cargo bike is slower than a road bike, and that is not the point of it. You buy one because it carries the kid, the groceries and the dog at the same time, and no road bike does any of that at any speed.
GLM-5.3-Flash is the cargo bike of the four large models I have running on this DGX Spark. It decodes English prose at 15.40 tok/s, which is last place by a wide margin. What it does that the other three do not: it reads images, it ships under MIT, and its architecture declares a 1,048,576-token position space.
This is Part 44 of the DGX Spark series. Part 43 put a 177B MoE at its full 262K context into this same pool, and an earlier part asked whether 2-bit stays usable at 284B. This one is the largest model I have loaded on the box, and the first that does something the fast ones cannot do at all.
The flagship does not fit; Flash is a different model that does
The flagship GLM-5.3 is 744B-A40B. Its smallest GGUF is UD-IQ1_S at 216.72 GB, nearly twice what a 121 GB machine has. There is no quant tier low enough to close that. I got these sizes by summing the file listings from the HuggingFace API rather than estimating from parameter count, because a 1-bit MoE's on-disk size is not a clean function of its parameters.
GLM-5.3-Flash is 320B-A18B and does fit. It is not a shrunk flagship — it is a separate base model. Its config.json reports the architecture as glm5_next / Glm5NextForConditionalGeneration:
- 288 routed experts plus 1 shared, 8 active per token
- 45 layers, alternating three
linear_attentionblocks to onedeepseek_sparse_attention - one MTP layer (
num_nextn_predict_layers: 1) — MTP is multi-token prediction, a small head that guesses the next few tokens so the main model can verify several at once instead of generating them one at a time max_position_embeddings: 1048576- a
vision_configblock, so it is natively multimodal rather than bolted together from a separate vision model
The license is MIT; the flagship ships under the GLM-5.3 License. For anything you plan to put in front of users, that difference is larger than any of the numbers below.
Take UD-Q2_K_XL, not the officially recommended IQ3_XXS
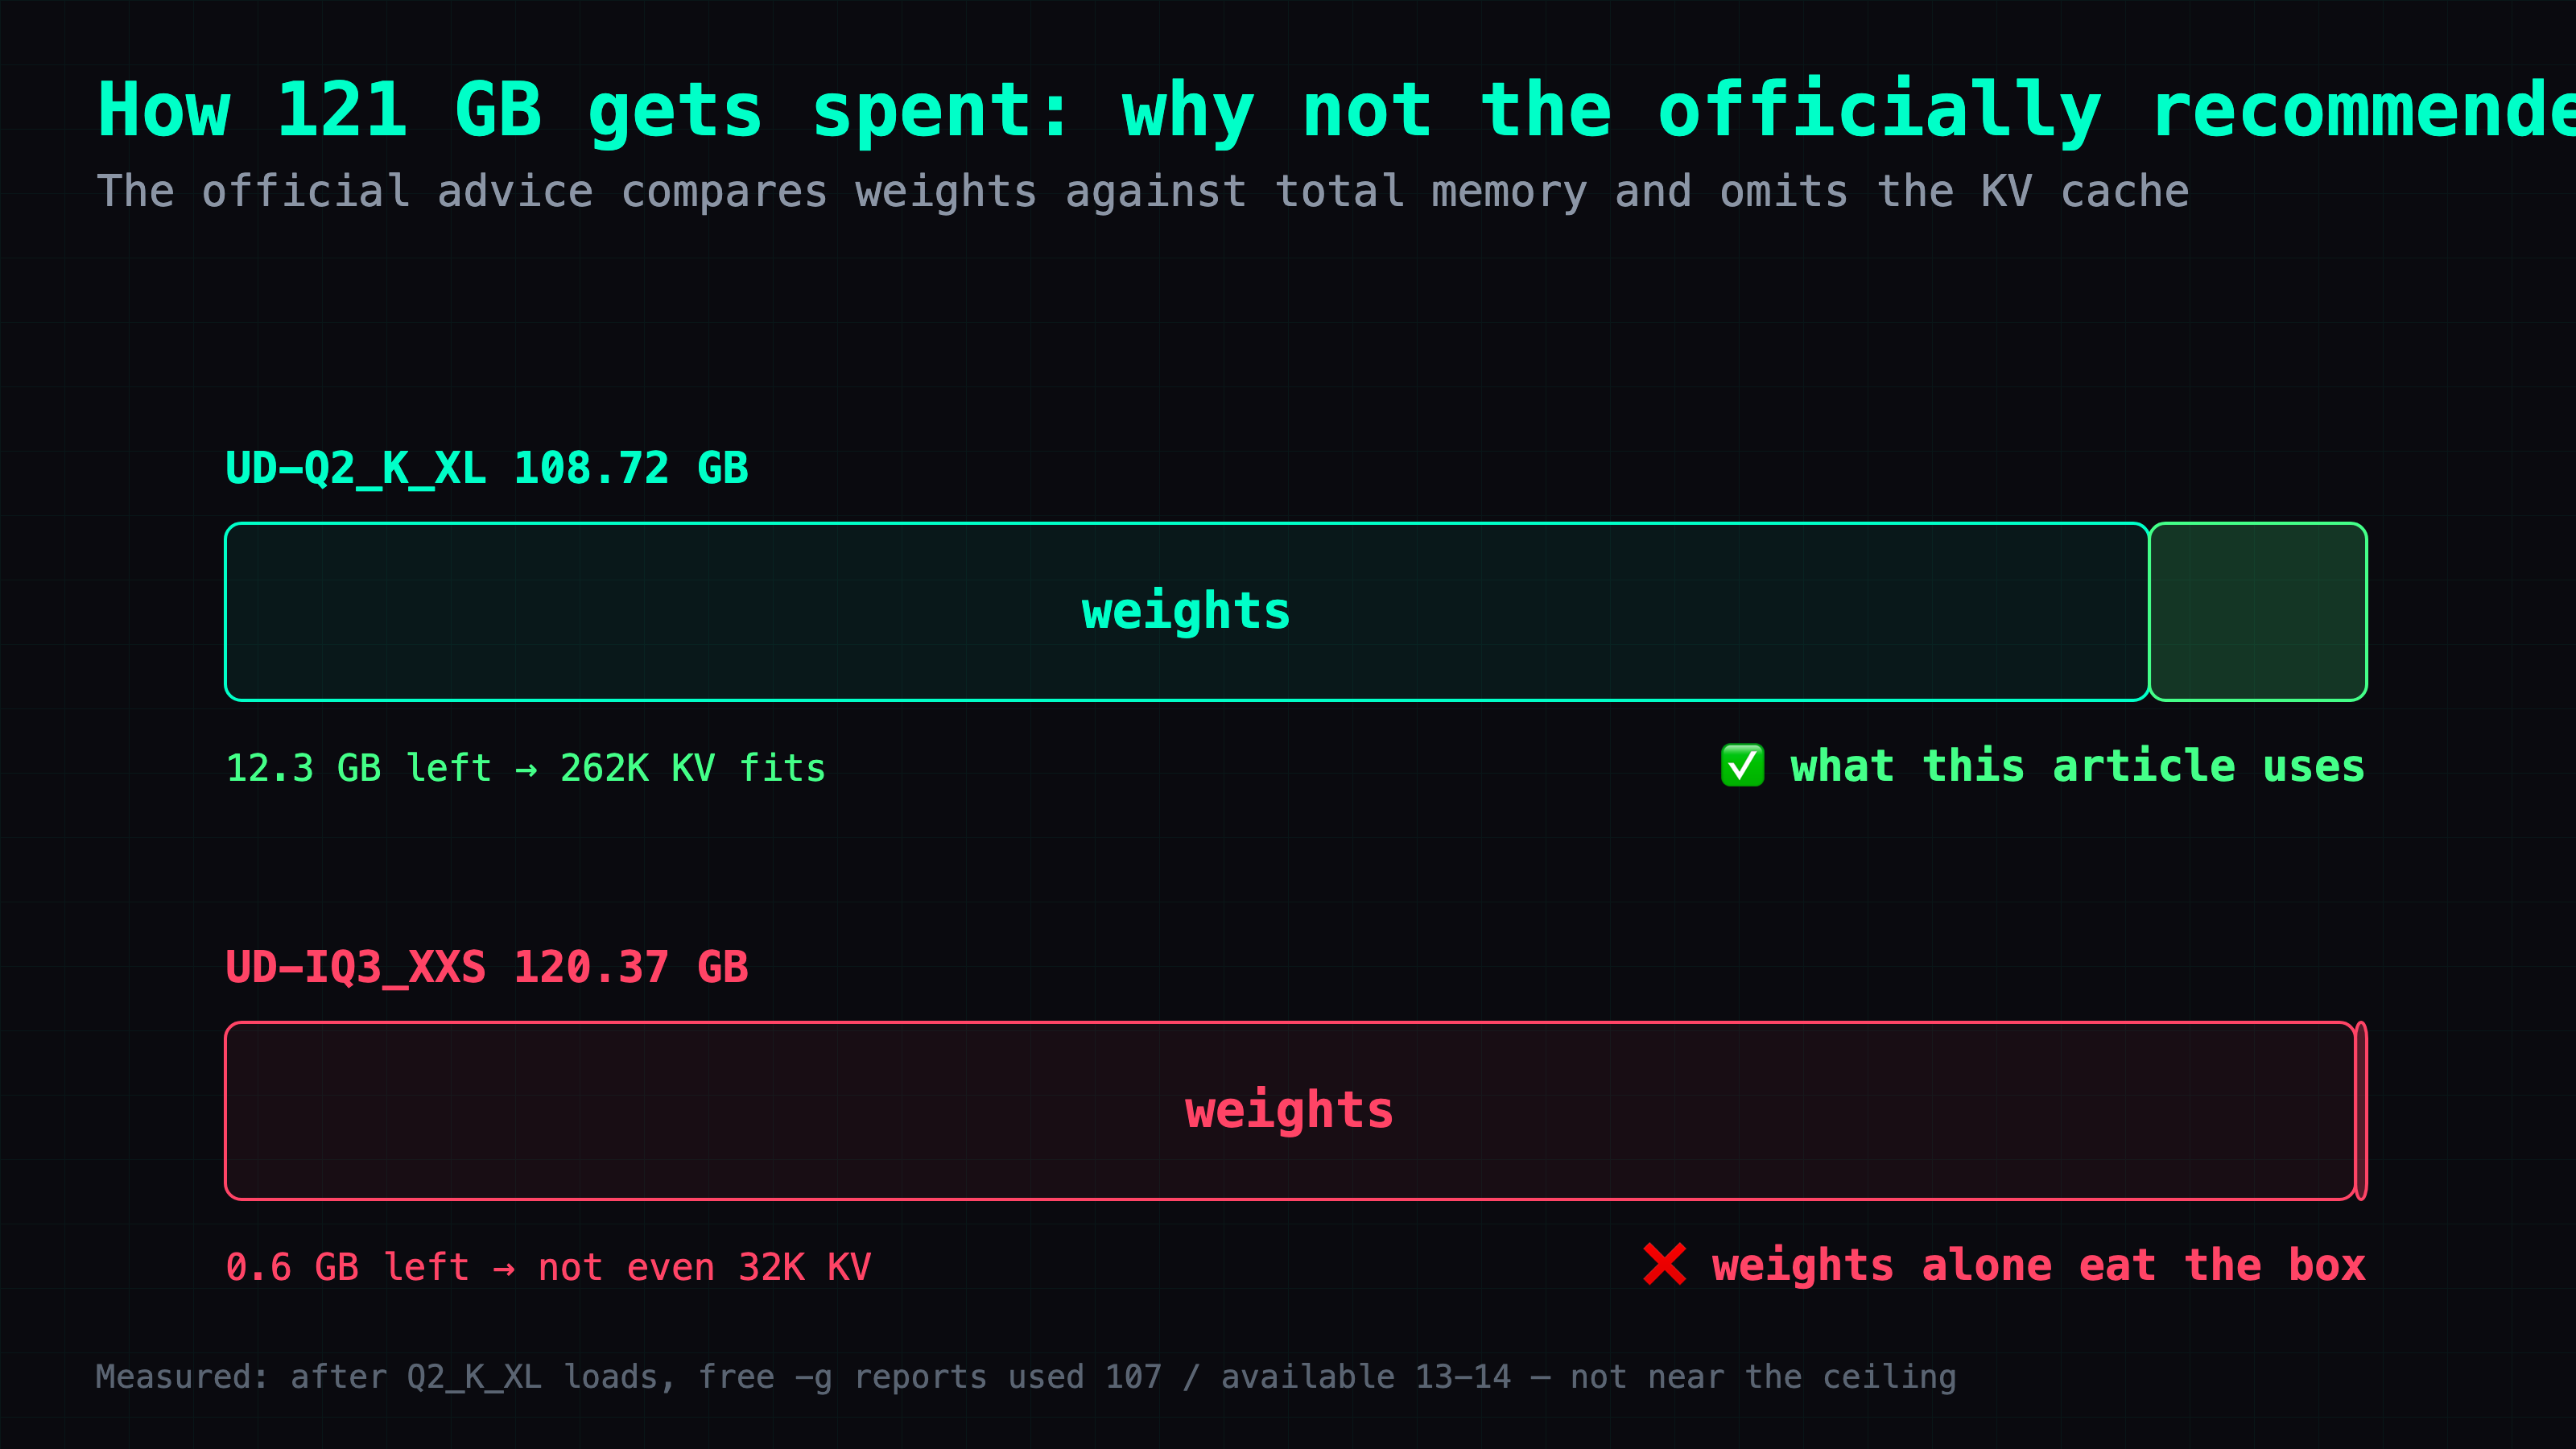
Here is the quantization ladder from unsloth/GLM-5.3-Flash-GGUF. The row that matters is the third one.
| quant | weights |
|---|---|
| UD-IQ1_S | 93.09 GB |
| UD-IQ1_M | 97.58 GB |
| UD-Q2_K_XL | 108.72 GB |
| UD-IQ3_XXS | 120.37 GB |
| UD-Q3_K_XL and up | 147.54 GB+ |
Unsloth's own docs point 128 GB machines at UD-IQ3_XXS. That advice compares weights against total memory and stops there. Put 120.37 GB of weights into a 121 GB machine and there is nothing left for the KV cache — not for 262K, not for 32K, not for anything. The recommendation is correct about the weights and silent about the rest of the bill.
UD-Q2_K_XL leaves the room the KV cache needs. After the model loads:
$ free -g
              total   used   free   shared  buff/cache   available
Mem:            121    107      2        0          12          13
107 GB used, 13-14 GB available. That headroom is what pays for the context.
If you want vision, also pull mmproj-F16.gguf (1.13 GB). It is the vision projector and it is a separate file from the four weight shards.
CUDA toolkit 13.2 builds clean, serves fine, and returns garbage
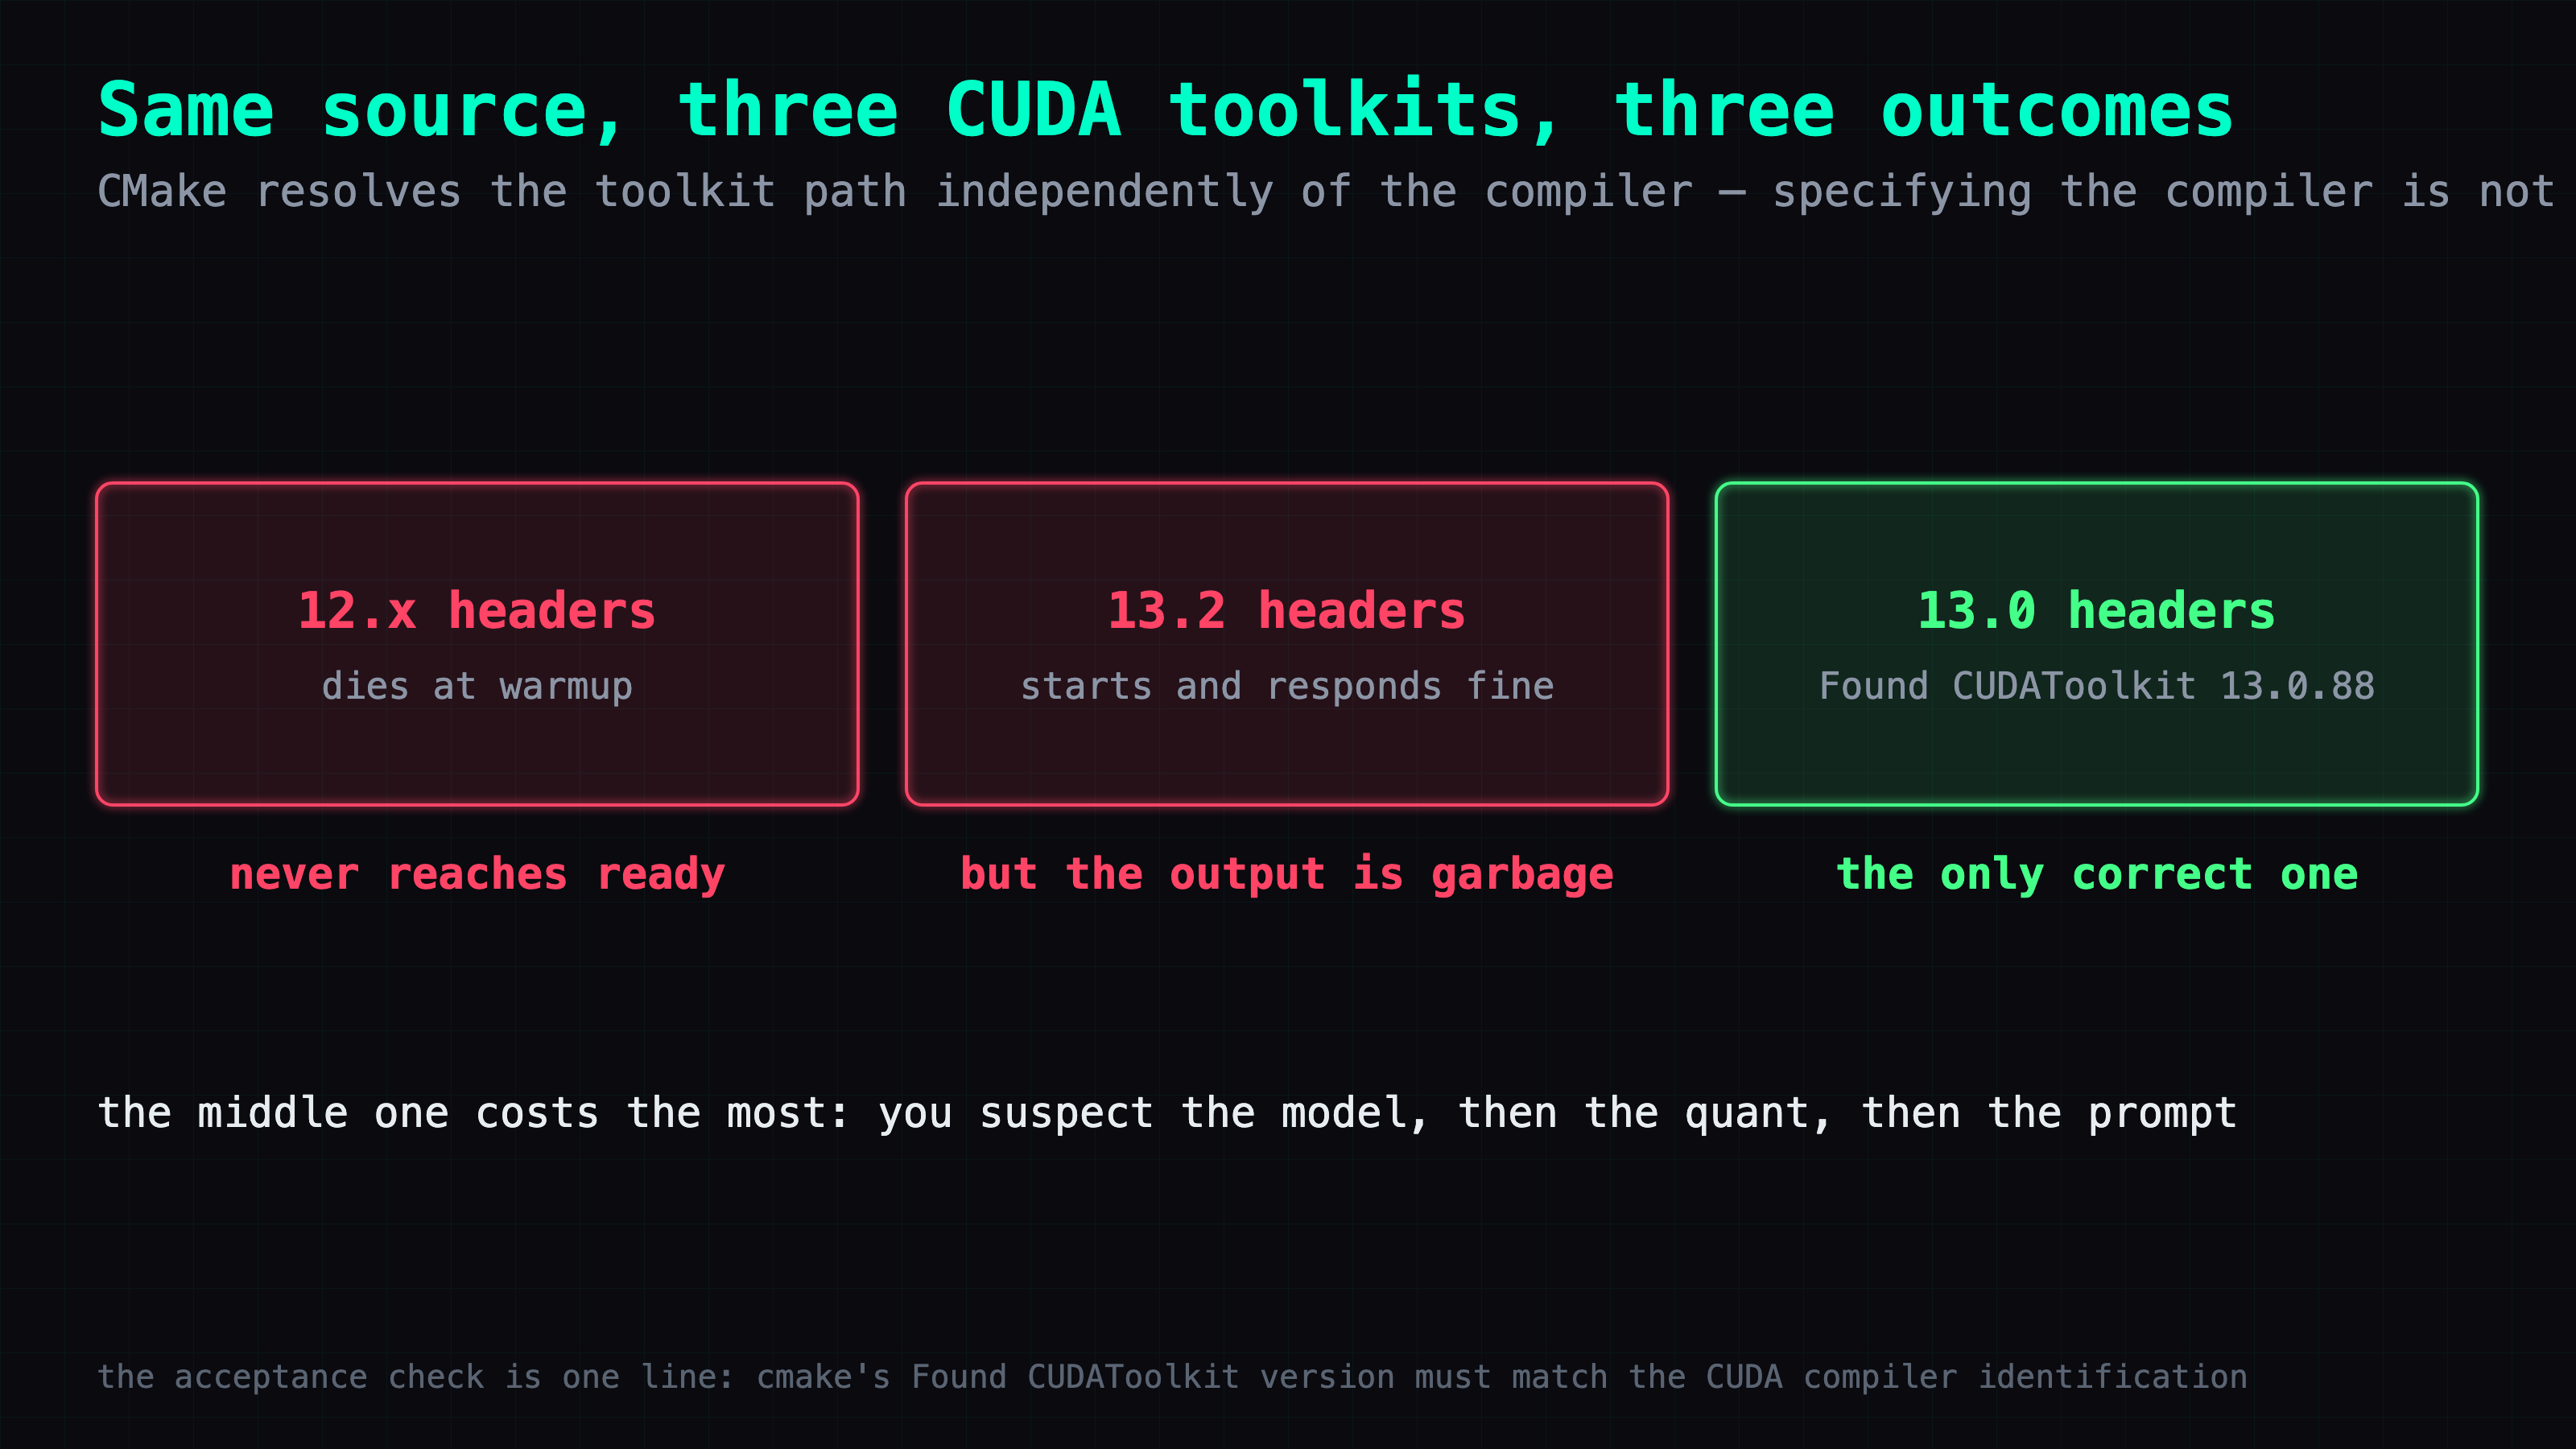
This is the one thing on the page that will cost you an afternoon if you get it wrong, because two of the three failure modes do not look like build problems.
| toolkit | what you get |
|---|---|
| 12.x | server dies at warmup with CUDA error: invalid argument, never reaches ready |
| 13.2 | starts, serves, answers every request — output is garbage |
| 13.0 | correct |
The 13.2 row is the dangerous one. There is no error, no assert, no warning. The server comes up, /health is green, requests return 200, and the text is nonsense.
The cause is that CMake resolves the CUDA toolkit path independently of the compiler you specify. Pass only -DCMAKE_CUDA_COMPILER and you get exactly what you asked for — your nvcc — while CMake goes off and searches for headers in its own order, usually finding an older system copy first. A new compiler against old headers means the cudaLaunchConfig_t layout that cudaLaunchKernelEx expects does not match what the headers describe, the kernel launch returns invalid argument, and the process dies on the first soft_max at warmup. That is the 12.x row. The 13.2 row is the same class of mismatch landing somewhere that does not raise.
So pass both, pointed at the same place:
cmake -B build -DGGML_CUDA=ON \
  -DCMAKE_CUDA_ARCHITECTURES=121a-real \
  -DCUDAToolkit_ROOT=/usr/local/cuda-13.0 \
  -DCMAKE_CUDA_COMPILER=/usr/local/cuda-13.0/bin/nvcc \
  -DCMAKE_BUILD_TYPE=Release
There is exactly one line to check, and cmake prints it for you. Two lines of its output sit next to each other:
-- The CUDA compiler identification is NVIDIA 13.0.88
-- Found CUDAToolkit: /usr/local/cuda-13.0/targets/sbsa-linux/include (found version "13.0.88")
If those two versions disagree, that is the bug, and it is the whole acceptance test. You can read it in five seconds and it tells you before the build finishes whether the binary is going to be worth running.
The text-only build comes from a branch that has the GLM-5.3-Flash architecture:
git clone https://github.com/eauchs/llama.cpp.git
cd llama.cpp
# this commit is no longer an ancestor of the branch head — fetch it explicitly
git fetch origin 8a8d0bcc4d5fdf024c457526245bec4bc3a12adc
git checkout 8a8d0bcc4d5fdf024c457526245bec4bc3a12adc
cmake --build build --target llama-server -j
166.57 s to build on this machine.
262K and 32K both load in 85 seconds
llama-server -m GLM-5.3-Flash-UD-Q2_K_XL-00001-of-00004.gguf \
  -ngl 99 -c 262144 -ctk q8_0 -ctv q8_0 -fa on \
  --jinja --spec-type draft-mtp
Ready in 85 seconds, and that number does not move when you drop -c to 32768. Load time here is dominated by pulling 108 GB of weights off disk, not by allocating context, so a smaller window does not buy you a faster start. Useful to know when you are iterating: there is no cheap-to-load configuration to develop against.
Do not try 1M context. Unified memory has no clean OOM wall to stop you. Going over does not kill the process. It starts thrashing swap, and the scheduler stops making progress: you can ssh in and see the banner, but your commands never run. Mine is not sitting next to me, so that cost a long wait for something with no error message at either end.
Start at -c 32768 and work up.
For the record, the build and weights these numbers came from:
llama.cpp 0.3.0-dev (build 10677, commit 8a8d0bcc4),CMAKE_CUDA_ARCHITECTURES=121a-real- weights: 4 shards, 108,720,071,427 bytes
Chinese prose runs 5.39% faster than English, and the draft acceptance says why
Same server, same parameters (max_tokens=1024, temperature=0, reasoning_effort="low"), three runs each, and the only thing that changed between the two sets was the language of the prompt. Look at the third row — that is where the speed comes from.
| English | Chinese | |
|---|---|---|
| median decode | 15.40 tok/s | 16.23 tok/s |
| range over 3 runs | 15.08-15.51 | 15.83-16.69 |
| MTP draft acceptance | 36.01% | 41.03% |
| completion tokens | 333 | 362 |
Chinese accepts about five more percentage points of the draft. Every accepted draft token is one the model did not have to run a separate verification round for, so a higher acceptance rate means fewer forward passes per output token. This is not an inference about why the numbers differ; it is a counter the server reports, and it moves in the direction the speed moves. Pooling all three runs per language holds the ratio: 364/1008 = 36.11% for English, 431/1053 = 40.93% for Chinese.
The runs were reproducible. SHA-256 of the three English completions is identical across all three, and the same for the Chinese set. All six requests came back with finish_reason: stop, and no samples were dropped.
One number here is a trap: characters per second. English came out at 64.88 chars/s, Chinese at 15.47. That looks like English is 4x faster, and it is the opposite of the real result. Two things stack up to produce it: token density (4.4 characters per token in English, 1.01 in Chinese) and the model choosing to write different amounts (1,456 English characters, 367 Chinese). Tokens per second is the speed of the machine. Characters per second only tells you how long you sit there before the answer stops moving.
One quality note while I was reading the Chinese output: it came back in Traditional Chinese rather than Simplified, and across the whole passage there was a single wrong character — a substitution close to a homophone. That is the cost of 2.4-bit experts, and I am reporting it rather than filtering it out.
Three.js code decodes at 23.64 tok/s, 52% faster than prose
I asked for a single self-contained HTML file: Three.js from a CDN, a voxel-style Japanese castle keep with a stone base, tapering tiers, per-tier overhanging roofs, a decorative finial, a ground plane, lighting, and a slow automatic camera orbit.
It produced 2,136 completion tokens in 92.06 s of wall time — 23.64 tok/s decode — 5,249 characters, ending in </html>, finish_reason=stop. It ran on the first try.
What it got right: the stone base, three tapering tiers, per-tier eaves, white walls against dark roofs, ground and lighting, and the automatic orbit. It reads as a castle keep at a glance.
What it got wrong: the finial rendered as a Christian cross, where the real thing is a shachihoko or a giboshi. My prompt only said "decorative finial", so half of that is mine.
Same server, same flags, three tasks:
| task | decode |
|---|---|
| Three.js single-file HTML | 23.64 tok/s |
| Chinese prose | 16.23 tok/s |
| English prose | 15.40 tok/s |
The ordering has the same explanation as the language gap. The next token in a block of code is far more predictable than the next token in a paragraph, so the draft head guesses right more often, and more of the work lands in verification instead of generation.
Vision works, but you have to drop one flag
Vision needs a different build from the text one above. Unsloth's own PR branch carries both the model architecture and the vision projector, and that is the pair you want:
git clone -b glm5next/upstream https://github.com/unslothai/llama.cpp.git
cd llama.cpp && git checkout d07e71ede7
cmake --build build --target llama-server llama-mtmd-cli -j
Configuration took 4.87 s; the build took 136.19 s.
llama-server -m GLM-5.3-Flash-UD-Q2_K_XL-00001-of-00004.gguf \
  -ngl 99 -c 32768 -ctk q8_0 -ctv q8_0 -fa on \
  --jinja --mmproj mmproj-F16.gguf
Note what is missing: there is no --spec-type. That is a hard requirement, not a simplification for the example. With speculative decoding on, every image request returns HTTP 500. The deep dive below has the mechanism and the numbers from an experimental patch; the operational summary is that you pick vision or you pick speculation.
Ready in 97 s. I checked it in three layers, all HTTP 200, because "the server started" is not evidence that the vision path is wired up.
| layer | check | result |
|---|---|---|
| mechanism | /v1/models | capabilities: ["completion","multimodal"] |
| low bar | 64x64 solid red PNG, asked its color | Red |
| high bar | 1200x400 black-on-white text image | read back with Levenshtein distance 0 |
| not regressed | The capital of France is | **Paris**, finish_reason: stop |
The high bar was THE SILVER ROBOT READS SEVEN BLUE MAPS. transcribed exactly. One thing about that zero: the ground-truth file lived in a different run's directory, and a distance of 0 against the wrong image is a meaningless result that looks like a perfect one. I compared sha256 of both files before accepting it. Cross-run comparisons need a hash, not a matching filename.
Encoding the image into context cost 678 tokens at 193.94 tok/s.
To my knowledge nobody has published this measurement for GLM-5.3-Flash on a single Spark, which is most of why this section exists.
It is the slowest of the four models on this box
Same machine, same English prose task:
| model | decode |
|---|---|
| Qwen3.8-Flash-Next IQ1_S | 32.27 tok/s |
| DeepSeek-V4-Flash-0731 (vLLM sparkinfer) | 24.95 tok/s |
| Qwen3.8-Flash-Next Q4_K_XL | 23.38 tok/s |
| GLM-5.3-Flash Q2_K_XL | 15.50 tok/s |
Last, by about half. These are different models at different quants, so read the table as order-of-magnitude context rather than a controlled head-to-head — what it establishes is that nothing about this model is a speed story.
Its value sits in the column I cannot benchmark: native multimodality, an architecture built for 1M context, and an MIT license. None of the three faster entries offers any of that.
For an outside reference point, an NVIDIA forum post reports 2x Sparks running vLLM with NVFP4 at 19.58 tok/s on prose. This is one machine at 15.40 English and 16.23 Chinese, so roughly half the hardware for about 80% of the speed. Different engine, different quant format, so the comparison is loose, but it is the closest published number to what I ran.
I have deliberately not benchmarked against the 46.9 and 62.9 tok/s figures floating around the community, because none of the posts publish their prompt. One repo author put it well: a single-stream tok/s number without the prompt that produced it does not mean anything. Prompt length, output length and content all move this metric by more than the differences people are arguing about.
Takeaways
A 121 GB machine runs a 320B model, and you do not have to drop to 1-bit to do it.
Four decisions carry the whole setup:
UD-Q2_K_XL, not the officially recommendedUD-IQ3_XXS— that recommendation does not budget for the KV cache.- CUDA toolkit 13.0 only, with
-DCUDAToolkit_ROOTand-DCMAKE_CUDA_COMPILERboth set. Verify from cmake's own "Found CUDAToolkit" line. - Start
-cat 32768. Load time is the same at 262144, and 1M takes the machine down without an error message. - Drop
--spec-typeif you want vision. They do not coexist today.
It is the slowest of the four models I run on this box at 15.5 tok/s. It is also the only one that sees images, the only one under MIT, and the only one with a 1M-context architecture — and its Chinese is faster than its English.
Deep dive: why an image request returns HTTP 500 when --spec-type is on
You can skip this section — the recipe above stands without it. What follows is the debugging log: what I assumed at each step, what I did to test it, and where the assumption was wrong.
The error names the draft context, not the vision path
The problem. With --spec-type draft-mtp, both image requests returned HTTP 500. The server survived — /health still answered {"status":"ok"} afterwards. The only difference between the working run and the failing one was that flag; everything else, including the image bytes, was identical.
What I expected the fix to be. That the model could not see the image, and that I had built the wrong branch or pointed at the wrong mmproj. A 500 on an image request reads like a broken vision path, and rebuilding was the obvious next move.
What I did instead. Read the server log before touching the build.
E decode: failed to initialize batch
E spec  process: llama_decode(ctx_dft) head=0 failed rc=-1 (pos=36)
E srv   decode: failed to process speculative batch
   the last position stored in the memory module of the context (i.e. the KV cache)
   for sequence 3 is X = 19
   it is required that the sequence positions remain consecutive: Y = X + 1
Result. Every line names ctx_dft — the draft context — and the speculative batch. Nothing in it mentions the vision path. The numbers close the case: the target context is at position 36, the draft stopped at 19, and the 17-slot gap is exactly the span the image occupied. The image was processed correctly. What failed is that the draft never learned it happened.
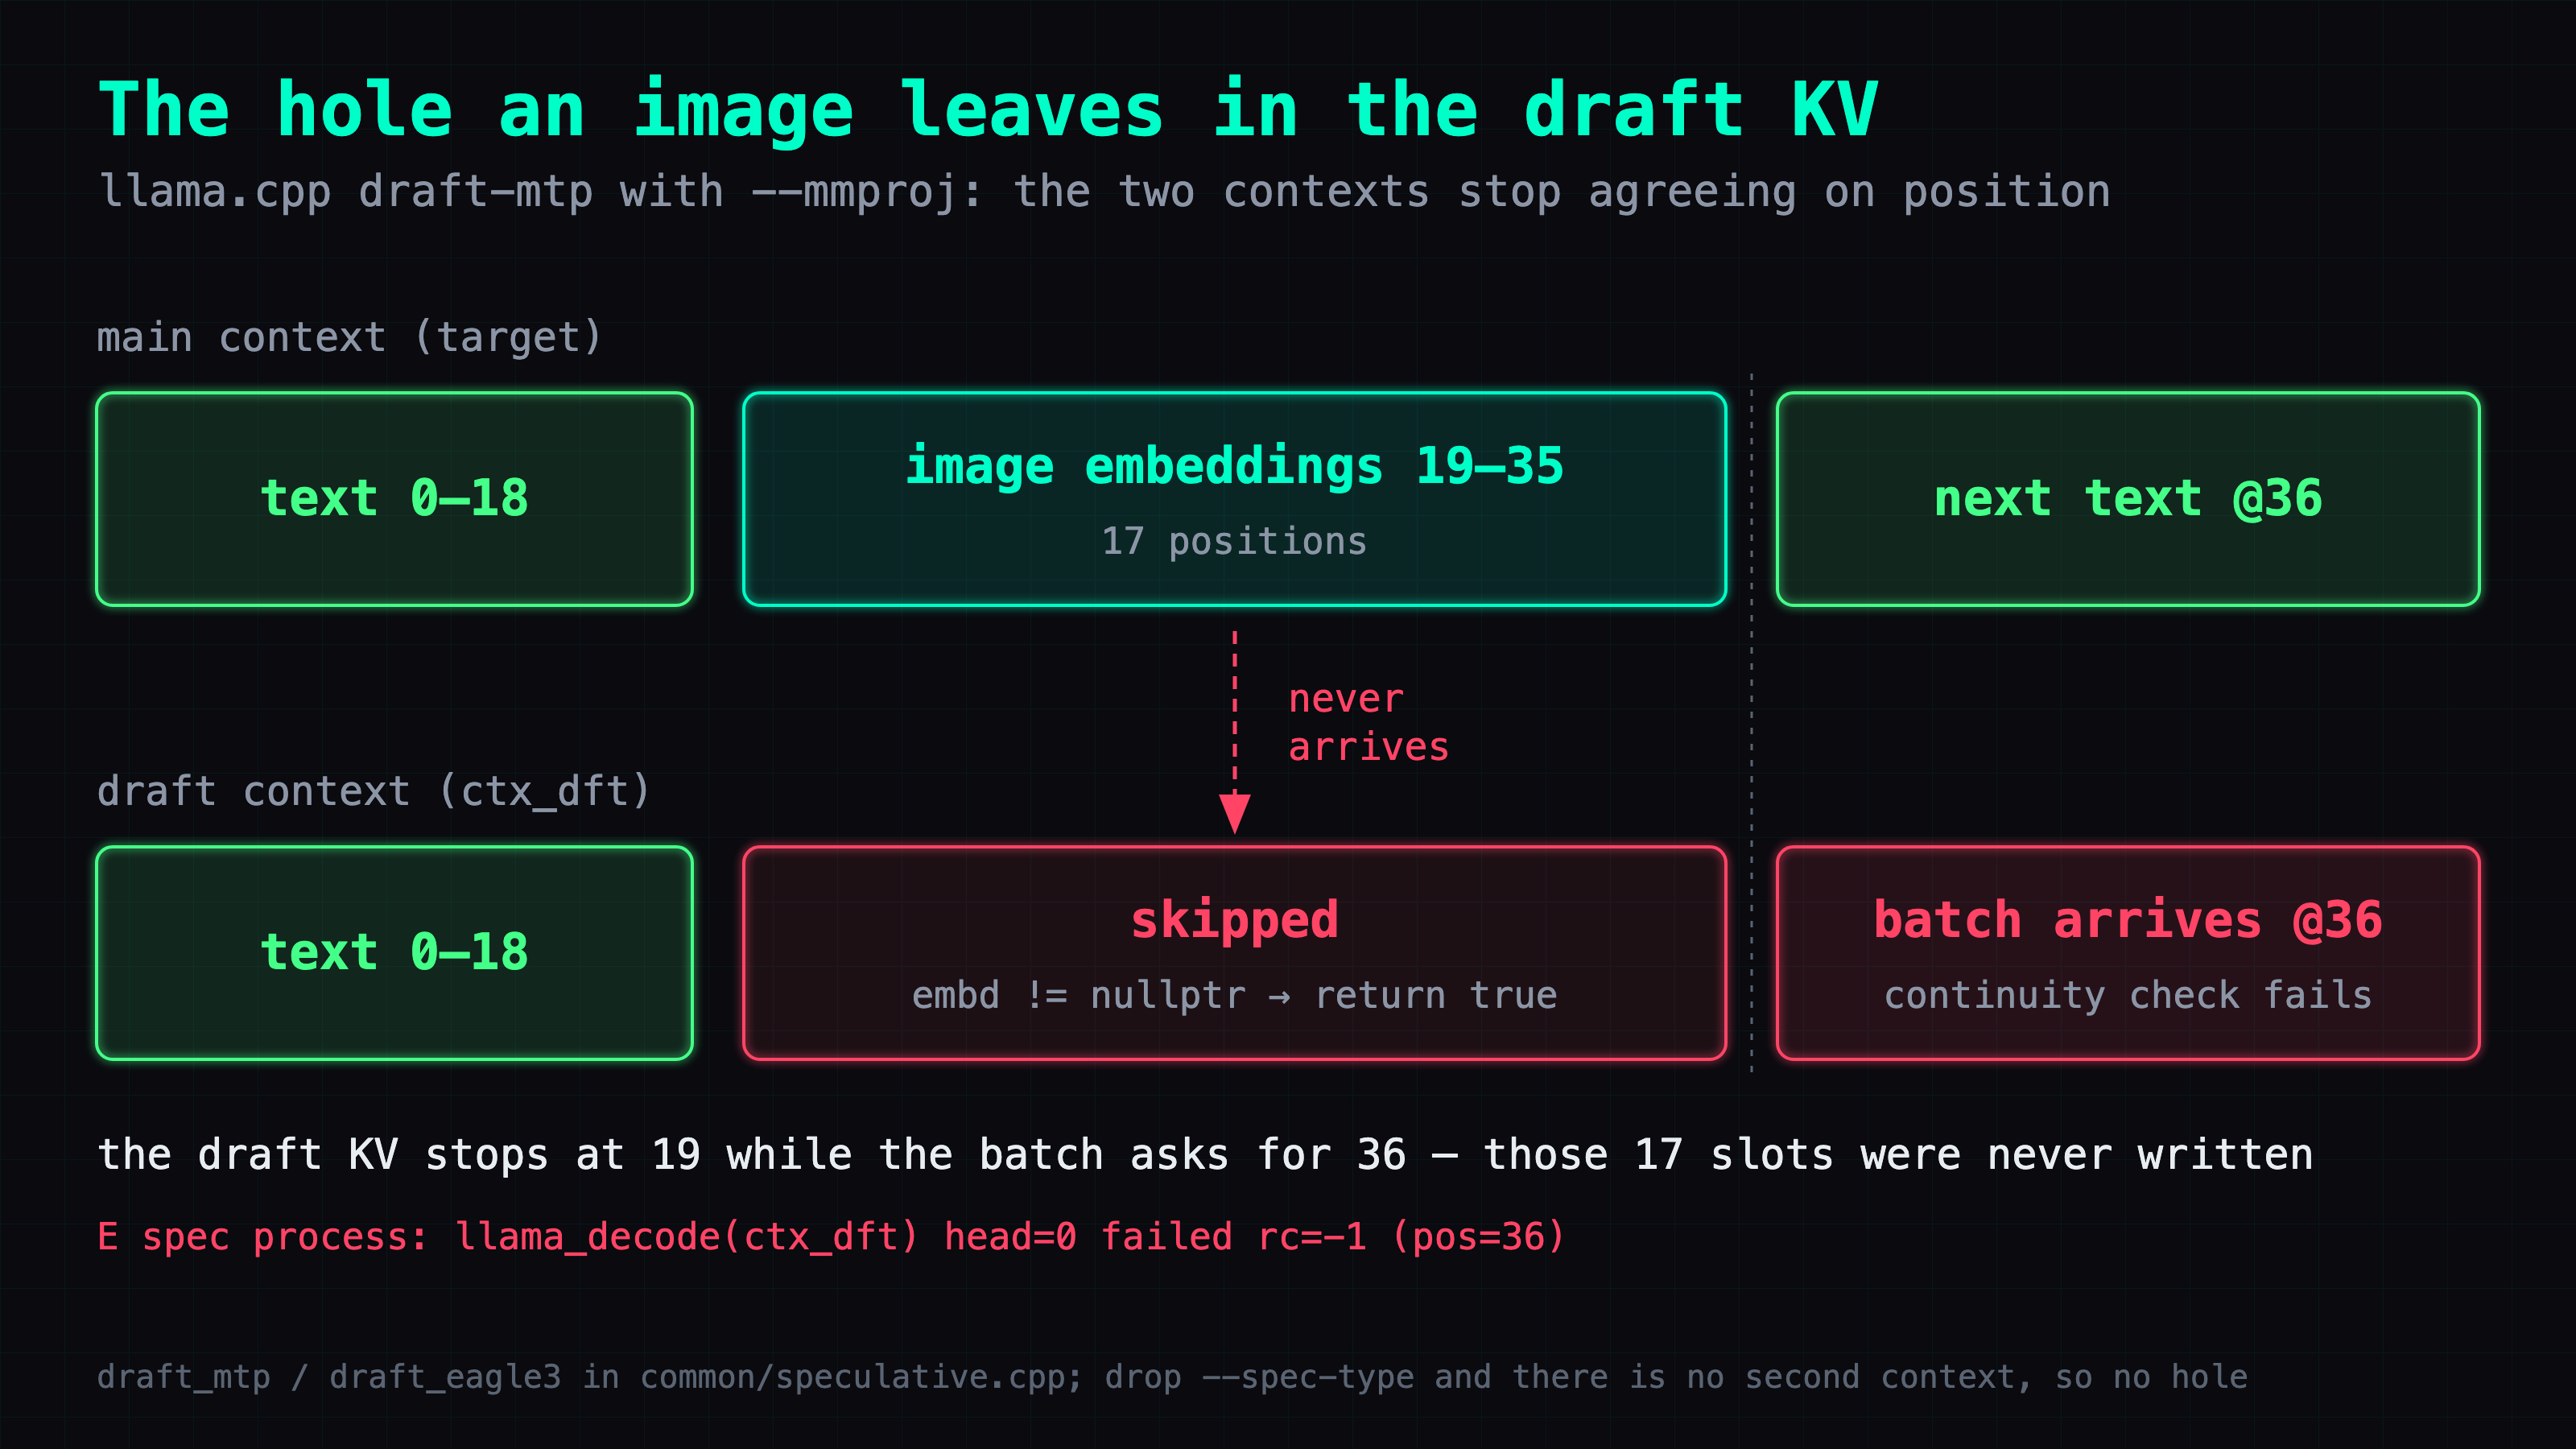
Where my expectation was wrong. I mapped "image request fails" onto "image handling is broken", which is the same error as reading a symptom's location as its cause's location. The image and the draft are two subsystems that happen to touch the same position counter, and only one of them was misbehaving. A rebuild would have taken twenty minutes and changed nothing.
Is this unimplemented, or a path that quietly does not take effect?
The problem. A 17-token hole in the draft KV means nobody is telling the draft that an image consumed those positions. Either the code to do that was never written, or it exists and does not fire.
What I expected. That it was never written. Vision plus speculative decoding is a narrow combination and "nobody got to it yet" is the base rate for this kind of gap.
What I did. Read the wiring in tools/server/server-context.cpp and common/speculative.cpp.
Result. The wiring is there. Images enter the main context as embeddings: process_mtmd_chunk calls mtmd_helper_decode_image_chunk(), and the position advance comes from mtmd_input_chunk_get_n_tokens(). That function takes a callback, and the callback calls common_speculative_process. So the draft is supposed to be told.
What varies is what the draft does when it is told. Four implementations run an independent draft KV, and they split two ways on a batch that carries an image:
draft_eagle3returns true whenembd != nullptr, skipping the batch and leaving the holedraft_mtpdoes the same, and carries a literal// TODO: how to make it work with vision tokens?draft_dflashanddraft_dsparkdo not skip, but flatten M-RoPE's multi-dimensional positions into a single scalar
The five ngram-family process() functions are // TODO: implement; return true and structurally cannot reach this failure at all.
Where my expectation was wrong. I was asking "which speculative mode is broken", and that is the wrong axis. The discriminator is whether the mode keeps its own draft KV cache, and the source says so directly:
add_config_if_enabled(..., params.draft.ctx_dft != nullptr);
That guard applies to exactly those four. Modes that share the target's KV (is_mem_shared, the Gemma-4 style arrangement) never see a position mismatch, because there is only one set of positions to be consistent with. This is also why the whole class of bug is absent in vLLM and SGLang: they let MTP assistant layers share the target's KV. Both have their own open issues about feeding multimodal input to a draft, so it is not that they solved something llama.cpp did not — it is that the dividing line is the engine's KV design, not the model.
The upstream fix is one file, and I measured it rather than trusting it
The problem. PR #25144 fixes this. It is a small change — +16/-6 in a single file — giving the draft its own position space instead of reusing the target's. It has not been merged.
What I expected. That an unmerged one-file fix for a reproducible crash is probably fine and just needs someone to press the button, and that applying it locally would give me working vision plus speculation.
What I did. Read why it is being held, then applied it and measured.
ggerganov's position is that llama_batch should first be refactored to carry vision and target embeddings together, so the case can be supported properly across the board rather than patched at one site. Reading the diff, that holds: it fixes draft_mtp and touches neither eagle3 nor dflash. The PR author had also measured two variants, which is the part worth stealing — merely relaxing the position check stops the crash but yields 0% acceptance, because the hole is still there and a draft with a hole in it is useless. Renumbering is what actually makes the draft work.
git apply --check returned 0 and it applied cleanly. Three runs each:
| workload | draft_n | accepted | acceptance | median decode |
|---|---|---|---|---|
| prose | 1585 | 581 | 36.66% | 17.61 tok/s |
| image continuation | 1106 | 724 | 65.46% | 21.52 tok/s |
Result. Images stopped returning 500, and the text path was not harmed — 36.66% acceptance on prose against 36.01% unpatched is the same number. On the surface this looks like a clean win, and the 21.52 tok/s on image continuation looks like a large one.
Then I read the logs. Across six long generations, llama_decode[1] returned -1 appears 2,661 times, while head=0 failures appear 0 times. That string appears 0 times in the unpatched logs, so it is not pre-existing behavior I am now noticing. Head 0 works; every MTP head past the first is erroring. The 48.50% weighted acceptance the server reports in its timings is real telemetry, and it is being produced by a draft path that is partly failing and retrying at a rate nobody would choose to pay.
Where my expectation was wrong. I treated "small diff, reproducible bug, author measured it" as a proxy for "safe to run", and the maintainer's objection as procedural conservatism. The objection was about scope, and scope turned out to be the thing: patching one site in a shared mechanism leaves the other heads in a state the patch never considered. The verdict is that this is experimental evidence about where the boundary is, not a configuration to run.
If you want vision, drop --spec-type. That is still the answer today.
Deep dive: two operational traps that each cost an hour
Neither of these is about this model in particular. Both are the kind of thing that produces a confident wrong conclusion.
An empty content field is not the model failing the task
The problem. A code-generation request came back with content empty. At max_tokens: 8192 it produced 28,851 characters of reasoning and nothing else. I raised it to 16384 and got 54,842 characters of reasoning and still nothing else.
What I expected the fix to be. That the budget was too small for the task, which is why I raised it the first time. When that failed, my next hypothesis was that a 2-bit quant of this model could not do code generation at all — and I was one step away from writing that down as a finding.
What I did instead. Looked at what was filling the budget rather than at the size of the budget. This model always thinks. Without an explicit reasoning_effort, it spends the entire allowance reasoning and never reaches the answer.
Result. reasoning_effort: "low" fixed it on the first try. The castle keep in the section above came out of the very next request.
Where my expectation was wrong. I read "no output" as "cannot do it", when the request had never gotten as far as attempting the task. Before concluding a model cannot do something, check that content is non-empty and that finish_reason is not length. Those two fields separate "failed the task" from "never started it", and I had both in the response the whole time.
llama-server --help gets truncated when the GPU is busy
The problem. I grepped --help for a flag, did not find it, and concluded that this build did not support it.
What I expected. That --help is a static string dump and therefore trustworthy. It is the most boring output a program produces.
What I did instead. Nothing, at first — that is the trap. I acted on the absence. The check I should have run is whether the output was complete, and it was not: llama-server initializes CUDA before printing help, so when the GPU is loaded the output stops partway with no marker that anything is missing.
Result. The flag existed. The grep was scanning a truncated string.
Where my expectation was wrong. An empty grep result has two causes that look identical from where I was standing: the pattern is absent from the corpus, or the corpus is not what I think it is. Before asserting a flag does not exist, confirm the output is whole — compare the line count, or check that the known last line is present — or sidestep the initialization entirely:
CUDA_VISIBLE_DEVICES=-1 llama-server --help | grep -- --mmproj
Environment
- Machine: one NVIDIA DGX Spark, GB10 (sm_121a), 121 GiB unified memory, aarch64 Linux, driver 580.159.03, CUDA toolkit 13.0.88
- Text build:
eauchs/llama.cpp, commit8a8d0bcc4d5fdf024c457526245bec4bc3a12adc(fetch the SHA directly — the branch head has since diverged from it), targetllama-server, 166.57 s - Vision build:
git clone -b glm5next/upstream https://github.com/unslothai/llama.cpp.git, commitd07e71ede7, targetsllama-server llama-mtmd-cli, configure 4.87 s, build 136.19 s - Server:
llama.cpp 0.3.0-dev (build 10677, commit 8a8d0bcc4),CMAKE_CUDA_ARCHITECTURES=121a-real - Model: unsloth/GLM-5.3-Flash-GGUF,
UD-Q2_K_XL, 4 shards, 108,720,071,427 bytes, plusmmproj-F16.gguf(1.13 GB) - Prose runs:
max_tokens=1024,temperature=0,reasoning_effort="low", 3 runs per language, allfinish_reason: stop, no samples excluded
Also in this series: A 177B MoE at Full 262K Context on a DGX Spark · 284B at 2-bit: is it still usable?
FAQ
- Can a DGX Spark run GLM-5.3-Flash?
- Yes, at UD-Q2_K_XL. That quant is 108.72 GB of weights and leaves 13-14 GB free in the 121 GB unified pool, which is enough for a 262,144-token context with q8_0 KV. The flagship GLM-5.3 (744B-A40B) does not fit at any quant — its smallest GGUF, UD-IQ1_S, is 216.72 GB, off by nearly 2x.
- Which GLM-5.3-Flash quant should I use on a 128 GB machine?
- UD-Q2_K_XL at 108.72 GB, not the UD-IQ3_XXS that Unsloth's docs recommend for 128 GB boxes. That recommendation compares weights against total memory and omits the KV cache. IQ3_XXS is 120.37 GB in a 121 GB machine, which leaves no room for even a 32K context.
- Why does llama.cpp produce garbage output after building with CUDA 13.2?
- Because CMake resolves the CUDA toolkit path independently of the compiler you name. Passing only -DCMAKE_CUDA_COMPILER gives you a 13.2 nvcc with whatever headers CMake finds first, and a mismatched cudaLaunchConfig_t layout makes cudaLaunchKernelEx misbehave. Pass -DCUDAToolkit_ROOT and -DCMAKE_CUDA_COMPILER together, both pointed at 13.0, and check that cmake's 'Found CUDAToolkit' line reports 13.0.88.
- Why do image requests return HTTP 500 when --spec-type is on?
- Speculative decoding in llama.cpp puts the draft model in a second, independent llama_context with its own KV cache. Image embeddings advance the position counter in the main context but leave a hole in the draft's KV, so the next decode fails a consecutive-position check. Drop --spec-type and vision works. The upstream fix (PR 25144, +16/-6 in one file) is not merged.
- Is GLM-5.3-Flash faster in Chinese than in English?
- Yes, by 5.39% on my measurement: 16.23 tok/s median versus 15.40, three runs each, same server and same parameters, only the prompt language changed. The mechanism is visible in the telemetry — MTP draft acceptance is about five points higher on Chinese (41.03% versus 36.01%), so the model spends fewer verification rounds per accepted token.
Read next
- 2026-08-28[Benchmark] A 177B MoE at Full 262K Context on a DGX Spark: 76.65 tok/s on a File Edit
Qwen3.8-Flash-Next UD-Q4_K_XL is 104 GiB. GB10 holds all of it plus a 262,144 context in one 121 GB pool. 76.65 tok/s on a file edit, 20.51 on prose.
- 2026-08-23[Benchmark] Qwen3.8-27B hits 65 tok/s on one DGX Spark — 12.3 without speculative decoding
GB10 gives you 273 GB/s and the model reads 18.77 GB per token, so the ceiling is 14.54 tok/s. Measured 12.3 — 85% of it. Kernel swaps can't recover the rest. Speculative decoding gets 5.28x, and the win came from one flag.
- 2026-06-04[Benchmark] Gemma 4 12B Omni on DGX Spark: Weight-Only NVFP4 Beats W4A4 (and Keeps Multimodal)
I quantized Google's new omni Gemma 4 12B on a DGX Spark GB10. Weight-only NVFP4 hits 24.9 tok/s in 7.7 GB and keeps image/audio/video working — full W4A4 is slower AND breaks multimodal.
- 2026-05-21Round 2 EAGLE-3 retrain didn't break the ceiling — a 60-hour null-result writeup
After Part 30's endpoint correction showed Round 1 didn't actually 2x chat throughput, Round 2 added 30k regenerated Chinese instruction samples and trained for 41 hours. Result: Round 2 B drafter delivers chat EN 45 tok/s / ZH 29 tok/s — essentially the same as v1 (EN 46 / ZH 27), and well below vanilla MTP n=4's EN 53 / ZH 45. The EAGLE-3 small head hits an architectural ceiling against the abliterated body; more data doesn't fix it. Plus we found a scheduler deadlock in the vLLM Gemma 4 preview image (`gemma4-0505-arm64-cu130`, internal build `0.20.2rc1.dev49+g9b4e83934`) under long-running extract_hidden_states use (hit three times, mitigated with a watchdog).
Don't miss the next one
Subscribe, and you won't.
One-click unsubscribe anytime.