DGX Spark · part 47
[Video] Two-Stage MiniMax-H3 + LTX-2.5 on a DGX Spark: 1.89x Faster Than Native
❯ cat --toc
- Preface
- 110.6 s against 208.5 s, and 66.8 s if you leave the models loaded
- Nine weight files, two node packs, and a graph that has to be the -nogemma one
- Two things to check yourself
- 53.6 GiB of weights fit in 121 GiB, and that is the whole gap
- Native gains 0% from residency, and you have to cap the clock to find that out
- The machine lost power twice, both on the second consecutive native run
- Deep dive: what the 18 cached nodes were, and three departures from the 5090 build
- The warm run is only a warm run if you change the seed
- The 18-node audit
- Three differences from the RTX 5090 build
- Environment
TL;DR
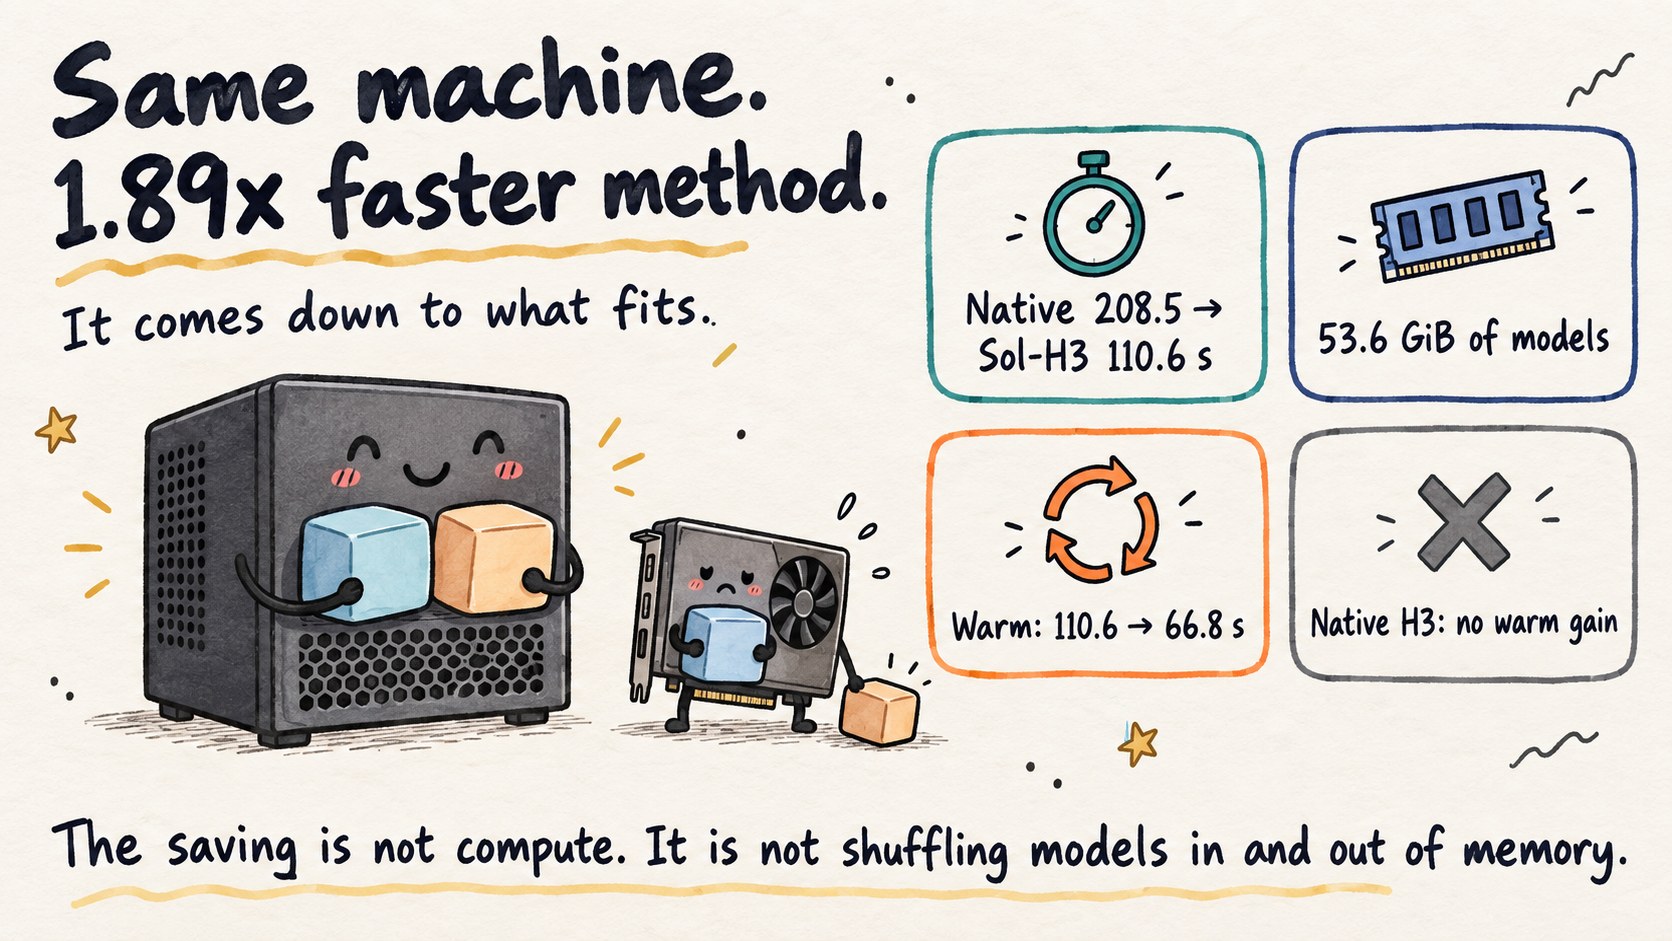
On a DGX Spark, MiniMax-H3 drafting at 672x384 and LTX-2.5 refining to 1344x768 takes 110.6 s cold, against 208.5 s for native H3 at full size: 1.89x. Run it again with the models still loaded and it is 66.8 s. The Spark's 121 GiB of unified memory holds both stages' 53.6 GiB of weights at once, so nothing gets evicted between runs. A 31.84 GiB RTX 5090 cannot hold stage 1's 33.5 GiB alone and reloads every time. Caveat: in absolute terms the Spark is 2-4x slower than a 5090 here, 110.6 s against 40.3 s.
Preface
A small kitchen makes you put the mixing bowls away before the roasting pans come out. A big counter lets both sit there all afternoon. The recipe does not change. What changes is how much of the afternoon you spend fetching and putting away.
Part 8 of the RTX 5090 series established the method: let MiniMax-H3 draft at 672x384, then let LTX-2.5 spend three steps refining the take you keep up to 1344x768. On a 5090 that beats running H3 natively at full size by 1.28x cold.
I ran the same workflow on a DGX Spark. Same graph, same weights, one quantization swap. The gap widens to 1.89x cold.
The Spark is the slower machine at every step of this job. That is the interesting part.
110.6 s against 208.5 s, and 66.8 s if you leave the models loaded
Both paths produce the same thing: 1344x768, 124 frames, 24 fps, with audio. Four draft steps and three refine steps on the two-stage path, four steps at full resolution on the native path.
"Cold" and "warm" appear throughout and have nothing to do with temperature. Cold means the models were freed beforehand and this run reads them off disk. Warm means the previous run just finished and the models are still in memory.
Every number in the table is the whole workflow, submission to finish — draft sampling, the handoff, the upscale, refine sampling, VAE decode and writing the file. It is not the time the models alone spent computing. So the 43.7 s a warm run saves is not compute getting faster: the draft and the refine are both recomputed on the second run. What it saves is moving the models in and out of memory. I audit that node by node in the deep dive, because it is the claim in this article most worth doubting.
| DGX Spark | RTX 5090 | |
|---|---|---|
| Native H3 at 1344x768 (cold) | 208.5 s | 51.5 s |
| Two-stage, H3 draft + LTX refine (cold) | 110.6 s | 40.3 s |
| Two-stage (2nd run, models still resident) | 66.8 s | 30.6 s |
Every ratio below compares two paths on the same machine, two-stage against native. None of them compares one machine to the other.
- Spark, cold against cold: 110.6 against 208.5 is 1.89x
- 5090: 40.3 against 51.5 cold is 1.28x; 30.6 against 41.5 warm is 1.36x
The Spark's warm cell holds only the two-stage number. I did get a native warm figure eventually, but only after capping the GPU at 2200 MHz — uncapped, the second run takes the machine down, which the next article is about. Capping changes the absolute seconds, so that pair does not belong in this table and gets its own section below.
One thing to be clear about first. Every Spark cell is 2-4x worse than the 5090 cell beside it. Two-stage costs 110.6 s on the Spark and 40.3 s on the 5090. The pipeline gets a bigger speedup on the Spark. The Spark itself is still the slower machine.
Nine weight files, two node packs, and a graph that has to be the -nogemma one
There is no new code here. T8mars's node pack implements the whole path inside ComfyUI, and the weights are two downloads.
Both repos are gated — you have to accept the terms in a browser before your account can download anything. Skip it and the hf download below returns a 401. Open coolthor/MiniMax-H3-pruned-NVFP4 and Lightricks/LTX-2.5 in a browser, accept the terms on each, then:
hf auth login
⚠️ The gate on the H3 repo is deliberate. MiniMax-H3's community licence excludes the EU, the UK, South Korea and the United States, and that restriction travels with the weights.
Everything on the H3 side is in one repo — both transformers, the text encoder, both VAEs, the turbo LoRA, the conditioning cache, the custom node and the workflow — and it is laid out as ComfyUI's models/ tree, so the download lands each file where it belongs instead of leaving you to match folders by hand. LTX-2.5 is the one thing fetched separately; its licence differs from H3's, so it is linked rather than mirrored.
hf download coolthor/MiniMax-H3-pruned-NVFP4 --local-dir ComfyUI/models \
  --include "diffusion_models/minimax_h3_fl2va*" "text_encoders/*" "vae/*" \
            "loras/minimax_h3_fl2v*" "conditioning_cache/*" "custom_nodes/*"
LTX-2.5 is a separate download under a different license:
hf download Lightricks/LTX-2.5 --local-dir ComfyUI/models \
  --include "diffusion_models/ltx-2.5-22b-distilled-transformer-nvfp4.safetensors" \
            "vae/ltx-2.5-*" "latent_upscale_models/*"
The first download lands a custom_nodes directory inside models/, which is the wrong place. Move it once:
mv ComfyUI/models/custom_nodes/ComfyUI-CondCache ComfyUI/custom_nodes/
Then the node packs. There are two, and the graph will not load if either is missing:
git clone https://github.com/T8mars/comfyui-minimax-h3-audio-T8 \
  ComfyUI/custom_nodes/comfyui-minimax-h3-audio-T8

git clone https://github.com/xmarre/ComfyUI-Spectrum-MiniMax-H3 \
  ComfyUI/custom_nodes/ComfyUI-Spectrum-MiniMax-H3
The T8 pack carries the handoff with two nodes. MiniMaxH3SolEngineDraftToLTXT8Advanced trims frames and crops the aspect ratio before the draft is passed on, and MiniMaxH3SolEngineLTXIdentityRefinerSetupT8Advanced configures how the refine runs.
The second pack supplies SpectrumApplyMiniMaxH3, which node 7 of the graph needs. Miss it and the whole graph refuses to load, without telling you which node is missing.
LTXVLatentUpsampler needs no pack at all — the x2 latent upscaler ships with ComfyUI core.
You do not have to wire it yourself. This is the exact graph that produced every number in this article — 32 nodes, renumbered, no local paths in it:
⬇︎ minimax-h3-ltx-hybrid-refine-nogemma.json
Drag it into ComfyUI. The same file also sits under workflows/ in the Hugging Face repo, which is easier if you are pulling the weights anyway; the direct link above is for reading the graph before you request access.
⚠️ On a DGX Spark you have to use the -nogemma graph. The Gemma variant errors out on this machine. Details in the deep dive.
Two things to check yourself
One: confirm both custom nodes actually registered. LoadConditioningT is a custom node that is in no registry, so if the node pack did not load, the failure reads "node does not exist" rather than "file missing", and you will go looking for a weight file that is already there. Ask the server what it knows:
curl -s http://<your-spark-ip>:8188/object_info \
  | grep -o -E 'LoadConditioningT|MiniMaxH3SolEngineDraftToLTXT8Advanced|SpectrumApplyMiniMaxH3' \
  | sort -u
All three names have to come back. If any one is missing, the graph loads in the UI and then fails at queue time.
Two: confirm the refine schedule starts at 0.78. Not the official 0.909375, written 0.909 from here on. The full schedule is 0.78, 0.643, 0.546, 0. At 0.909 the refine stage stops sharpening the draft and redraws the face into a different person. That defeats the point of drafting first.
53.6 GiB of weights fit in 121 GiB, and that is the whole gap
Two stages means two complete model stacks. Nothing is shared between them.
Stage 1 — MiniMax-H3
  transformer                        11.67 GiB
  text encoder                       14.61 GiB
  video VAE                           4.85 GiB
  audio VAE                           0.56 GiB
  turbo LoRA                          1.82 GiB
                                    ----------
                                      33.5 GiB

Stage 2 — LTX-2.5
  transformer                        17.44 GiB
  video VAE                           1.35 GiB
  audio VAE                           0.34 GiB
  latent upscaler                     0.93 GiB
                                    ----------
                                      20.1 GiB
About 53.6 GiB of weights across both stages. Measured peak including working space is 104 GiB out of the 121 GiB available.
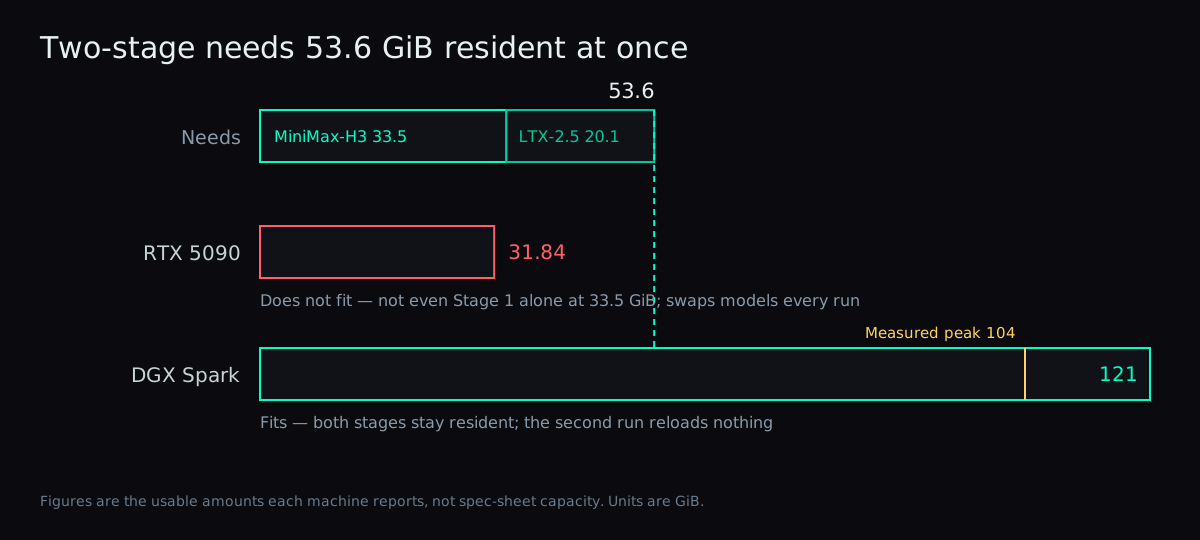
An RTX 5090 has 31.84 GiB. (Both 31.84 and 121 are what my two machines report as usable, not the 32 GB and 128 GB on the spec sheets.) That is not enough for stage 1 on its own. So on a 5090 every single run is: load H3, draft, evict H3, load LTX, refine, evict. There is no state to carry into the next run, because there is no room to carry it in.
A DGX Spark's 121 GiB of unified memory holds both stacks with room left over. Load them once and they stay. The difference between the cold run and the second run is 43.7 s (110.554 minus 66.820), and most of that is the loading.
That is the mechanism behind the wider ratio. The Spark is slower at the compute, and the compute is most of what is left once you stop paying for loading.
Native gains 0% from residency, and you have to cap the clock to find that out
Two-stage's second run saves 43.7 s. Native's saves nothing. That is the whole finding: residency helps the two-stage pipeline, not the machine.
Getting the native pair at all means capping the GPU at 2200 MHz — it boosts to 2450 on its own, and uncapped the second run takes the machine down mid-generation:
| Cold | Warm | Change | |
|---|---|---|---|
| Native (capped at 2200 MHz) | 246.6 s | 251.3 s | +1.9% |
| Two-stage (uncapped) | 110.6 s | 66.8 s | -39.6% |
Native's second run is 4.7 s slower than its first, not faster.
ComfyUI reports which nodes it skipped: 18 of 32 on two-stage's second run, and 0 on native's. All 18 are loaders and configuration — nine model loaders, plus guiders, schedulers, setup nodes and the prompt.
What is not among them matters more. Both SamplerCustomAdvanced nodes re-ran, so the H3 draft sampling and the LTX refine sampling were recomputed from scratch. So were VAEEncode, both VAEDecode nodes, VAEDecodeAudio, the DraftToLTX handoff, the latent upsampler, and RandomNoise because the seed changed. The draft was redrawn. Every second of generation was paid for again, which rules out saved compute as the explanation for the 43.7 s.
Native has one model stack and nothing to hand to a second one, so there is nothing for residency to keep. The 121 GiB buys it nothing. The speedup is not the hardware being generous. It is that two-stage leaves something worth keeping in memory, and native does not.
The machine lost power twice, both on the second consecutive native run
Not a hang. Power loss. The kind where someone has to walk over and press the button.
It happened twice in one day, and both times it was the second back-to-back native 1344x768 run. The first native run completed fine at 202 s under full load. The second started with no gap and died about 90 s in.
Two-stage ran four times on the same machine with zero crashes, at a memory peak of 104 GiB — higher than the 74 GiB that was in use during both crashes. So memory pressure is not the variable.
Sustained-load duration is the candidate that fits. Native is 200 s of unbroken generation. Two-stage's longest continuous segment is 110 s, with lighter VAE and handoff stages in between.
This is not something the pipeline causes, and it has a fix: capping the GPU at 2200 MHz gets the same back-to-back pair to finish, at a cost of about 20% per run. A report on the NVIDIA developer forum describes hard lockups under sustained inference with the same driver version and the same model. How I tracked it down, and why a clock cap is what works, is the next article.
That said, with the clock capped native finishes too. Two-stage's stability edge is real, but a clock cap is the simpler fix — the reason to reach for two-stage is still the 1.89x.
Deep dive: what the 18 cached nodes were, and three departures from the 5090 build
You can run everything above without reading this. Nothing here changes the method or the commands. It is how the numbers were taken, the node-by-node audit behind the 18, and where this build differs from the one in the 5090 article.
The warm run is only a warm run if you change the seed
Every timing in this post is ComfyUI's /history endpoint: execution_success minus execution_start, divided by 1000.
Cold runs were preceded by:
curl -X POST http://<your-spark-ip>:8188/free \
  -H 'Content-Type: application/json' \
  -d '{"unload_models":true,"free_memory":true}'
Warm runs have a trap in them. My first attempt reused the seed and came back at 0.006 s with cached=31. Thirty-one of 32 nodes skipped: ComfyUI had recognised the identical graph and returned the previous output. That is a cache hit on the result, not a warm run of the pipeline.
Change the seed and the cached count drops to 18, which is the number the rest of this post uses.
The 18-node audit
Cached on the two-stage second run:
| Count | Node |
|---|---|
| 4 | VAELoader |
| 2 | UNETLoader |
| 1 | CLIPLoader |
| 1 | LoraLoaderModelOnly |
| 1 | LatentUpscaleModelLoader |
| 2 | BasicGuider |
| 1 | KSamplerSelect |
| 1 | BasicScheduler |
| 1 | SpectrumApplyMiniMaxH3 |
| 1 | IdentityRefinerSetup |
| 1 | LTXVConditioning |
| 1 | LoadConditioningT |
| 1 | prompt node |
Nine of those are loaders. The other nine are configuration that depends only on the loaders.
The 14 that re-ran include both SamplerCustomAdvanced nodes, VAEEncode, VAEDecode x2, VAEDecodeAudio, the DraftToLTX handoff, LatentUpsampler, and RandomNoise. Everything that touches pixels or latents was recomputed.
Since the draft was redrawn, the 43.7 s cannot be saved compute. I attribute it to model loading, but that is an inference rather than a direct measurement — execution_cached reports that a node's output was reused, which is not the same as timing disk I/O or GPU residency. Pinning it down would need the setup and read phases timed separately.
Three differences from the RTX 5090 build
LTX-2.5 runs the nvfp4 checkpoint here, int8-convrot in the previous article. I checked whether that costs speed before swapping: n=3 warm runs on the 5090 gave a median of 30.574 s for nvfp4 against 30.819 s for int8, a difference of 0.245 s while the within-arm spread was 6.0 s. Indistinguishable on speed. I chose nvfp4 because it is 2.6 GiB smaller, and for no other reason.
Two-stage runs the no-Gemma variant, and on this machine that is mandatory rather than an optimisation. The stage-2 prompt is a single fixed string, so it is computed once and cached to a file, and the 14.32 GiB text encoder never loads. On the Spark the Gemma graph fails outright:
ValueError: not enough values to unpack (expected 4, got 1)
  sd1_clip.py:266
Line 266 sits in forward, which unpacks what process_tokens (line 172 of the same file) returns into four values, and on this machine gets one. A version mismatch between my ComfyUI and that code path is the obvious read, but I did not verify it. I did not find evidence that every Spark hits this — I can only say mine does. Swapping to the cached-conditioning graph steps around that call entirely, and the substitution is semantically equivalent rather than an approximation: I diffed the prompt that generated the cache and it is character-identical.
The main table's native warm cell is empty because it is unobtainable uncapped. Both attempts to take one are the two power losses described above. Capped at 2200 MHz it comes out at 246.627 s and 251.302 s, but that is a different configuration, so it lives in its own section rather than in the table. Native does have two cold measurements at stock clocks, 208.515 s and 201.852 s, which are 6.7 s apart, or 3.2% — inside this machine's run-to-run variation. The tables use the first.
Environment
Machine    ASUS Ascent GX10 (GB10), 121 GiB unified memory
OS         DGX OS, kernel 6.17.0-1032-nvidia
Driver     580.173.02
ComfyUI    1157 nodes registered
Output     1344x768, 124 frames, 24 fps, with audio
Steps      4 draft / 3 refine
Previous in the method: MiniMax-H3 + LTX-2.5 two-stage on an RTX 5090
FAQ
- How much faster is the two-stage MiniMax-H3 + LTX-2.5 pipeline than native H3 on a DGX Spark?
- Cold, with models freed beforehand, two-stage takes 110.6 s against 208.5 s for native H3 at 1344x768, which is 1.89x. Run it a second time with the models still resident and it drops to 66.8 s, a 39.6% saving. Native saves nothing: capping the GPU at 2200 MHz made the pair measurable at 246.6 s cold and 251.3 s warm, so the second run was actually slower. The same pipeline on an RTX 5090 is 1.28x cold and 1.36x warm.
- Is a DGX Spark faster than an RTX 5090 for MiniMax-H3 video generation?
- No. The Spark is 2-4x slower than a 5090 in every cell I measured. Two-stage is 110.6 s on the Spark against 40.3 s on the 5090. What is larger on the Spark is the two-stage method's payoff, 1.89x against 1.28x, not the machine's throughput.
- Why does the two-stage pipeline benefit more from a warm cache than native does?
- The second run reused 18 of the 32 ComfyUI nodes on two-stage and 0 on native. The two stages together are about 53.6 GiB of weights, which fits in the Spark's 121 GiB of unified memory, so the loaders stay resident between runs. An RTX 5090's 31.84 GiB cannot hold stage 1 alone at 33.5 GiB, so it reloads on every run regardless.
- Does the warm run reuse the MiniMax-H3 draft video?
- No. Both SamplerCustomAdvanced nodes re-ran, which means the H3 draft sampling and the LTX refine sampling were both recomputed. VAEEncode, both VAEDecode nodes, the handoff node and the latent upsampler also re-ran. Since the draft was redrawn, the 43.7 s the second run saves cannot be saved compute. Attributing it to model loading is an inference from which nodes were cached, not a separately timed measurement.
- Which ComfyUI workflow file do I need to run this on a DGX Spark?
- workflows/minimax-h3-ltx-hybrid-refine-nogemma.json, 32 nodes, shipped in the coolthor/MiniMax-H3-pruned-NVFP4 repo on Hugging Face. The Gemma variant errors out on this machine with ValueError: not enough values to unpack (expected 4, got 1) at sd1_clip.py:266, where forward unpacks the return of process_tokens into four values. The no-Gemma graph reads a precomputed conditioning tensor from disk instead. I have not confirmed this happens on every Spark, only on mine.
- What sigma should the LTX-2.5 refine stage start at?
- 0.78, giving the schedule 0.78, 0.643, 0.546, 0. The official value is 0.909, and at that setting the refine stage redraws the face into a different person rather than sharpening the one the draft produced.
- Did the DGX Spark crash while running these benchmarks?
- Twice in one day, both times during the second consecutive native 1344x768 run, and both times the machine lost power entirely rather than hanging. Memory during the crashes was 74 GiB, lower than the 104 GiB peak that two-stage reached across four crash-free runs, so the variable is sustained-load duration rather than memory pressure. Capping the GPU at 2200 MHz stops it: the same back-to-back native pair then completes, at a cost of about 20% per run. The next article covers that in full.
Read next
- 2026-08-07[Benchmark] Running MiniMax-H3 on a DGX Spark — and why NVIDIA VSR is off the table for now
Fifteen seconds of 1080p video with audio in 741s on a GB10 DGX Spark. Swapping Real-ESRGAN for SPAN saved 282s, and nvidia-vfx ships x86_64 wheels only — nothing for ARM.
- 2026-06-01[Benchmark] NVFP4 shrinks a video model 33% on a DGX Spark — with zero speed gain
NVFP4 took a distilled Sulphur 2 (LTX-2.3) video model from 29 to 19.5 GB on a GB10 DGX Spark with no quality loss and — since video is compute-bound — no speed gain (if anything a hair slower).
- 2026-09-06[Benchmark] Qwen3.8-Flash-Next NVFP4 on a DGX Spark: 41.7 tok/s, RAM for Traffic, Disk for the Dictionary
NVIDIA's NVFP4 checkpoint at 41.7 tok/s on one DGX Spark via nine bind-mounted vLLM files, plus six figures on why the 47.68 GiB n-gram table lives on NVMe.
- 2026-08-30[Benchmark] GLM-5.3-Flash 320B on One DGX Spark: 15.4 tok/s with Vision Working
A 320B-A18B MoE at UD-Q2_K_XL fits in 121 GB. 15.40 tok/s on English prose, 16.23 on Chinese, 23.64 on Three.js code. Vision works only if you drop --spec-type.
Don't miss the next one
Subscribe, and you won't.
One-click unsubscribe anytime.