DGX Spark · part 45
[Benchmark] Qwen3.8-Flash-Next NVFP4 on a DGX Spark: 41.7 tok/s, RAM for Traffic, Disk for the Dictionary
❯ cat --toc
- What you get: 41.7 tok/s median, 27.4 on prose, 47.2 aggregate at four streams
- What you need: 155 GB of disk, 25 GiB of free memory, 13 minutes of patience
- Do it in this order: clone, download, pull, copy, launch
- Four pitfalls, one of which had been hiding for two months
- Deep dive: how the model is built, and why one Spark reaches 41 tok/s
- One token's path
- RAM for traffic, disk for the dictionary
- 17 to 41.7: more tokens per forward pass
- Nine overlay files, no vLLM rebuild
- Each stream slows down; total throughput goes up
- What my estimate missed
- The full launch command: the exact flags behind every number
- Takeaways
- Three takeaways
TL;DR
NVIDIA ships its own NVFP4 checkpoint of Qwen3.8-Flash-Next. Run as-is on a DGX Spark, without MTP, it decodes at about 17 tok/s. tonyd2wild's recipe gets more out of it without rebuilding vLLM: a stock nightly image with nine Python files bind-mounted over the container's own copies, MTP on, the PLE table left on NVMe, FP8 KV cache. On my GX10 it measures 41.7 tok/s median across 40 prompts, 27.4 on prose, 42–45 on code, and 47.2 aggregate across four concurrent streams; vision and tool calls work. The llama.cpp seat on the same box — "seat" is this series' word for the one inference server that holds port 8000 — probes at 23.38, so this is 78% faster. Cold start is 12m54s and wants 25 GiB of free memory.

A bolt-on modification is one you install in a driveway. Nine parts clip onto what is already there, and when you take them off the car is stock again: nothing cut, nothing welded, the factory never involved. The recipe in this article has that shape. It runs the stock vllm/vllm-openai:nightly image and bind-mounts nine Python files read-only over the container's own copies with -v host:container:ro. Unmount them, restart, and you are back on an unmodified nightly.
This is Part 45 of the DGX Spark series. Part 43 put the same model on this box under llama.cpp with the UD-Q4_K_XL quant: 20.51 tok/s on prose, and the full 262,144-token context inside the 121 GB pool. This part swaps the runtime underneath it. The recipe is tonyd2wild's, published at Qwen3.8-Flash-Next-NVFP4-DGX-Spark; I reproduced it on my own Spark at commit d83f10c (2026-09-05), matched the numbers, and wrote down what it costs to get there.
What you get: 41.7 tok/s median, 27.4 on prose, 47.2 aggregate at four streams
Look at the harness-median row first. That number decides whether 155 GB of disk and a 13-minute load are worth it. The rest of the table explains where it comes from.
| measurement | my GX10 | author's Spark | same-box llama.cpp seat |
|---|---|---|---|
| 40-prompt harness median | 41.7 | 43.9 | 23.38 (fleet probe) |
| prose | 27.4 | 29.0 | 20.51 (Part 43) |
| coding | 42.0–45.0 | 44.3 | — |
| 4 streams (per stream / aggregate) | 26.1 / 47.2 | 26.4 / 47.1 | — |
| 32K prefill | 1,666 tok/s, TTFT 17.3 s | — | — |
MTP is multi-token prediction. A small draft head bolted onto the model guesses the next few tokens, and the main model verifies all of them in a single forward pass rather than one pass per token; when the guesses land, the box emits three tokens for roughly the memory traffic of one. That mechanism is why the same checkpoint moves from 17 tok/s to over 40 without a single weight changing. It is also why prose is the slowest row: a draft head has its lowest acceptance rate on free text, and Part 5 measured the same pattern on V4-Flash.
The 23.38 in the right-hand column deserves a caveat. It is a fleet probe: one generic prompt my monitoring sends to whatever answers on port 8000, not the 40-prompt harness, so treat it as an order-of-magnitude reference rather than a paired result. The paired number is prose, 27.4 here against 20.51 in Part 43, same box and same model. And llama.cpp still wins one workload outright: with n-gram speculation on a repetitive file edit it reached 76.65 tok/s, because a draft source that copies straight out of the prompt beats a learned draft head whenever the answer is mostly already on screen.
What you need: 155 GB of disk, 25 GiB of free memory, 13 minutes of patience
- One DGX Spark (GB10, 128 GB unified memory), tensor-parallel 1. The author's machine is the same class.
- About 155 GB of free disk: 124 GiB (133 GB) for the checkpoint plus the 22.2 GB container image.
- Docker with the NVIDIA container toolkit. No CUDA toolkit on the host, no compiler, no vLLM build.
- At least 25 GiB of
MemAvailablebefore launch, and adrop_cachesimmediately before it. The load bottoms out at 25.6 GiB. - 12 minutes 54 seconds of cold start: 585.81 s for the weights, another 69.16 s for the MTP draft head.
One property of the model explains those memory numbers. Of its roughly 180B parameters (125B main model, 51B PLE, 4B MTP head), 51B are a PLE, a per-layer embedding table that each token reads a few rows out of, closer to a dictionary lookup than to a matrix multiply. The launcher's default staged mode leaves that table on NVMe and gathers only the rows each forward pass needs, so the resident weights come to 76.48 GiB instead of the full 124 GiB on disk.
Do it in this order: clone, download, pull, copy, launch
git clone https://github.com/tonyd2wild/Qwen3.8-Flash-Next-NVFP4-DGX-Spark ~/src/tonyd2wild-nvfp4
cd ~/src/tonyd2wild-nvfp4 && git log -1 --format='%h %ad' --date=short   # d83f10c 2026-09-05
hf download nvidia/Qwen3.8-Flash-Next-NVFP4 --local-dir /home/coolthor/models/qwen38-fn-nvfp4-nvidia
docker pull vllm/vllm-openai:nightly-8a728663c1c3eeace834a95f5654fa653cc1998c
mkdir -p ~/patches && cp -r single-spark-vllm-tp1/patch ~/patches/qwen4exp-ple-mmap   # the launcher's default PATCH_DIR
cp single-spark-vllm-tp1/launch/qwen38fn-nvidia-tp1.sh ~/patches/
PORT=8000 NAME=qwen38fn bash ~/patches/qwen38fn-nvidia-tp1.sh
docker logs -f qwen38fn 2>&1 | grep -m1 'Application startup complete'   # ~13 min
The launcher needs no environment variables for the fast path, because its defaults are the author's 2026-09-05 single-node best. PLE_MODE=staged keeps the 51B table on NVMe. GRAPHS=nocompile captures CUDA graphs for decode at batch sizes 4 through 24 and skips torch.compile entirely. MTP=3 drafts three speculative tokens per step, and in practice around three or more get accepted. DRAFT_VOCAB=65536 restricts the draft head to the lowest 65,536 token ids, using BPE merge order as a stand-in for frequency. It is an FR-Spec idea, and the author credits MiaAI-Lab with demonstrating it on this model. The remainder are ordinary serving knobs: --max-num-seqs 6, --max-num-batched-tokens 4096, --kv-cache-dtype fp8_e4m3, --gpu-memory-utilization 0.80, --max-model-len 262144. Prefix caching is off and stays off. The author cites vLLM issue #54173, a GDN-layer crash with prefix caching enabled, marks it as unverified, and I did not verify it either. Every number in this article was taken without prefix cache.
The nine overlays split three ways. Four are the author's own PLE and MTP implementation: ple_layer.py, ple_mmap.py, model_state.py, and mtp_draft_vocab.py, which lands on the container's mtp.py. Four are unmodified upstream PR code — ops_ple.py from PR #55375 by peakcrosser7, merged 2026-09-05, which fixes a fused-PLE conv state-index stride for MTP and for concurrent prefills; plus ops_qsa.py, qsa.py, and platforms_interface.py from PR #54846 by andreasgru, still open, which puts fp8_e4m3 and NVFP4 KV cache on the QSA path. The ninth is modelopt.py, an upstream file carrying two fixes of the author's own: draft-local MTP index candidates, so that vLLM's mtp.layers.48 finds ModelOpt's mtp.layers.0 quant entry, and a route from FP8_BLOCK_SCALES routed experts to Fp8MoEMethod with its 128×128 block scales. The author notes that sfxnz (MIT) and MiaAI-Lab (AGPL) closed the same two gaps independently on the same day, with no shared code.
Once Application startup complete appears, the smoke test is one request. Send stream_options even if you do not think you need it; the first pitfall below is what happens when you leave it out.
curl -s http://<your-gx10-ip>:8000/v1/chat/completions \
  -H 'Content-Type: application/json' \
  -d '{"model":"qwen38-flash-next",
       "messages":[{"role":"user","content":"Say hello in one sentence."}],
       "temperature":0, "max_tokens":200,
       "stream":true, "stream_options":{"include_usage":true}}'
Four pitfalls, one of which had been hiding for two months
vLLM streams without usage counts unless you ask for them. A streaming response carries no token accounting unless the request includes stream_options: {"include_usage": true}. llama-server attaches usage on its own, so any tok/s script ported over from llama-server divides by nothing on its first run and reports nothing at all.
vLLM validates the model field; llama-server answers to any name. The night I switched, the container log filled with 404s from two scripts on my laptop that were still sending an old model id. They had been broken for two months and nobody noticed, because llama-server replies to whatever string you hand it. Audit every client's model name before you switch runtimes, not after.
--network host takes port 8000 outright. The container binds the port directly, so the existing seat has to be stopped before the new one starts. The production seat was down for 33 minutes, and that figure includes the 13-minute load plus every acceptance test.
Prefix caching is off by design. The launcher disables it because of the crash described above, so a repeated system prompt is re-evaluated every request. If your workload leans on long shared prefixes, budget prefill accordingly.
Deep dive: how the model is built, and why one Spark reaches 41 tok/s
Skip this section if you only want the recipe; everything needed to run it is above. This section covers three things: how the model is built, why leaving a 47.68 GiB lookup table on disk is the right allocation rather than a compromise, and where the 2.5× between 17 and 41.7 comes from. Every one of my numbers in the six figures was measured on this GX10; the author's are labeled as his.
One token's path
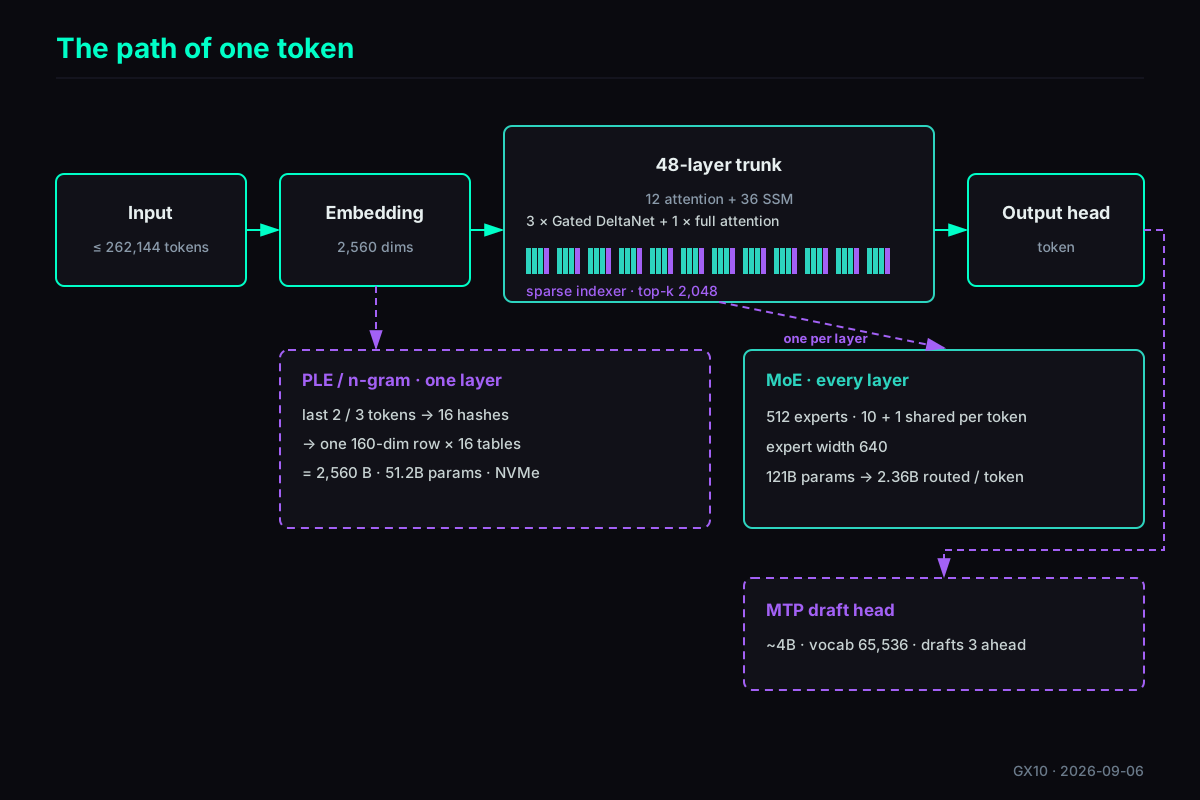
Qwen3.8-Flash-Next is about 180B parameters in three blocks: a 125B main body, a 51.2B n-gram table, and a 4B MTP draft head. The GGUF header describes the following structure:
- A 48-layer trunk in groups of four: three Gated DeltaNet linear-attention layers, then one full-attention layer. The linear-attention layers keep no KV cache; each holds a fixed-size state. Only the full-attention layers store KV, and they carry a DeepSeek-style sparse indexer so each query attends to its top-k 2,048 positions. Twelve of 48 layers store KV, which is the first reason a 262,144-token context fits in 17 GiB.
- One MoE per layer: 512 experts, each only 640 wide; the router picks 10 per token plus one shared expert. Expert parameters total 121B; the 10 routed experts a token touches add up to 2.36B, 2.60B with the shared expert.
- The n-gram table (PLE, per-layer embedding): It hangs off a single early layer of the trunk (
ple_layer_ids=[2]in the HF config,ple.layers=[1]in the GGUF header), and a token consults it once. The last two tokens and the last three tokens of the context are each hashed eight ways, giving eight bigram tables and eight trigram tables of about 20 million rows each. One 160-dim row is fetched from each table, and the 16 rows are concatenated into that layer. Sixteen rows of 160 bytes: 2,560 bytes per token. These 51.2B parameters never enter a matrix multiply. - The MTP draft head: about 4B parameters, proposing three tokens at a time, and choosing only among 65,536 frequent token ids (the FR-Spec approach; the author credits MiaAI-Lab for demonstrating a 65,536-token draft vocabulary on this model).
RAM for traffic, disk for the dictionary
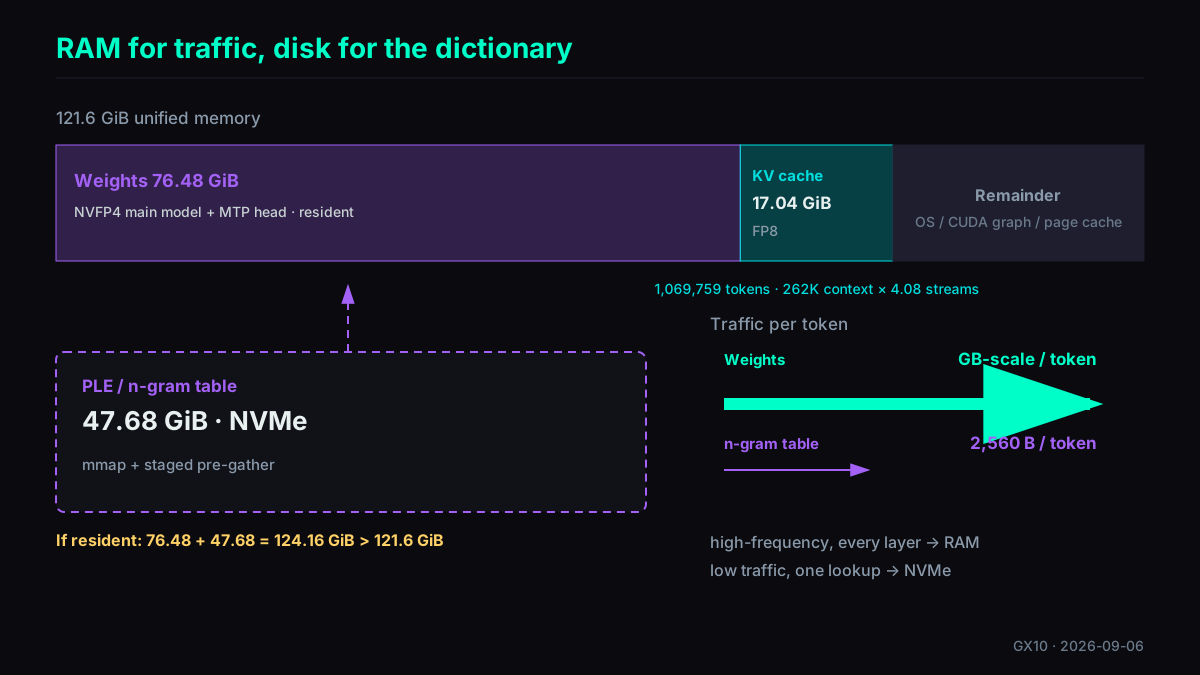
MemTotal on this box is 121.6 GiB, shared between CPU and GPU. Once loaded, the weights are resident at 76.48 GiB (NVFP4 main body plus the MTP head); the FP8 n-gram table is 47.68 GiB. Together that is 124.16 GiB, over the limit before counting KV cache or the operating system. The table has to live on disk simply because it will not fit.
The allocation makes sense on its own terms too. Look at per-token traffic: the 76.48 GiB main body is read for every token at every layer, so its demand on memory is GB-scale; the n-gram table is read 16 rows per token, 2,560 bytes. With the table out of the way, every byte left in memory is high-traffic: weights and KV cache. At --gpu-memory-utilization 0.80, vLLM's KV cache budget comes to 17.04 GiB, which in FP8 holds 1,069,759 tokens, enough for 4.08 concurrent requests at the full 262,144-token context. Force the table in and that budget is gone.
How the table is read from disk determines whether it slows anything down. The recipe defaults to PLE_MODE=staged: before each forward pass, a preadv thread pool gathers the rows that step needs into a fixed GPU buffer. The author measures 131K rows/s that way (plain mmap manages only 10–20K rows/s because of mmap_lock). A decode step needs 16 rows, so the gather is on the order of 0.1 ms against a step of tens of milliseconds, and because the buffer's address is fixed, the decode path can run as a CUDA graph.
Prefill is a different matter. A 32K prompt gathers 524,288 rows, and each 160-byte row touches a full 4 KiB page: 25.6× read amplification. On my box, 32K prefill measures 1,666 tok/s and short-prompt TTFT sits between 0.21 and 0.28 s; the author's table reads 1,269 tok/s at 7K, 1,757 at 28K and 1,760 at 113K with a 0.30 s TTFT, so throughput does not fall off with length. I could not measure how much faster prefill would be with the table resident, because the table does not fit on this box. Unsloth's GGUF build keeps an IQ4_NL version of the same table, 26.85 GiB, fully resident, so its prefill numbers are not directly comparable.
17 to 41.7: more tokens per forward pass
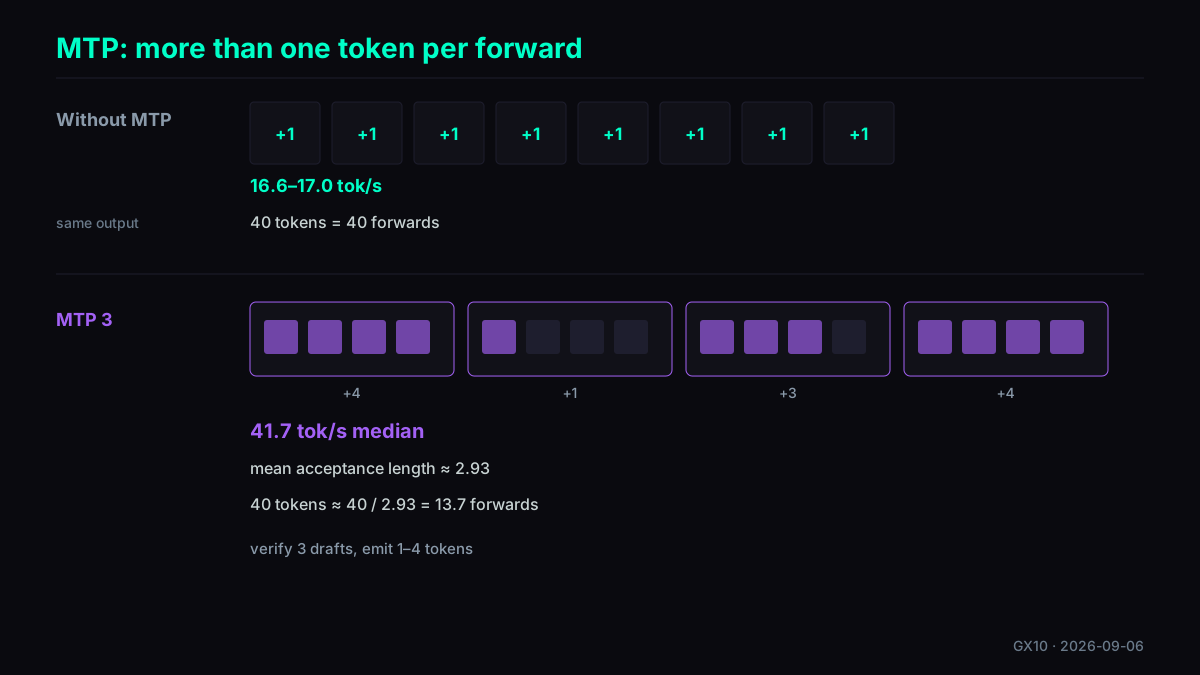
NVIDIA's checkpoint without MTP decodes at 16.6–17.0 tok/s, prose and code alike. Without MTP, single-stream decode is limited by how much memory each token has to move: the main body reads an effective 9.27 GiB per token, which at the measured speed works out to 154–158 GiB/s, about 60% of the 273 GB/s spec. A smaller quantization would not move that number; post 32 measured that NVFP4 is fast because of compression, not because of the FP4 arithmetic unit.
MTP changes "one trip through the weights buys one token" into "one trip buys several". The draft head proposes three, the main body verifies all three in one forward pass, keeps however many it accepts, and adds one token of its own. Summed over the whole harness, a step yields 2.93 tokens on average. The rest of the gap comes from three things: decode runs as a CUDA graph rather than through torch.compile, the draft head computes logits over 65,536 ids instead of the full vocabulary, and FP8 KV lets the same memory hold twice the tokens.
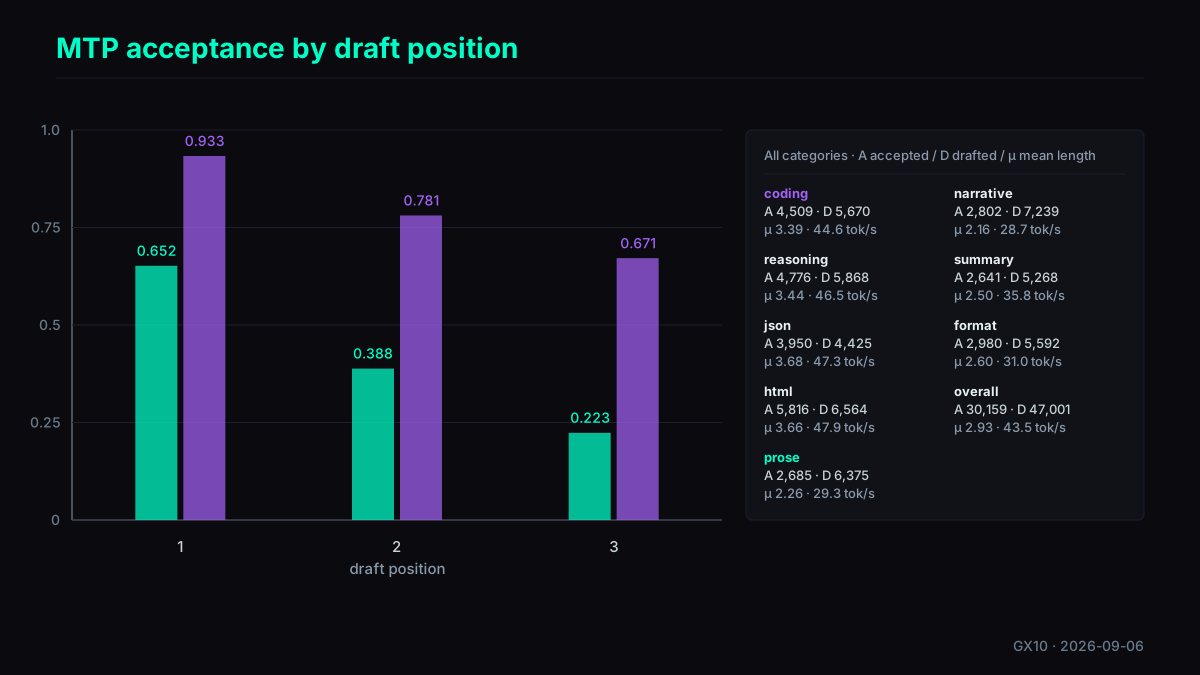
Prose 27.4, code 42–45: that gap does not exist without MTP. The next token of code is easy to guess (indentation, brackets, keywords), and the draft head's acceptance at the three positions is 93% / 78% / 67%; on prose it is 65% / 39% / 22%. The 27B in post 42 going from 12.3 to 65 was the same effect, with code at 65 against long-form prose at 28 on that box.
Nine overlay files, no vLLM rebuild
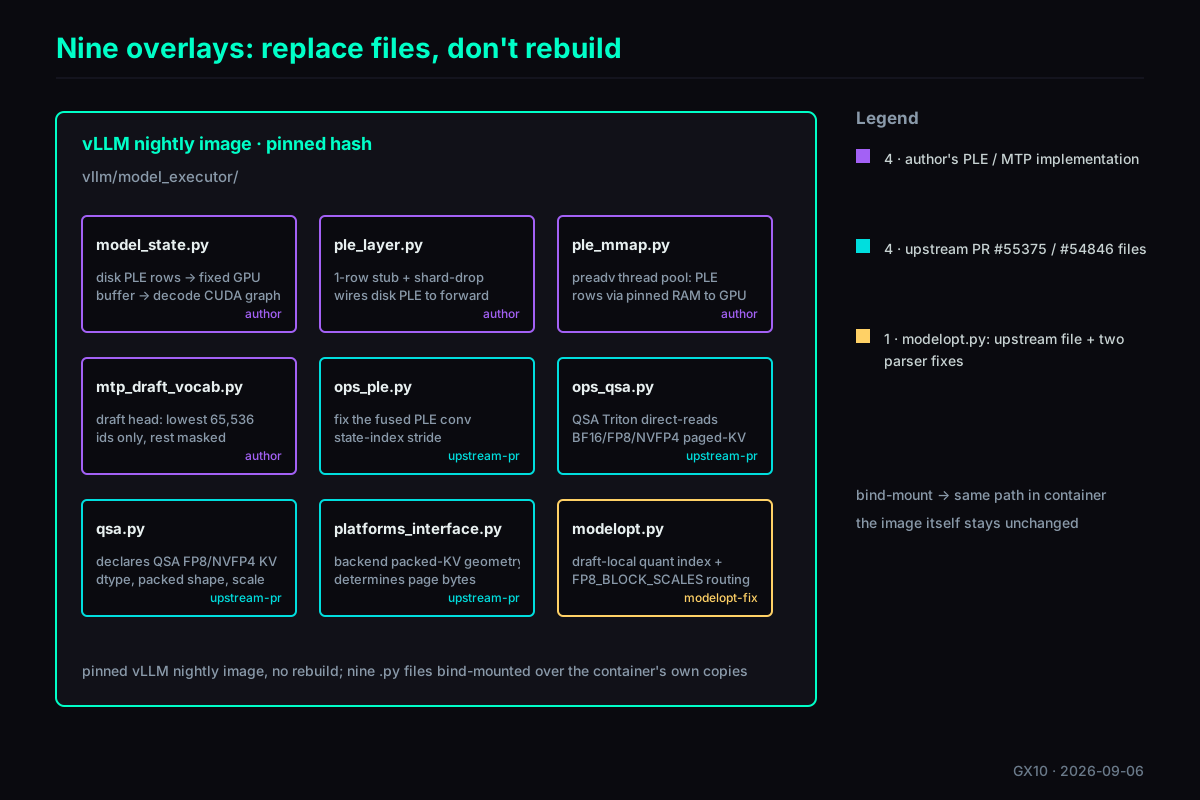
The recipe does not rebuild vLLM. It pins a nightly image by hash and, at startup, bind-mounts nine Python files with -v over their counterparts inside the container. Four are the author's own PLE staged loader and MTP implementation; four are files from upstream PRs not yet in the nightly (#55375 fixes the PLE conv stride, #54846 gives the QSA path FP8 KV); the last is modelopt.py, the upstream file plus two fixes.
With MTP enabled, the two bugs surface as this load-time error:
AttributeError: Layer mtp.layers.48.mlp.experts has no parameter 'w2_weight_scale_inv'
  for checkpoint weight 'mtp.layers.48.mlp.experts.0.down_proj.weight_scale_inv'
The checkpoint quantizes the MTP experts as FP8_BLOCK_SCALES (group 128) under the key mtp.layers.0.mlp.experts; vLLM numbers the MTP layer mtp.layers.48, and the draft config remaps ignored_layers and exclude_modules but not quantized_layers, so the quantization entry is never found. Even with the prefix right, the RoutedExperts branch in modelopt.py only recognizes FP8, NVFP4, W4A16_NVFP4 and MXFP8. The overlay patches exactly those two places.
Each stream slows down; total throughput goes up
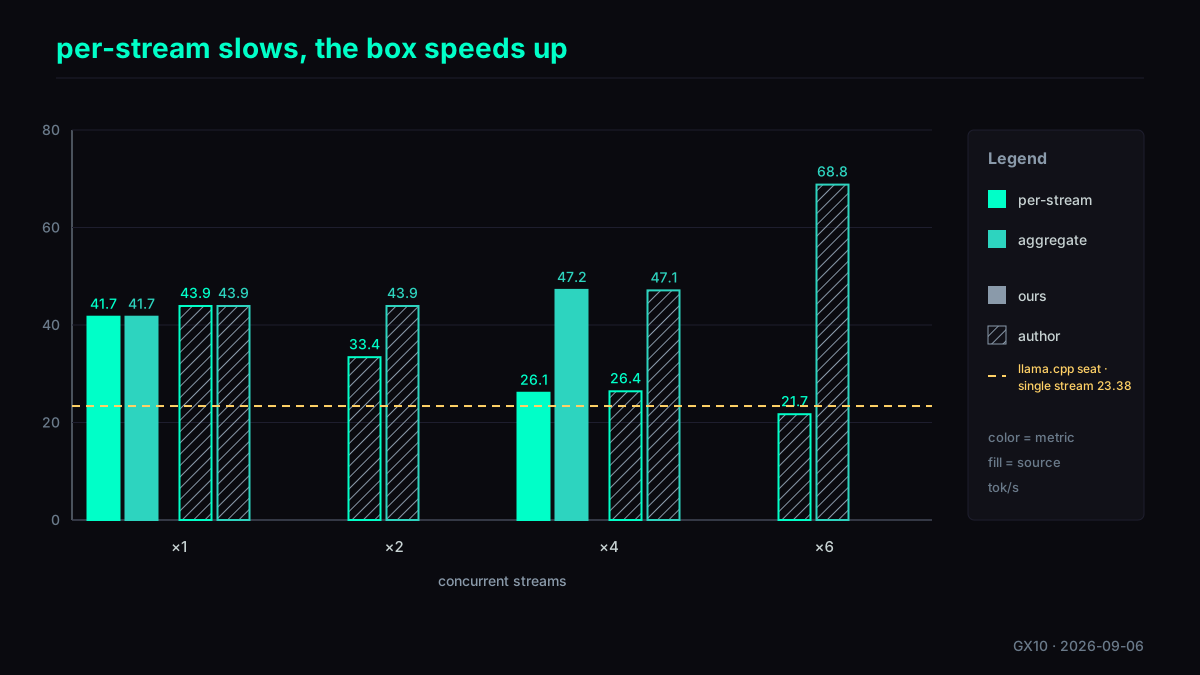
Decode is bound by memory bandwidth: one forward pass moves the weights once and serves every stream in the batch, so aggregate throughput rises while per-stream throughput falls. Four concurrent streams measure 26.1 each and 47.2 aggregate; the author's six streams measure 21.7 each and 68.8 aggregate. The author ran six streams and I ran four; 17.04 GiB of KV holds 4.08 streams at the full 262K context, more at shorter ones.
On the first pass every single-stream category came in under the author's: prose 27.4 against 29.0, JSON 44.3 against 49.3, summary 31.0 against 35.4, a 2–12% gap; the concurrent numbers matched almost exactly, 26.1 / 47.2 against 26.4 / 47.1. Because the concurrent results match, neither the GPU nor memory bandwidth is likely responsible. That leaves sample size: the harness has five prompts per category. To draw Figure 4 I reran each category until it had at least 15 ten-second metrics windows, 25–26 rounds for the short-answer categories, 9 for coding and 3–5 for the long ones, 500 prompts in all. That pass measures prose 29.3, code 44.6, reasoning 46.5, JSON 47.3, HTML 47.9, narrative 28.7, summary 35.8 and formatting 31.0, against the author's 29.0 / 44.3 / 45.6 / 49.3 / 47.6 / 28.5 / 35.4 / 32.4: all eight within ±4.4% with formatting the widest at −4.3%, and the overall median, weighted back to the original 40 prompts, is 43.6 against his 43.9. The title and the first section keep the first pass's 41.7; the 43.6 lives here.
What my estimate missed
On the morning of September 6 I used "floor 17 × MTP +35% ≈ 23" to decide that patching vLLM was not worth it, and that afternoon I read the author's 43.9. What my estimate left out is everything in this section: the acceptance length is not +35% but 2.93 tokens per step, on top of CUDA graphs, FR-Spec's small draft vocabulary and FP8 KV. Nothing short of running it would have caught that.
The full launch command: the exact flags behind every number
The launcher wraps this, but here is what it expands to, including the cache flush the author's README asks for on every start.
# Before every start (author's README):
sync; echo 3 | sudo tee /proc/sys/vm/drop_caches

docker run --gpus all -d --restart no --network host --ipc host \
  --shm-size 32g --ulimit memlock=-1:-1 --name qwen38fn \
  -e HF_HUB_OFFLINE=1 -e TRANSFORMERS_OFFLINE=1 \
  -e VLLM_ENGINE_READY_TIMEOUT_S=3600 \
  -e PYTORCH_CUDA_ALLOC_CONF=expandable_segments:True \
  -e CUTE_DSL_ARCH=sm_121a -e TORCH_CUDA_ARCH_LIST=12.1a \
  -e FLASHINFER_CUDA_ARCH_LIST=12.1a -e FLASHINFER_DISABLE_VERSION_CHECK=1 \
  -e VLLM_USE_DEEP_GEMM=0 -e VLLM_USE_V2_MODEL_RUNNER=1 \
  -e QWEN4EXP_PLE_MMAP=1 -e QWEN4EXP_PLE_STAGED=1 \
  -e QWEN4EXP_PLE_MMAP_THREADS=64 -e QWEN4EXP_DRAFT_VOCAB=65536 \
  -v /home/coolthor/models/qwen38-fn-nvfp4-nvidia:/models/qwen38fn:ro \
  -v /home/coolthor/qwen38fn-vllm-cache:/root/.cache \
  -v $P/ple_layer.py:$VP/models/qwen4_exp/nvidia/ple_layer.py:ro \
  -v $P/ple_mmap.py:$VP/models/qwen4_exp/nvidia/ops/ple_mmap.py:ro \
  -v $P/model_state.py:$VP/models/qwen4_exp/nvidia/model_state.py:ro \
  -v $P/mtp_draft_vocab.py:$VP/models/qwen4_exp/nvidia/mtp.py:ro \
  -v $P/upstream-overlays/ops_ple.py:$VP/models/qwen4_exp/nvidia/ops/ple.py:ro \
  -v $P/upstream-overlays/ops_qsa.py:$VP/models/qwen4_exp/nvidia/ops/qsa.py:ro \
  -v $P/upstream-overlays/qsa.py:$VP/models/qwen4_exp/nvidia/qsa.py:ro \
  -v $P/upstream-overlays/platforms_interface.py:$VP/platforms/interface.py:ro \
  -v $P/upstream-overlays/modelopt.py:$VP/model_executor/layers/quantization/modelopt.py:ro \
  vllm/vllm-openai:nightly-8a728663c1c3eeace834a95f5654fa653cc1998c \
  --model /models/qwen38fn \
  --served-model-name qwen38-flash-next qwen3.8-flash-next \
  --quantization modelopt --trust-remote-code \
  --max-model-len 262144 --max-num-seqs 6 --max-num-batched-tokens 4096 \
  --kv-cache-dtype fp8_e4m3 --gpu-memory-utilization 0.80 \
  --no-enable-prefix-caching --no-enable-flashinfer-autotune \
  --compilation-config '{"mode":0,"cudagraph_mode":"FULL_DECODE_ONLY","cudagraph_capture_sizes":[4,8,12,16,20,24]}' \
  --speculative-config '{"method":"mtp","num_speculative_tokens":3}' \
  --reasoning-parser qwen3 \
  --enable-auto-tool-choice --tool-call-parser qwen3_xml \
  --default-chat-template-kwargs '{"enable_thinking": false}'

# $P  = ~/patches/qwen4exp-ple-mmap                   (host: the nine overlay files)
# $VP = /usr/local/lib/python3.12/dist-packages/vllm  (container: the vLLM package root)
Cold start ran 12 minutes 54 seconds end to end: 585.81 s for the weights and 69.16 s for the MTP draft head. The vLLM log reported Model loading took 76.48 GiB, and the KV cache allocated alongside it holds 1,130,661 tokens, which is 4.31× the 262,144-token context (the production seat's later restart logged 17.04 GiB, 1,069,759 tokens and 4.08×; the deep dive and Figure 1 use that set). MemAvailable bottomed at 25.6 GiB during the load, settled at 14.3-14.9 GB in steady state, and dipped to 12.9 GiB during the 32K prefill. About 4 GB of swap was in use throughout and earlyoom, configured at -m 6, never fired. Short-prompt TTFT sat between 0.21 and 0.28 s. The 32K prefill took 28,903 input tokens in 17.3 s, about 1,670 tok/s, and the needle I planted mid-prompt, PELICAN-7, came back. Vision and tool calling both work off this same server. A 64×64 red PNG produced the answer "Red"; a Taipei weather request using a get_weather schema returned {"city":"Taipei"} with finish_reason: tool_calls.
| category | my GX10 | author's Spark |
|---|---|---|
| prose | 27.4 | 29.0 |
| coding | 42.0–45.0 | 44.3 |
| reasoning | 44.6 | 45.6 |
| JSON | 44.3 | 49.3 |
| HTML | 46.8 | 47.6 |
| narrative | 27.7 | 28.5 |
| summary | 31.0 | 35.4 |
| formatting | 30.3 | 32.4 |
| harness median | 41.7 | 43.9 |
| 4 streams (per stream / aggregate) | 26.1 / 47.2 | 26.4 / 47.1 |
| 6 streams (aggregate) | not run | 68.8 |
| eager mode + MTP3, no CUDA graphs | not run | 35.2 |
Takeaways
Three takeaways
- RAM for traffic, disk for the dictionary. The 47.68 GiB n-gram table is read 2,560 bytes per token; leaving it on NVMe hands the freed memory to KV cache, enough for four concurrent 262K-token requests. The price is paid in prefill, not in decode.
- The better MTP guesses, the wider the gap between prompt types. Without MTP it is 17 tok/s, prose and code alike; with it, a step yields 2.93 tokens on average, and the gap between prose at 27.4 and code at 42–45 is entirely acceptance rate.
- Unmerged fixes without rebuilding vLLM. Nine bind-mounted files are the whole recipe; when you update the image, diff those nine container paths against the new image rather than the whole repository.
FAQ
- How fast is Qwen3.8-Flash-Next NVFP4 on a DGX Spark?
- 41.7 tok/s median across a 40-prompt harness on my GB10, with prose at 27.4, coding at 42.0-45.0, and 47.2 tok/s aggregate across four concurrent streams. The recipe's author measured 43.9 median on the same class of machine. The same NVIDIA checkpoint without MTP runs 16.62-17.01 tok/s, so most of the gain comes from the recipe's speculative-decoding and CUDA-graph configuration rather than from the NVFP4 weights themselves.
- Do I need to rebuild vLLM to run the NVIDIA NVFP4 checkpoint with MTP?
- No. The recipe runs the stock `vllm/vllm-openai:nightly` image and bind-mounts nine Python files read-only over the container's own copies. Four of those files are the author's PLE and MTP implementation, four are unmodified code from upstream PRs #55375 and #54846, and one is an upstream file carrying two fixes for the ModelOpt quantization parser. Unmount them and the container is stock again.
- How much disk and memory does the NVFP4 recipe need on a GB10?
- About 155 GB of disk: 124 GiB (133 GB) for the checkpoint plus a 22.2 GB container image. Memory is tighter than it looks, because the launcher wants at least 25 GiB of MemAvailable before it starts and the load bottoms out at 25.6 GiB. Cold start took 12 minutes 54 seconds and the vLLM log reported `Model loading took 76.48 GiB`, leaving room for a KV cache of 1,130,661 tokens.
Read next
- 2026-07-07DGX Spark in 2026: What Still Works, What Broke, and What I'd Run Today
A current 2026 guide to running local AI on DGX Spark: vLLM, official Gemma 4 NVFP4 weights, MTP, long-context multimodal options, and the traps still worth avoiding.
- 2026-06-01[Benchmark] NVFP4 W4A4 beats FP8 on a DGX Spark MoE: 67 vs 52 tok/s once CUDA graphs fire
On a GB10 DGX Spark, NVFP4 W4A4 went from 23 to 67 tok/s the moment I dropped --enforce-eager — beating FP8 by 29% and saving 16GB. The catch from Part 32 was real, just dense-only.
- 2026-05-06Liftoff: Gemma 4 hits 670 tok/s aggregate on DGX Spark (108 tok/s single-stream)
Google announced Multi-Token Prediction drafters for Gemma 4 on 2026-05-05. The vLLM PR was opened and approved the same day; a preview Docker image shipped hours later. I tested it on DGX Spark: Gemma 4 26B-A4B-it FP8 + MTP γ=4 hits 108.78 tok/s single-stream (2.66× baseline), 674.28 tok/s aggregate at concurrency=8. One undocumented trap: the drafter pairs with -it, not base.
- 2026-09-28[DGX Spark] Qwen3.8-Flash-Next on two DGX Sparks: 51.9 to 72.0 tok/s, and a draft vocabulary built from my own text
Sixteen days after Part 46, the same 40 prompts go from 51.9 to 72.0 tok/s with no score loss. The biggest gain: an MTP draft vocabulary built from my own Chinese text. Multi-turn TTFT fell from 3.30 s to 0.23 s.
Don't miss the next one
Subscribe, and you won't.
One-click unsubscribe anytime.