DGX Spark · part 48
[DGX Spark] Two hard power-offs, reproduced on purpose — the fix, and why we turned it off again
❯ cat --toc
- Preface
- The machine died twice, both times on the second back-to-back native run
- Five places that should have held evidence were empty, and that is the answer
- Reproducing it needed the thermometer to sit outside the machine
- On this box nvidia-smi read 8 to 15 degrees low, and it would have told me the machine was fine
- Capped at 2200 MHz, the run that died at 156 s finished at 251 s
- Two flags get you through the run. They do not fix the machine
- We turned the cap off again, because the cost depends on the shape of the workload
- Cap it if your workload holds full load for minutes; skip it if your pipeline breathes
- Deep dive: not memory, not the chip failing to protect itself, and not missing firmware
- 104 GiB survived and 74 GiB died, so memory is not the variable
- The chip was already throttling below our cap, and it died anyway
- Two wrong turns I took
- Firmware is current, and a forum thread title is itself the negative result
- The fix already existed, and it was in my own house
- Environment
TL;DR
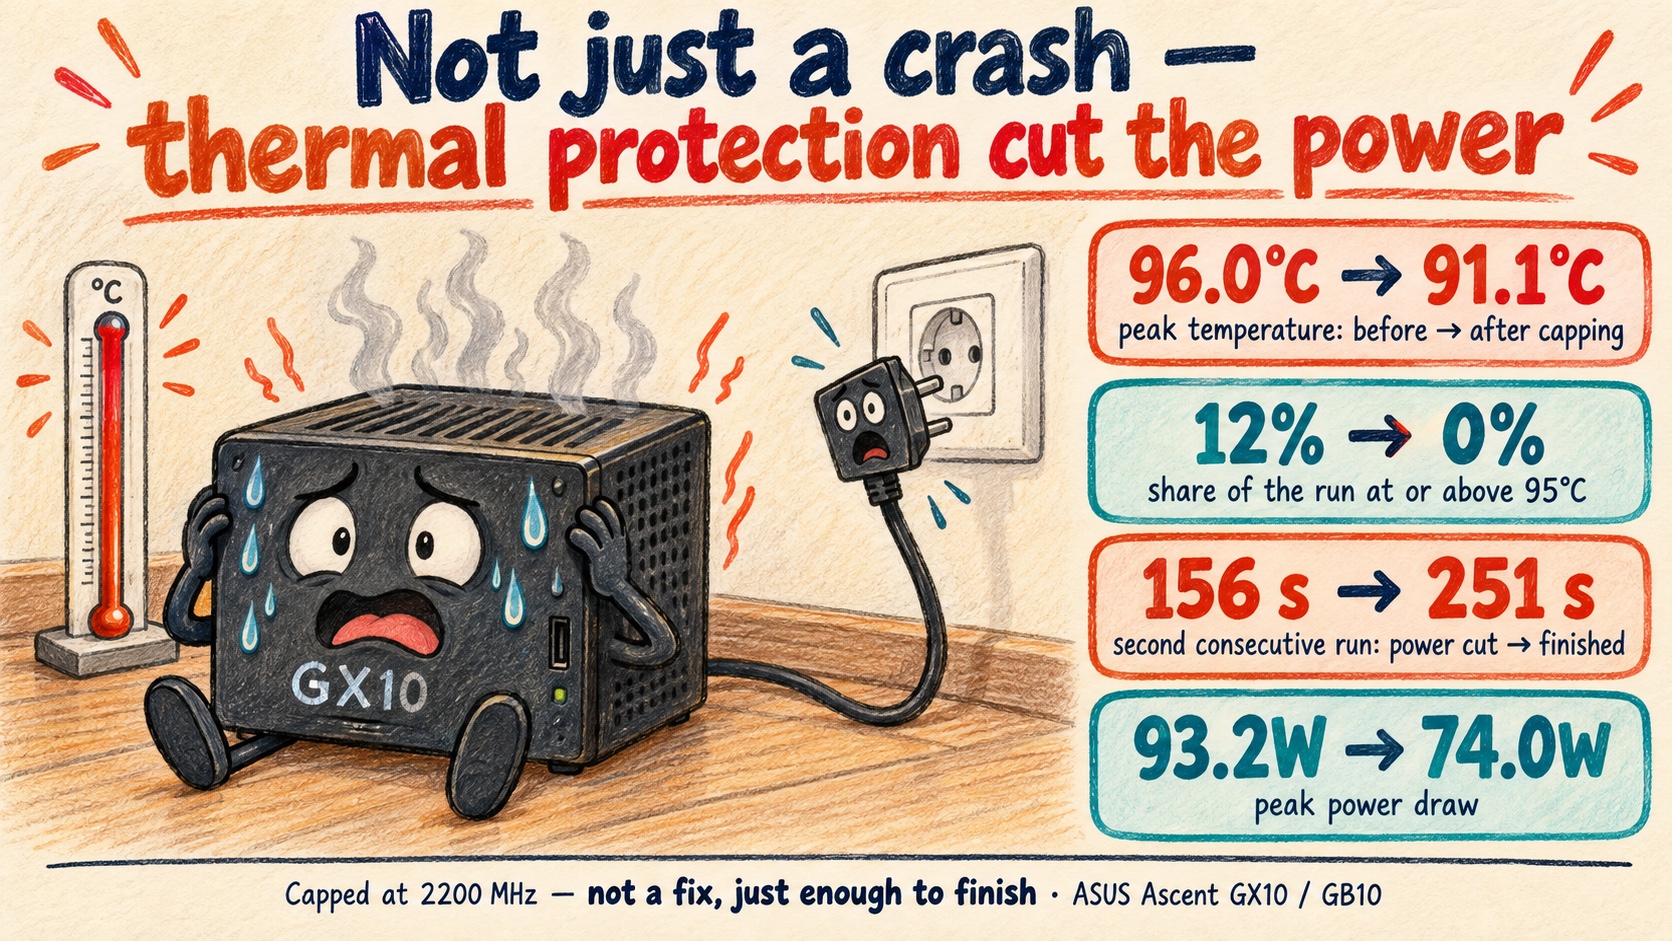
My GX10 — an ASUS Ascent box on the same GB10 part as a DGX Spark — cut power twice in one day, both times on the second back-to-back native MiniMax-H3 run at 1344x768. Not just a crash: thermal protection pulled the plug before the OS got a word out. I reproduced it on purpose with the thermometer outside the machine: uncapped, run two died at 156 s; capped with nvidia-smi -lgc 300,2200, the same run finished at 251.302 s. Time at or above 95 °C went from 12% of the run to 0%, peak power from 93.2 W to 74.0 W. Capping is a workaround, not a fix — the defect stays. Caveat: nvidia-smi reads 8-15 °C low and will tell you the machine is fine.
Preface
The previous article has one cell I could not fill: a second consecutive native run, uncapped. Every time I tried, the machine turned itself off.
Not a hang. Not a kernel panic. Off. Someone walks over to the desk and presses the button.
That happened twice in one day, so I stopped benchmarking and went after it instead. What follows is not a new bug. It is a known defect that other people had already reported, that had a community fix sitting on GitHub, and that my own second machine had been quietly mitigating for two months. So I reproduced it deliberately, with the instrument outside the machine, and what follows is the capped-versus-uncapped comparison that came out of it.
The machine died twice, both times on the second back-to-back native run
The job was video-generation benchmarking on an ASUS Ascent GX10 — GB10 chip, 121 GiB of unified memory. MiniMax-H3 generating natively at 1344x768, about 200 s a run, GPU pinned at full load from the first second to the last. This was the control arm for the two-stage pipeline in the previous article.
The second failure has the cleanest timeline, because both runs happened inside one ComfyUI process:
15:41:31   run 1 starts
15:45:20   run 1 finishes, 201.852 s — machine alive
           201 seconds of unbroken full load
15:45:20   run 2 starts immediately, no gap
15:46:50   power gone — 90 seconds in
Run one survives. Run two, starting from a board that never got to cool down, does not.
Five places that should have held evidence were empty, and that is the answer
I went looking for a cause the normal way, and came back with nothing five times:
journalctl -b -1stops mid-line on an ordinary entry. The last record is a routine tailscaled session close./sys/fs/pstore/is empty.- The SBSA hardware watchdog (
RuntimeWatchdogSec=10s) never fired. There was no auto-reboot between the two boots. - The peer machine, on a direct ConnectX-7 link, saw both mlx5 ports go
Link downin the same second. Zero AER, zero driver reset. - RJ45 shows
Link detected: yes, and roughly 740 Wake-on-LAN magic packets did nothing.
Five dead ends, all consistent with one explanation: the power went before anything could be written down. journald stops mid-line. pstore never gets written. The watchdog cannot reboot a board with no power in it. The NIC drops carrier in the same instant.
Be careful with the word because here. These observations are consistent with that story rather than proof of it. A watchdog can also stay quiet because systemd is still feeding it, and a NIC losing link does not necessarily raise a PCIe AER event at all — I can say I saw no AER, not that there was no time to raise one. What actually points at power is having to walk over and press the button.
It is not a crash. There is no power. Once you accept that, the missing evidence stops being frustrating and starts being the diagnosis.
Reproducing it needed the thermometer to sit outside the machine
The lethal combination was already obvious from two identical failures: native 1344x768, two runs back to back with no gap. Run one survives, run two dies around 90 s in.
The real problem was different: neither failure left a curve. A hard power-off eats whatever has not been flushed to the machine's own disk, and the unflushed part is exactly the part worth looking at. Anything I logged locally would die with the machine.
So the instrument went outside. Sampling every 2 seconds, streamed live over ssh to a MacBook:
/sys/class/thermal/thermal_zone*/temp                              — package temperature
nvidia-smi --query-gpu=clocks.current.sm,power.draw,utilization.gpu — clock, watts, load
When the box dies, the samples are already off it.
On this box nvidia-smi read 8 to 15 degrees low, and it would have told me the machine was fine
This one deserves to stand on its own, because it nearly cost me the whole investigation.
On this machine the nvidia-smi temperature read 8 to 15 degrees below the ACPI zone I was sampling. When nvidia-smi said 75-84 °C, that zone was already sitting at 92-98 °C. Thread 379195 records a comparable gap, 84 °C against 93.1 °C, so it is not unique to my box — but I have not established it as a rule for the part, and thermal_zone* is a set of sensors rather than one package temperature, so check which zone you are reading.
I had planned to watch nvidia-smi. It would have shown me the eighties on a machine that was about to cut its own power, and I would have written down "it is not hot" and gone looking somewhere else entirely. Read /sys/class/thermal/thermal_zone*/temp. Not the GPU tool.
Capped at 2200 MHz, the run that died at 156 s finished at 251 s
Four runs, one machine, one workflow, one day. Two uncapped, two with the GPU locked to 2200 MHz.
| uncapped | capped at 2200 MHz | |
|---|---|---|
| measured clock under load | 2450, self-throttling to 1475 | 2164-2184 throughout |
| run 1 (cold), peak acpitz | 95.5 °C | 88.7 °C |
| run 2 (warm), peak acpitz | 96.0 °C | 91.1 °C |
| run 2, share of time at or above 95 °C | 12% | 0% |
| peak power draw | 93.2 W | 74.0 W, down 21% |
| run 1 | survived, 226 s | survived, 246.627 s |
| run 2 — the killer | DIED at 156 s | survived, 251.302 s |
The last sample that made it off the machine before it died:
10:34:54 acpitz=92.2 GPU=84 util=96% 77.5W clk=2385
And then nothing. No shutdown line, no final flush, no next sample two seconds later.
Note the two temperature columns on that last row: acpitz=92.2 while nvidia-smi reports 84. That is the 8-to-15-degree gap, caught in the act, on the sample immediately before the power went.
Two flags get you through the run. They do not fix the machine
sudo nvidia-smi -pm 1 && sudo nvidia-smi -lgc 300,2200
Default boost on this part is about 2418. Capped at 2200, the same back-to-back pair that killed the machine completes.
The temperature tells it best. Peak goes from 96.0 °C to 91.1 °C, and the share of the run spent at or above 95 °C goes from 12% to zero. The run that killed the machine at 156 s now finishes at 251.302 s. Peak power drops from 93.2 W to 74.0 W at the same time.
This is a way around the defect, not a repair. It is still in the machine. One NVIDIA forum thread title says, in so many words, that it persists after a full platform firmware update; another ends in a fieldiag FAIL and an approved RMA. Firmware is not a settled answer either way — a third thread reports its power-offs stopping after an EC and SoC update. Capping just slows the heat down enough that it never reaches whatever the controller is watching. What you buy is a run that finishes, not a machine that is fixed.
(It costs around 9%: within one session the uncapped first run was 226 s against 246.6 s capped. Measure that on your own workload rather than borrowing mine — there is a section below on why.)
The trap: do not read Applications Clocks or Max Clocks to see whether the cap took. They still report 2418 and 3003. Neither moves when you lock, because neither is the ceiling you just set — one is the application-clock setting, the other the design maximum. What you want is the current clock under load, which nvidia-smi -q -d CLOCK does report, or --query-gpu=clocks.current.sm. I looked at those two unchanged numbers and nearly concluded the lock had silently failed.
We turned the cap off again, because the cost depends on the shape of the workload
Twenty percent is not a constant. It is what you pay when your workload never lets go of the clock ceiling.
| workload | uncapped | capped 2200 | cost |
|---|---|---|---|
| native H3 1344x768, 4 steps | 226 s | 246.6 s | 9% |
| two-stage pipeline (warm) | 66.1 s | 70.4 s | 6% |
Native runs 200 seconds unbroken with every one of them pressed against the ceiling. The two-stage pipeline breaks for VAE decode, a handoff and a re-encode, so a smaller share of it is capped in the first place.
That same difference explains which runs killed the machine. The two-stage pipeline ran four times on this box without a single failure, at a memory peak of 104 GiB — higher than the 74 GiB in use during the crashes. Uncapped, one warm two-stage run takes 66.1 s and peaks at 74 °C, nowhere near the 95-plus of the failures. It never sits at the top long enough.
So the cap is off on this machine now, because it will not be running large native video jobs again. The unit file stays where it is in /etc/systemd/system/, and one line brings it back:
sudo systemctl enable --now gb10-clock-cap.service
Cap it if your workload holds full load for minutes; skip it if your pipeline breathes
If you run jobs that stay at full load for two or three hundred seconds without a break — native video generation, long training steps, a power stress test — cap the clock. The 9% is cheap next to walking over to press a button, and cheaper still than the run you lose.
If your pipeline has natural interruptions in it, you may never hit this at all, and you do not need to pay for insurance against it. Measure your own longest unbroken stretch of full load before you decide.
Deep dive: not memory, not the chip failing to protect itself, and not missing firmware
Everything above is what you need to run the machine. This part is the three explanations I ruled out, the two wrong turns I took, and where the fix had already been sitting.
104 GiB survived and 74 GiB died, so memory is not the variable
The obvious first guess on a 121 GiB unified-memory box is that something ran out of room.
| what ran | longest unbroken full load | memory peak | outcome |
|---|---|---|---|
| two-stage, cold | ~110 s | — | survived |
| two-stage, warm | ~67 s | 104 / 121 GiB | survived |
| native, single run | 201.8 s | 74 / 121 GiB | survived, barely |
| native, second consecutive | no gap | 74 / 121 GiB | died |
The 104 GiB run survived. The 74 GiB runs are the ones that died. Whatever decides the outcome, it is not how much memory was in use — the heaviest memory load on the machine is also the one that never failed. What separates the rows is the length of the unbroken stretch at full load.
The chip was already throttling below our cap, and it died anyway
The second guess is that the chip failed to protect itself and a cap does the protecting. The samples say otherwise: uncapped, it was already throttling, and further down than we ever locked it.
| uncapped run 1 | uncapped run 2 | capped (both runs) | |
|---|---|---|---|
| clock min / median | 1735 / 2340 | 1475 / 2288 | 2164 / 2171 |
| share of samples below 2200 | 13% | 26% | — |
It went down to 1475, well below our 2200 cap, and cut power anyway. And it throttled harder on run two than run one — 26% of samples below 2200 against 13% — which is the chip reacting to a board that was already hot.
The difference is timing, not depth. Dynamic throttling reacts after things are hot; by the time the clock comes down, the heat is already in the board. A static cap never makes that heat in the first place.
Be careful how far you push that. The only claim the data supports is: hot enough for long enough and it cuts power. It does not support a threshold. Death came at 92.2 °C, the machine sat on a plateau between 89 and 96 °C for minutes, and run one touched 95.5 °C and lived. Anyone quoting you a magic number, me included, is reading more out of this curve than is in it.
One more thing worth reading off the capped runs: there is no throttling at all. Cold and warm capped runs have identical clock distributions across all four statistics — min, p5, median and max. Thermal throttling would put the hotter run lower; it does not. Sitting at 2164-2184 just under a 2200 cap is clock binning, not the chip pulling back.
Two wrong turns I took
One: I blamed the kernel first. I checked 6.17.0-1032-nvidia and driver 580.173.02, found both current and known-good, and noted that my second machine on the same kernel was fine. Clean reasoning with a hole in it: the second machine was idle. An idle machine on the same kernel proves nothing about that kernel under load. I was comparing a machine that was working hard against one that was doing nothing and calling it a controlled comparison.
Two: I nearly used the wrong thermometer. The nvidia-smi gap above. Planning to watch the tool that read 8 to 15 degrees low here, on a problem that is entirely about temperature.
Firmware is current, and a forum thread title is itself the negative result
SBIOS  GX10DGX.0105.2026.0505.1153   (ASUS ships 0105 after 0104)
EC     fwupdmgr reports current
Model  ASUSTeK GX10 (ASUS Ascent GX10), not an NVIDIA FE, so warranty goes through ASUS
My SBIOS is the version ASUS ships after 0104, and fwupdmgr says the EC is current, so updating firmware was not going to be the answer on this box.
The wider evidence on firmware is split, and I had only read half of it. One thread puts its negative result in the title: "hard power off under sustained GPU load at 90W — persists after full platform firmware update". But 377365 reports the opposite outcome — after an EC and SoC firmware update its hard power-offs stopped, and PowerStress ran to completion, failing on thermals instead. So "firmware does not fix it" is not settled. It did not fix mine.
The fix already existed, and it was in my own house
This is not a new problem. The community reports predate mine:
- Hard freezes under sustained inference — same driver 580.173.02, also running MiniMax-H3 inference; temperatures climbed to the levels they record within about two minutes and the machine then hard-froze. A freeze, not a power cut — a different failure from mine.
- partnerdiag powerstress reproducibly hard-powers off the box — acpitz climbing from 88 to 97.8 °C in five seconds.
- fieldiag powerstress FAIL, RMA approved.
And a fix already existed on GitHub: tonyd2wild/dgx-spark-hard-poweroff-fix.
Here is the uncomfortable part. That author is also the source of the TP=2 serving recipe I have been running for weeks. His repo had been sitting at ~/src/tonyd2wild-nvfp4/ on our machines for two months.
It gets worse. The systemd unit on our second machine has carried this description since the day it was written:
Description=GB10 GPU clock cap (2200 MHz)
            — mitigates the EC hard power-off under sustained load
That second machine has never failed. I read that line for the first time after the first machine had already died twice.
So let me be honest about what this article actually contributes. Not "we found a new problem". We independently reproduced a known defect and ran a capped-versus-uncapped comparison on one machine, one workflow, one day.
I had wanted to claim more than that — that I supplied the curve every other report was missing. Checking before publishing, thread 377365 already describes an external 1 Hz thermal sampler and publishes timestamped readings from before its power-off. So that claim is gone. The comparison is what is left, and it is enough.
Environment
Machine    ASUS Ascent GX10 (GB10), 121 GiB unified memory
OS         DGX OS, kernel 6.17.0-1032-nvidia, driver 580.173.02
SBIOS      GX10DGX.0105.2026.0505.1153
Sampling   every 2 s: thermal_zone + clocks.current.sm + power.draw, streamed off-box over ssh
Raw data   RUN-native-CRASHED (527 samples), RUN-capped2200-SURVIVED
The benchmark that kept killing this machine: MiniMax H3 Super Acceleration on a DGX Spark · The other way a Spark loses power, and how to tell them apart: 30 W safety mode, 100 W cap and the 5 W driver bug
FAQ
- Why does my DGX Spark power off completely under sustained GPU load?
- The embedded controller cuts power on a thermal or overcurrent fault, and it does it faster than Linux can write anything down. That is why the evidence is missing everywhere you would look: journald stops mid-line, /sys/fs/pstore is empty, the 10-second hardware watchdog never fires because it loses power before it expires, and the network ports drop carrier with no AER event. It is not a crash. There is no power.
- How do I stop the DGX Spark hard power-off?
- Cap the GPU clock: sudo nvidia-smi -pm 1 && sudo nvidia-smi -lgc 300,2200. Default boost is about 2418 MHz. In my test the second of two back-to-back native MiniMax-H3 runs died at 156 s uncapped and finished at 251.302 s capped, with time at or above 95 C going from 12% of the run to 0% and peak power from 93.2 W to 74.0 W. A native run costs about 9% more wall-clock time.
- Can I trust the nvidia-smi temperature on a GB10?
- Not on this box. It read 8 to 15 degrees below the ACPI thermal zone I was watching: when nvidia-smi showed 75-84 C, that zone was already at 92-98 C. Treat the range as my observation rather than a GB10-wide rule, and identify which zone you are reading. I had planned to watch nvidia-smi, and it would have shown me the eighties and left me concluding the machine was not hot.
- Does capping the clock cost much?
- Not much, and it depends on the shape of the workload. Within one session a native MiniMax-H3 run at 1344x768 goes from 226 s to 246.6 s, which is 9%. The two-stage draft-and-refine pipeline goes from 66.1 s to 70.4 s, which is 6%. Native holds full load for 200 unbroken seconds with every second pressed against the clock ceiling; the two-stage pipeline breaks for VAE decode, a handoff and a re-encode, so less of it is capped.
Read next
- 2026-09-14[Video] MiniMax H3 Super Acceleration on a DGX Spark: 2x native cold, 3.14x warm
Drafting with MiniMax-H3 and refining with LTX-2.5 takes 118.8 s on a DGX Spark against 237.7 s native, and 73.3 s warm. Full ComfyUI setup, and the version set it needs.
- 2026-08-07[Benchmark] Running MiniMax-H3 on a DGX Spark — and why NVIDIA VSR is off the table for now
Fifteen seconds of 1080p video with audio in 741s on a GB10 DGX Spark. Swapping Real-ESRGAN for SPAN saved 282s, and nvidia-vfx ships x86_64 wheels only — nothing for ARM.
- 2026-04-02[DGX Spark] Overheating, 100W Power Cap, 30W Safety Mode — Complete Diagnostic Guide
DGX Spark power and thermal issues blew up after Carmack's criticism. This guide covers three distinct symptoms: 30W PD controller defect (needs RMA), 100W thermal throttling, and 5W driver bug (fixable). One command, 30 seconds to diagnose.
- 2026-09-06[Benchmark] Qwen3.8-Flash-Next NVFP4 on a DGX Spark: 41.7 tok/s, RAM for Traffic, Disk for the Dictionary
NVIDIA's NVFP4 checkpoint at 41.7 tok/s on one DGX Spark via nine bind-mounted vLLM files, plus six figures on why the 47.68 GiB n-gram table lives on NVMe.
Don't miss the next one
Subscribe, and you won't.
One-click unsubscribe anytime.