DGX Spark · part 8
[Benchmark] vLLM vs Ollama on the Same Model: Why 30% Faster on GB10
❯ cat --toc
- The short version: vLLM vs Ollama
- Same model, same GPU — so why does one win?
- The Numbers
- Why the 30% Gap
- Kernel differences
- CUDA graphs and torch.compile
- Weight format alignment
- The Silent Gotcha: Ollama's CPU/GPU Split
- When to Use Which
- Takeaways
- The real time sink
- What carries over to other setups
- The broader lesson
- Quick Reference
TL;DR
vLLM serves Gemma 4 26B-A4B at 52 tok/s on GB10 while Ollama tops at 40 tok/s with the same model — a 30% gap from Marlin kernels, CUDA graphs, and torch.compile fusion. Ollama has a silent CPU/GPU split trap that can drop speed to 16 tok/s (60% slower).
The short version: vLLM vs Ollama
vLLM and Ollama are two popular tools for running AI models on your own hardware. Ollama is simple — one command to download and run a model. vLLM is more complex to set up but designed for production serving with higher throughput.
The question most people ask is: "Does the extra complexity of vLLM actually make it faster?" On an NVIDIA DGX Spark with the same Gemma 4 model, vLLM was 30% faster (52 vs 40 tok/s). The gap comes from GPU-level optimizations — CUDA graphs, compiled kernels, and smarter memory management.
I tested both runtimes head-to-head on identical hardware to measure the real-world difference. The 30% gap is consistent, but Ollama has a hidden trap that can make it 60% slower if you don't catch it.
Same model, same GPU — so why does one win?
Same base model, same GPU, same memory bus — just different quantizations and runtimes. One is 30% faster. The interesting question isn't which one — it's why, and whether the gap matters for your use case.
This is a companion to Part 7: Gemma 4 NVFP4 at 52 tok/s. During that deployment, both runtimes were tested on the same hardware. The numbers were different enough to warrant their own article.
The Numbers
Both runtimes ran Gemma 4 26B-A4B on a clean GPU — no other processes, Ollama models fully unloaded before each test.
| vLLM NVFP4 | Ollama Q4_K_M | |
|---|---|---|
| Decode speed | 52 tok/s | 40 tok/s |
| Stability | ±0.1 tok/s | ±2 tok/s |
| Model size | 16.5 GB | 17 GB |
| Quantization | NVFP4 (W4A16 via Marlin) | Q4_K_M (GGUF) |
| Concurrent requests | Yes, built-in (OpenAI API) | Needs OLLAMA_NUM_PARALLEL |
| Tool calling | Yes | Yes (API) |
| Vision | Yes | Yes |
| Setup complexity | Docker + patch file | ollama pull |
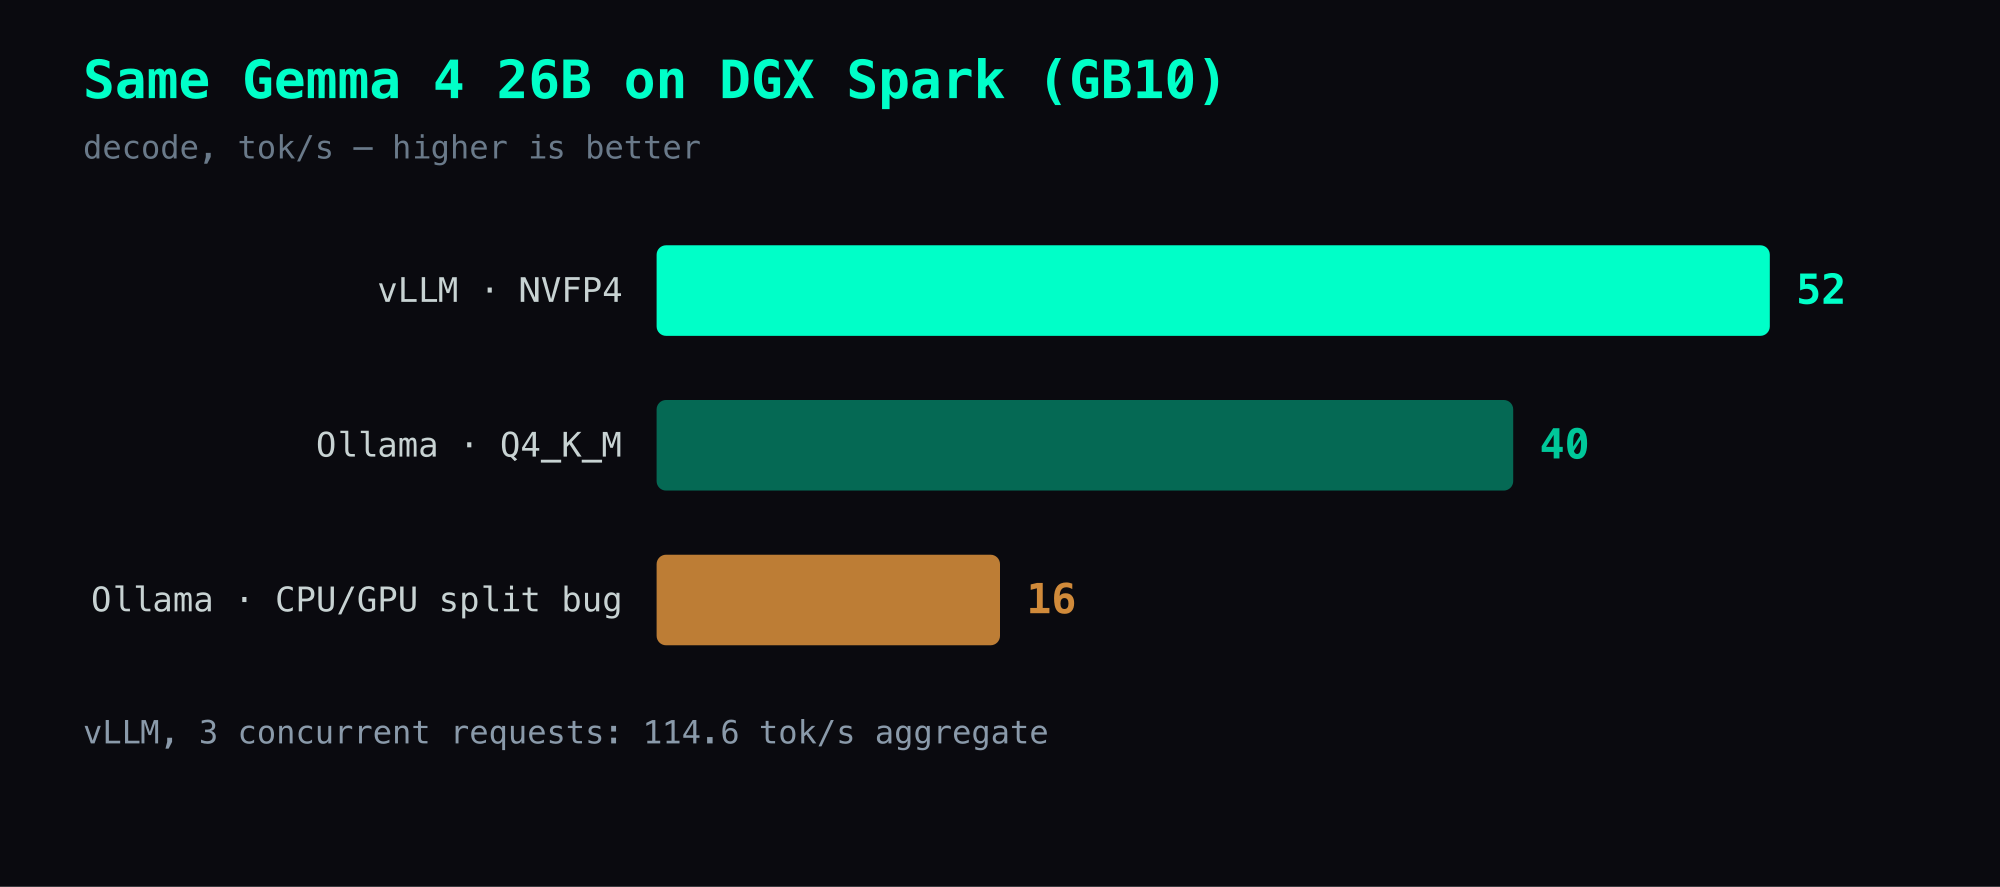
Aggregate throughput under load tells a starker story. Three concurrent vLLM requests produce 114.6 tok/s combined. Ollama serializes requests by default — you can raise OLLAMA_NUM_PARALLEL, but the out-of-the-box behavior is to queue, where vLLM batches.
Why the 30% Gap
Kernel differences
vLLM on SM121 uses two backends for NVFP4:
- FLASHINFER_CUTLASS for dense linear layers — optimized FP4 GEMM with fused activation quantization
- Marlin for MoE layers — decompresses FP4 to BF16 but with highly optimized memory access patterns
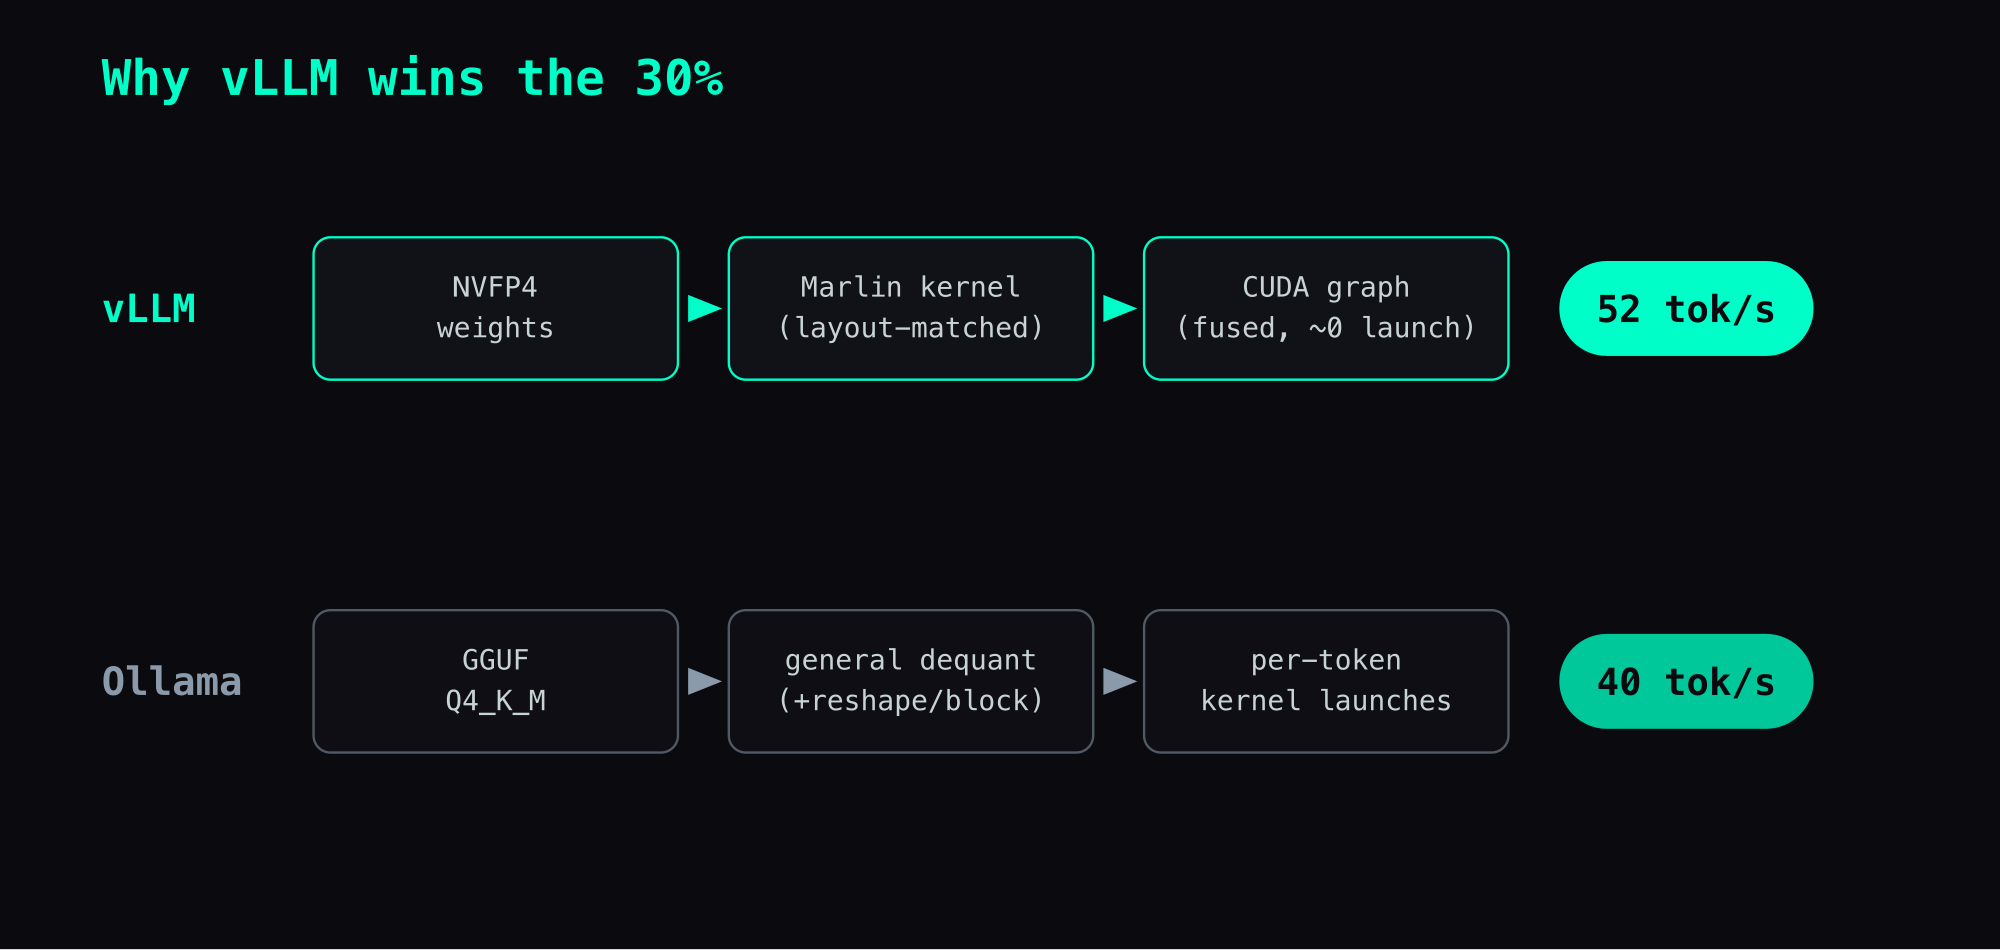
Ollama uses llama.cpp's GGUF runtime with Q4_K_M dequantization. The dequant path is general-purpose — it handles every GGUF format through the same pipeline. Marlin's kernels are format-specific and can exploit the weight layout directly.
CUDA graphs and torch.compile
vLLM captures the entire forward pass into CUDA graphs after warmup. Kernel launch overhead drops to near zero for the common decode path. The startup log shows:
Profiling CUDA graph memory: PIECEWISE=51, FULL=35
torch.compile took 36.01 s in total
That captured graph is part of vLLM's edge here. On GB10 the GPU is fast but the ARM host makes per-kernel-launch overhead proportionally larger, so collapsing the decode path into a single graph pays off — and Ollama's GGUF path didn't close that gap in my runs.
Weight format alignment
NVFP4 weights are stored in [N, K/2] uint8 with [N, K/16] fp8_e4m3 scales — close to what Marlin wants. Marlin repacks them into its working layout once at load, then runs them directly with no per-token conversion.
Q4_K_M stores weights in a block format optimized for CPU portability. The GPU dequantization path works but involves an extra reshape step per block.
The Silent Gotcha: Ollama's CPU/GPU Split
This one wasted more time than the benchmark itself.
The first Ollama run after stopping a vLLM container came back at 16 tok/s, not the ~40 I expected — same model, free GPU. So what happened?
$ ollama ps
NAME          SIZE     PROCESSOR          UNTIL
gemma4:26b    20 GB    66%/34% CPU/GPU    2 hours from now
66% CPU, 34% GPU. Ollama decided the GPU didn't have enough room and silently offloaded two-thirds of the model to system memory. On GB10's unified memory architecture, CPU inference is dramatically slower — the bandwidth is shared but the compute path is ARM CPU cores instead of GPU tensor cores.
The fix:
# Unload the model completely
curl -s http://localhost:11434/api/generate \
  -d '{"model":"gemma4:26b","keep_alive":0}'

# Wait 3 seconds for GPU memory to release
sleep 3

# Reload — should now show 100% GPU
ollama run gemma4:26b "test"
ollama ps  # verify: 100% GPU
After reloading, it was back to 40 tok/s. The GPU memory estimator in Ollama checks available memory at load time. If a previous process (even a stopped Docker container) left stale memory metadata, Ollama underestimates and splits.
There is no warning. ollama ps is the only way to check, and most people don't look there when debugging speed issues.
When to Use Which
vLLM when:
- Serving an API (OpenAI-compatible endpoint)
- Multiple clients or concurrent requests
- Tool calling or structured output needed
- Maximum throughput matters
- Running 24/7 (Docker
--restart unless-stopped)
Ollama when:
- Quick model testing (
ollama run model "prompt") - Interactive terminal chat
- Trying multiple models in sequence
- Setup time matters more than throughput
- No Docker environment available
They can coexist on the same machine but can't both use the GPU at full bandwidth at once. In practice, run vLLM as the persistent server and spin up Ollama for ad-hoc testing once vLLM is stopped.
Takeaways
The real time sink
Most of the time went into diagnosing the 16 tok/s Ollama run, not the benchmark itself. The CPU/GPU split is invisible unless you know to check ollama ps — the model loads, responds, and seems fine, just at half speed. My first instinct was to blame concurrent downloads or background processes; both were wrong.
What carries over to other setups
- When an Ollama model runs slower than expected, check
ollama psfor the Processor column before anything else. If it's not100% GPU, unload and reload. - On unified memory architectures (GB10, Apple Silicon), CPU/GPU splits are especially painful because the memory is physically shared — the bandwidth penalty comes purely from the compute path difference.
- Docker containers that are stopped (
Exited) should release GPU memory, but Ollama's memory estimator may not immediately reflect this. A brief sleep between container stop and model load helps.
The broader lesson
The fastest runtime is the one that eliminates the most overhead between the model weights and the compute units. Format-specific kernels (Marlin) beat general-purpose dequant paths (GGUF) for the same reason hand-tuned SQL beats an ORM — the abstraction layer costs something, and at 52 tok/s, that something is 30%.
Quick Reference
# vLLM: 52 tok/s
docker run -d --name gemma4 --gpus all --ipc host --shm-size 64gb \
  -p 8002:8000 \
  -v ~/models/gemma4-26b-a4b-nvfp4:/models/gemma4 \
  -v ~/models/gemma4-26b-a4b-nvfp4/gemma4_patched.py:/usr/local/lib/python3.12/dist-packages/vllm/model_executor/models/gemma4.py \
  vllm/vllm-openai:gemma4-cu130 \
  --model /models/gemma4 --served-model-name gemma-4-26b \
  --quantization modelopt --kv-cache-dtype fp8 --max-model-len 131072 \
  --gpu-memory-utilization 0.85 --moe-backend marlin \
  --reasoning-parser gemma4 --enable-auto-tool-choice --tool-call-parser pythonic

# Ollama: 40 tok/s
ollama run gemma4:26b "your prompt here" --verbose
Also in this series: Part 7: Gemma 4 NVFP4 at 52 tok/s · Part 1: Ollama Benchmark — 8 Models · Part 2: vLLM + Qwen3.5 Setup
FAQ
- Why is vLLM faster than Ollama on the same model on DGX Spark?
- Three factors: (1) vLLM uses Marlin NVFP4 kernels with CUDA graph capture, reducing kernel launch overhead; (2) vLLM's torch.compile fuses operations that Ollama's llama.cpp backend runs sequentially; (3) NVFP4 weight format is natively aligned with GPU tensor core layout, while GGUF Q4_K_M requires runtime dequantization through a different path.
- Why does Ollama sometimes run at half speed on DGX Spark?
- Ollama silently splits models between CPU and GPU when it detects insufficient GPU memory. After a vLLM container releases GPU memory, Ollama may still see stale memory estimates and load only 34% to GPU. Check with 'ollama ps' — if it shows anything less than '100% GPU', unload the model with keep_alive:0 and reload.
- Should I use vLLM or Ollama on DGX Spark for production?
- vLLM for production serving (52 tok/s, OpenAI-compatible API, concurrent requests, tool calling). Ollama for quick testing and interactive chat (40 tok/s, simpler setup, no Docker required). They can coexist but not simultaneously — GPU memory bandwidth is shared.
Read next
- 2026-05-06Liftoff: Gemma 4 hits 670 tok/s aggregate on DGX Spark (108 tok/s single-stream)
Google announced Multi-Token Prediction drafters for Gemma 4 on 2026-05-05. The vLLM PR was opened and approved the same day; a preview Docker image shipped hours later. I tested it on DGX Spark: Gemma 4 26B-A4B-it FP8 + MTP γ=4 hits 108.78 tok/s single-stream (2.66× baseline), 674.28 tok/s aggregate at concurrency=8. One undocumented trap: the drafter pairs with -it, not base.
- 2026-04-13[Benchmark] Gemma 4 on DGX Spark — Which Model Should You Pick?
Gemma 4 E2B / E4B / 26B MoE / 31B Dense benchmarked on DGX Spark, RTX 5090, and MacBook Pro. One table with speed, memory, quantization format. Selection guide included.
- 2026-04-05Gemma 4 26B-A4B on DGX Spark: 52 tok/s with NVFP4, skip the 31B
Gemma 4 26B-A4B + NVFP4 hits 52 tok/s on DGX Spark (GB10) — 7.5× faster than the 31B dense, in 16.5 GB with 82 GB free for KV cache. Plus the vLLM 0.19 marlin/patch gotchas that make it work.
- 2026-06-04[Benchmark] Gemma 4 12B Omni on DGX Spark: Weight-Only NVFP4 Beats W4A4 (and Keeps Multimodal)
I quantized Google's new omni Gemma 4 12B on a DGX Spark GB10. Weight-only NVFP4 hits 24.9 tok/s in 7.7 GB and keeps image/audio/video working — full W4A4 is slower AND breaks multimodal.
Don't miss the next one
Subscribe, and you won't.
One-click unsubscribe anytime.