AI Workflow · part 19
[AI Agent] From 41 Minutes to 73 Seconds: Why My Coding Agent's Small Tickets Were So Slow
❯ cat --toc
- Is Codex slow, or are my tickets bad?
- Wall-clock time is roughly tool calls times 14.3 seconds
- Command execution was under 38% of the total time
- Where the 41 minutes actually went
- What separated the 9-minute ticket from the 41-minute one
- The config had drifted: cheapest model, priciest thinking setting
- The four fixes that cut the ticket to 73 seconds
- Three rules that outlast this one ticket
- Deep dive
- Why I didn't read 3,086 tool calls by hand
- The hypothesis I walked in with was wrong
- The near-miss during the 73-second re-run
- Three things that only showed up in the aggregate
TL;DR
A stuck coding-agent ticket took 41 minutes. The same type of ticket now takes 73 seconds. Dissecting 41 Codex sessions (734 minutes, 3,086 tool calls) turned up a formula: wall-clock time is roughly tool calls times 14.3 seconds, about 9 of which is pure model thinking. Command execution was under 38% of total time, so the machine wasn't the bottleneck. The fix was embedding prior results in tickets instead of referencing them, skipping startup lookups for tiny tickets, and re-measuring instead of trusting a "done" report. Caveat: across two weeks, only one delay was genuinely Codex's fault, a single 97-minute API stall.

You ask a coworker to grab you a coffee from the café downstairs, and he's gone for forty minutes. That's usually not because the café is far. It's because you never said which café, and company policy made him re-read the employee handbook before he was allowed to leave the building.
That's roughly what was happening to my AI coding agent tickets.
In my setup, Claude Code acts as the commander: it talks to me, makes the judgment calls, cuts tickets, and decides whether a result is good enough to accept. The actual engineering work — the file edits, config changes, benchmark re-runs — gets dispatched to OpenAI Codex CLI running headless in the background. Each job runs off a ticket, a single self-contained file with four sections: goal, steps, machine-checkable acceptance, and red lines (what not to touch). I wrote about the ticket format itself in an earlier article. A watchdog, a small script that checks whether the background job's log is still producing fresh output, catches the case where a hung process looks identical to a busy one.
The logic is supposed to be simple: judgment is expensive, execution is cheap, so the expensive model (Claude Code) spends its budget on deciding what a result means, and a cheaper executor grinds through the mechanical work.
It stopped feeling simple when tiny, change-one-flag tickets started taking 40+ minutes. Not the hard tickets, the small ones, where the entire job was "flip this number, re-measure, report back." I couldn't tell if the executor was actually slow or if I was just writing bad tickets, and the two explanations point at completely different fixes: one says pay for a smarter executor, the other says fix your own writing.
Is Codex slow, or are my tickets bad?
I couldn't answer that from inside a single session. One ticket taking 41 minutes tells you nothing about whether 41 minutes is normal. So I pulled two weeks of Codex sessions and looked at all of them at once: 41 sessions, 734 minutes of wall-clock time, 3,086 tool calls, reconstructed from the rollout-*.jsonl session records plus my own ticket logs.
I didn't read 3,086 tool calls by hand. That's not a job for the commander. I handed the sweep to a read-only scout subagent to chew through the raw records, then judged the aggregates it handed back myself. That division of labor turned out to matter later, past the point where the numbers alone answer the question.
Wall-clock time is roughly tool calls times 14.3 seconds
The aggregates converged on a rule of thumb: wall-clock time is roughly the number of tool calls times 14.3 seconds. About 9 of those seconds, on every single call, is pure model thinking — the executor deciding what to do next, not running anything.
I checked it against a ticket outside the sample: 54 tool calls predicted 12.9 minutes. The actual run took 13.0 minutes.
That reframes the whole question. If most of the 14.3 seconds per call is thinking rather than doing, the lever isn't "make the machine faster." It's "make the executor need fewer calls."
Command execution was under 38% of the total time
Across the two weeks, actual command execution accounted for less than 38% of total time, and that number is an overestimate, since it includes time spent polling while a long job finishes. Zero ssh timeouts anywhere in the sample.
The machine wasn't slow. Whatever was eating the other 62%-plus was happening before or around the commands, not inside them.
Where the 41 minutes actually went
One ticket shows exactly where the time went: a probe I'd codenamed hina-nmax7-probe. Forty-one minutes, start to finish. Here's the breakdown:
- 19.6 minutes: idle gap between my launching the ticket and anything actually starting. Nothing was running at all.
- 8.6 minutes across 9 tool calls: the executor re-digging through the previous ticket's logs, because that ticket's results weren't embedded in this one, only referenced.
- 13 minutes: the actual investigative work the ticket was for.
- Of that 13 minutes, only 4.4 minutes was real machine work: commands running, output being produced.
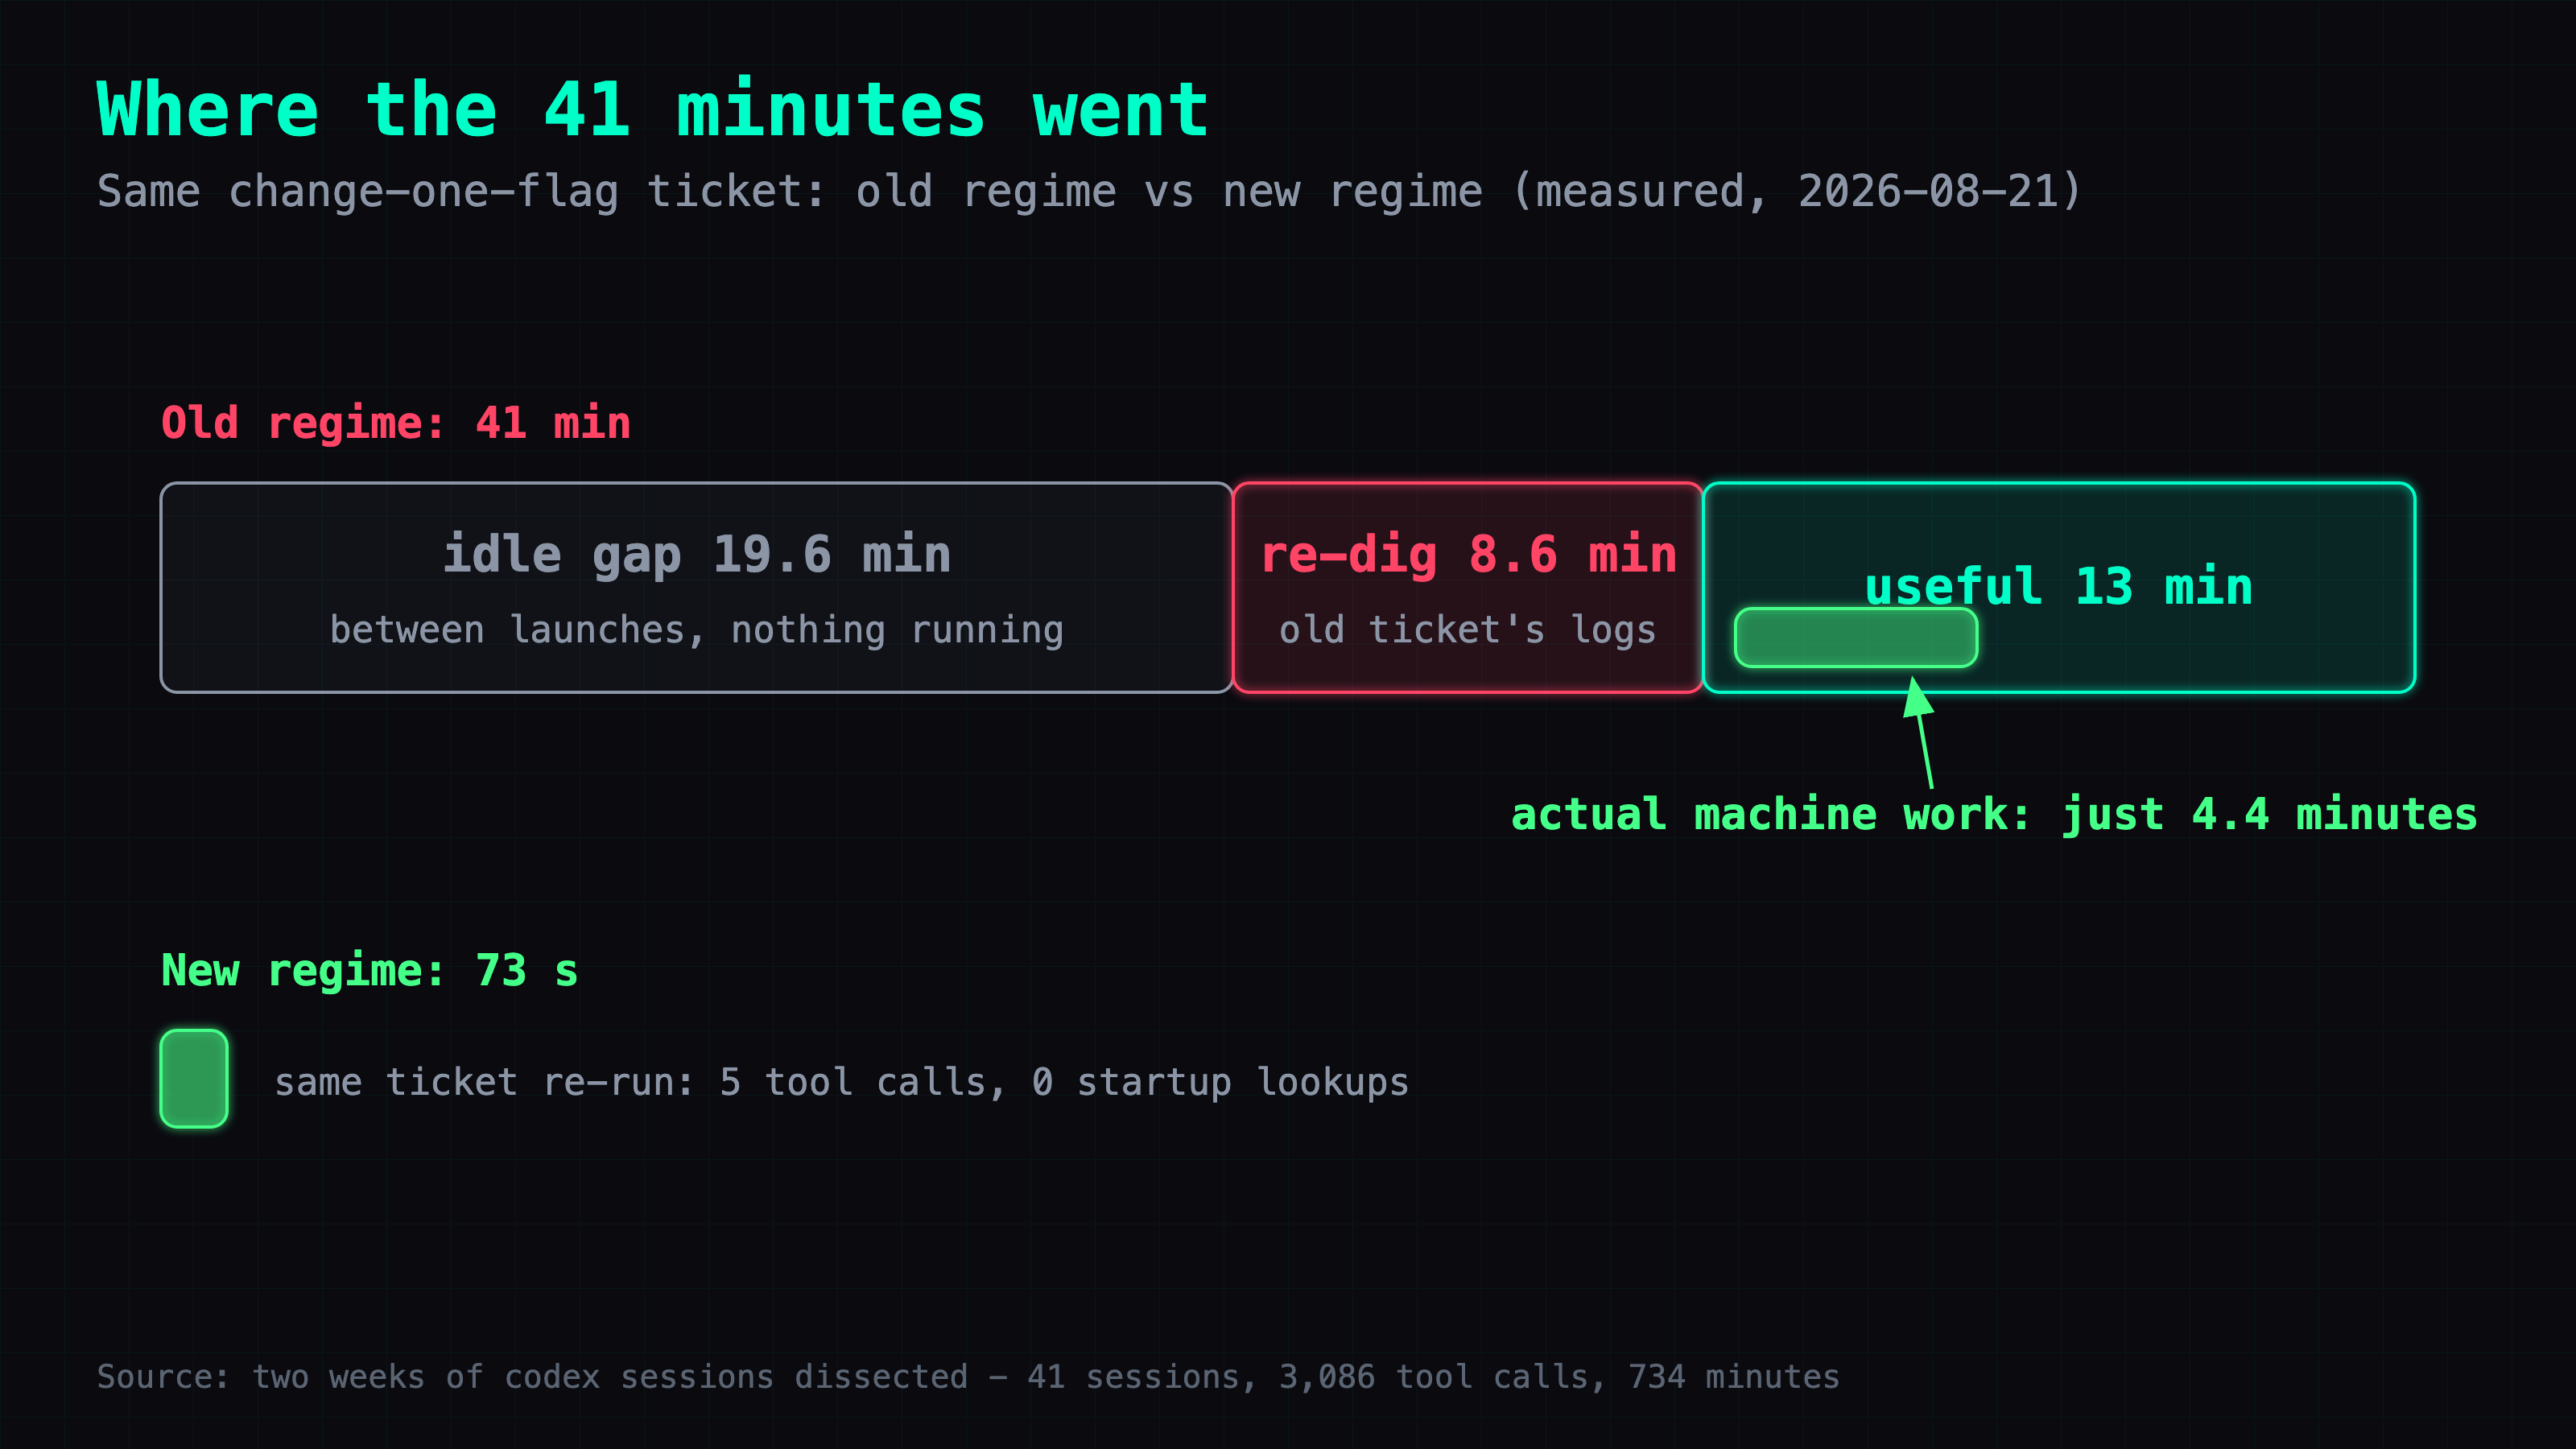
4.4 minutes out of 41. About a tenth of the ticket was the thing the ticket was supposedly for.
What separated the 9-minute ticket from the 41-minute one
I went back and compared a ticket that ran fast, 9 minutes, 35 tool calls, against one that ran slow. The difference wasn't complexity. It was what got written into the ticket text.
The fast ticket pasted the actual flags, the actual reference numbers, and the actual boundary permissions directly into the file. Something close to this:
# Goal
Confirm whether raising the speculative-decode draft width improves decode
throughput without regressing acceptance rate.

# Steps
1. Change --spec-draft-n-max from 4 to 5 in the serve config.
2. Restart the inference server.
3. Run the standard decode-speed probe.

# Acceptance (machine-checkable)
- Decode tok/s >= reference value 47.5, or a logged reason it's lower.
- Server starts clean (no crash in the first 60 seconds).

# Red lines
- Touch only --spec-draft-n-max. Don't change any other serve flag.
- If decode tok/s regresses below 47.5, roll back to 4 and report. Don't
  keep tuning other knobs to compensate.
The slow ticket, instead of a number like 47.5, said something closer to "the evidence already exists" and pointed back at an earlier run. That sentence is an instruction to go dig. Digging means more tool calls, and every tool call is taxed at roughly 14.3 seconds whether it's productive or not.
Referencing a number is not the same as providing it. The executor can't see what you saw. If the number isn't in the file, it doesn't exist yet.
The config had drifted: cheapest model, priciest thinking setting
While dissecting the sessions, I found something unrelated to any of this: the executor model was configured as gpt-5.6-luna with reasoning effort set to max. That pairs the cheapest model in the lineup with the most expensive thinking setting, the opposite of what you'd want. The ops doc said the default should be gpt-5.6-sol. Nobody had checked whether the running config still matched the doc.
The four fixes that cut the ticket to 73 seconds
I applied four changes:
- Executor model back to
gpt-5.6-sol.lunawasn't just the cheaper pick — it had been feeling noticeably dumber in practice. - Reasoning effort down from
maxtomedium. - "If you reference it, include it" became a hard rule in the ticket template: paste the actual numbers and prior results into every new ticket, never point back at where they used to live.
- Micro-tickets can now skip the mandatory startup knowledge-base lookup by carrying an explicit exemption phrase.
I re-ran a ticket of the same type. 73 seconds. 5 tool calls. Zero startup lookups. Executor model confirmed as gpt-5.6-sol in the session record. 16,130 tokens. No new tooling, no bigger machine, no smarter model than the one already on the shelf. Just a differently written ticket and a config file that matched its own documentation.
| Before | After | |
|---|---|---|
| Wall-clock | 41 min | 73 s |
| Tool calls | 54 (9 spent on log archaeology) | 5 |
| Startup KB lookups | every launch | 0 |
| Executor model | gpt-5.6-luna, effort max | gpt-5.6-sol |
| Tokens | n/a | 16,130 |
Three rules that outlast this one ticket
- Embed the data in the ticket. The executor can't read your mind, and it can't see the terminal you were looking at an hour ago.
- Never make the agent do log archaeology. If a ticket forces the executor to go find something you already know, that's a bug in the ticket, not a task for the executor to work around.
- "Done" from the executor isn't done. Re-run the acceptance checks yourself and measure it. A report is a claim, not a result.
Deep dive
Skipping the rest of this article costs you nothing. The rules above are the whole point. What follows is how I got there, including the places I almost got it wrong.
Why I didn't read 3,086 tool calls by hand
My first instinct was to read the records myself. That doesn't survive contact with the volume: 3,086 calls, and the deeper you wade in, the less attention you have left for the only question that matters, which is what the numbers mean. So the sweep went to a read-only scout subagent that chewed the raw records into aggregates, and I judged the aggregates. The formula came out of those, and it held on a ticket the scout hadn't touched: 54 calls predicted 12.9 minutes against a measured 13.0.
The hypothesis I walked in with was wrong
I expected the story to be "Codex is slow." Across the full two weeks, exactly one delay was genuinely on Codex's side: a single 97-minute generation stall on the API side, an isolated incident, not a pattern. Every other minute of the 734 traced back to how tickets were written and launched, not to the model doing the work. If I hadn't checked that split before acting on the hunch, the fix would have been "move to a pricier executor model," which costs real money every ticket after that and leaves the actual problem, badly written tickets, untouched. The expensive fix would have made the dashboard look better and the underlying habit worse, since a smarter model would have kept quietly absorbing the cost of tickets that never should have needed 41 minutes in the first place.
The near-miss during the 73-second re-run
The re-run's internal probe reported 26.2 tok/s decode speed against a reference of 47.5. For a moment that looked like a regression from the reasoning-effort change. It wasn't. The two numbers came from different measurement windows: a cold run on a short prompt versus a reference measured on a 64K-deep-context harness. Those two numbers just aren't comparable. I'd written "don't compare numbers from different measurement windows" into my own notes the day before this happened, and nearly broke it within 24 hours of writing it down.
Three things that only showed up in the aggregate
- The environment called
nomcp(short for no-MCP, meant to run headless with zero MCP tools loaded) doesn't actually block MCP tools. Suspected cause: a plugin path that bypasses the block. Unconfirmed. - Watchdog verdicts, whether a hung job got flagged as dead, aren't persisted to disk anywhere.
- The launch log gets clobbered by a plain
>redirect on relaunch, erasing the previous run's trail before anyone can read it.
All three follow the same pattern: the config says X, the system does Y. None of them would show up from watching one session at a time. They only surface when you dissect a batch instead of trusting whichever run happens to be in front of you, and none of them were what I went looking for. The formula and the four fixes were the answer to the question I asked; these three were the answer to questions I hadn't thought to ask yet.
FAQ
- What's the formula for predicting how long an AI coding agent ticket will take?
- Wall-clock time is roughly the number of tool calls times 14.3 seconds, and about 9 seconds of each call is pure model thinking rather than command execution. Validated on a 54-call ticket outside the sample: the formula predicted 12.9 minutes, the actual run took 13.0 minutes.
- Why do simple, one-flag-change tickets take 40+ minutes with an AI coding agent?
- Usually not because the machine is slow. Command execution was under 38% of total time across a two-week sample. The time goes into idle gaps before launch and into the executor re-digging through old logs because a prior ticket's results weren't embedded in the new one, just referenced.
- Should an AI agent ticket reference prior results, or embed them directly?
- Embed them. A ticket that says 'the evidence already exists' sends the executor off to go find it, and every bit of digging costs more tool calls at roughly 14.3 seconds each. Pasting the actual numbers, flags, and permissions directly into the ticket text turned a 41-minute ticket into a 73-second one.
- Why isn't a 'done' report from an AI coding agent the same as the task being done?
- A report describes what the executor believes happened, not a verified outcome. Re-running the ticket's own acceptance checks is the only way to know for sure. In this investigation, a near-miss almost got misread as a real regression because two numbers came from different measurement windows instead of being compared like for like.
Read next
- 2026-07-17[Dev Workflow] Your AI Agent's Skills Are a Context Budget: Cutting 193 to 7
One of my AI agents was auto-loading 193 skills into a 2% context budget, silently truncating every description. The fix was visibility governance, not deletion — an allowlist, thin-shell skills, and three layers that stop it re-bloating.
- 2026-07-16[Dev Workflow] The Two Axes That Let a Fleet of AIs Collaborate Without Re-Explaining
Six posts in, my AI setup is really two axes of one system: durable knowledge and live task state, both in plain files. Here's how they converge so different AIs hand off work without re-explaining it or losing it.
- 2026-07-12[Dev Workflow] Delegating to an AI Coding Agent: The Unit of Work Is a Ticket File, Not a Conversation
How I hand engineering tasks to Codex: self-contained ticket files with machine-checkable acceptance, background execution, three flags I paid for in dead time, and a report-is-not-a-result gate.
- 2026-07-11[Dev Workflow] When Your Quota Runs Out Mid-Task: A Live-State Handoff Protocol for Claude Code and Codex
When an AI coding CLI runs out of quota mid-task, what dies isn't your knowledge base — it's the live state trapped in the session. A file-based handoff protocol lets Claude Code and Codex resume each other's half-finished work.
Don't miss the next one
Subscribe, and you won't.
One-click unsubscribe anytime.