AI Workflow · part 25
[Dev Workflow] I Had an AI Reverse-Engineer My Own iOS App With Free Tools (REA + Ghidra)
❯ cat --toc
- Can an AI read an app without the source?
- What REA does: lets an AI drive Ghidra
- How I made it a blind test
- Results: 2 right, 1 half right, in 16 minutes
- The AI's formula vs my two lines of Swift
- Why it worked: unstripped symbols make it easy mode
- Try it yourself: REA and Ghidra on your own app
- What to install
- The two env vars that save you an hour
- Build your app as a simulator binary
- Deep dive: three rounds, two sandboxes, and what I found while grading
- Versions and timing
- Round 1: the AI answered "unknown" to all three
- Why Ghidra hangs on Swift demangling
- Why the sandboxed runs hit provider_timeout
- Round 3: tool isolation instead of an OS sandbox
- Two things I noticed while grading
- What I didn't test
TL;DR
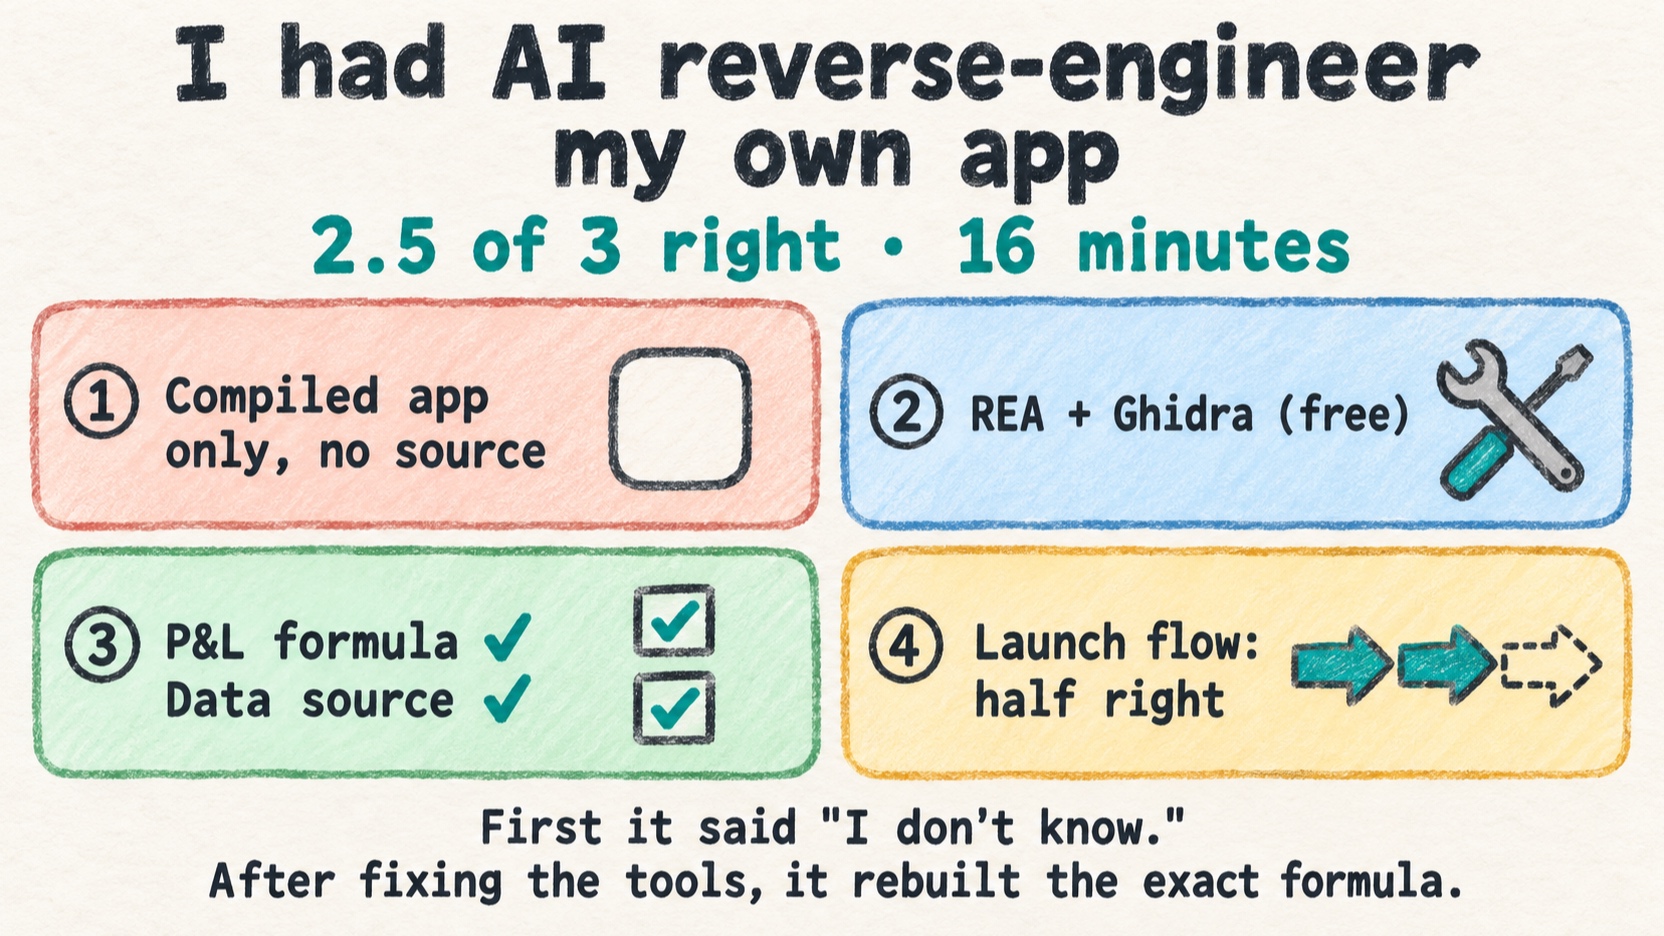
I gave REA, an open-source reverse-engineering agent, only the compiled binary of my own iOS options app. No source code. I asked three questions I already knew the answers to. In 16 minutes it got two right and one half right, and it rebuilt my max loss and breakeven formulas exactly as they are in my Swift source. How: REA drives Ghidra headless, and the AI reads decompiled functions and cites addresses as evidence. Caveat: my binary still had its symbols, which is easy mode.
Can an AI read an app without the source?
REA passed 60K GitHub stars on October 10. The pitch is simple: hand an AI agent a compiled binary, and it works out what the program does.
I wanted to know if that holds up. The problem with testing it on someone else's app is that you can't grade the answers. So I used my own: BPSTracker, an iOS app I wrote to track bull put spreads (an options strategy where you sell one put and buy a cheaper one below it for protection). I have the source, so I have the answer key.
The short version, the one I told a friend: the AI looked only at the machine code and wrote down my P&L formula exactly as I wrote it.
What REA does: lets an AI drive Ghidra
REA is a toolkit that turns a disassembler into tools an AI agent can call. It uses Ghidra, the NSA's open-source reverse-engineering suite, as the analysis backend and runs it headless. The agent talks to it over MCP (the Model Context Protocol, a standard way to give a model tools).
In practice the agent can open a binary, get an overview, list and search functions, read Ghidra's decompiled pseudocode, and save evidence pinned to addresses. That last part matters. Every claim it makes comes with an address you can go check.
How I made it a blind test
You don't need any of this to try REA yourself. I did it because I wanted to be sure the AI couldn't peek at my source, so the grades mean something.
I ran the agent as a fresh Codex CLI session (codex exec, reasoning set to high) with my config, rules and memory ignored, in a folder that contained only the arm64 binary:
codex exec --ignore-user-config --ignore-rules --ephemeral \
  -C <folder-with-only-the-binary> --json "<three questions>"
The only tool it had was REA's MCP server. Shell, web, apps, memory, hooks, sub-agents, browser and computer use were all off. A small guard sat in front of REA and allowed 14 tools, checked on both tools/list and tools/call. open_binary could open only that one file. Every REA tool that can read arbitrary files was blocked.
Then I asked three questions:
- How does the app compute max loss and breakeven for a position?
- Where does the app's data come from?
- What does the app do at launch, and in what order?
Results: 2 right, 1 half right, in 16 minutes
The run that worked took 16.19 minutes. The first binary_overview call alone, which is where Ghidra does its initial analysis, took 3.14 minutes of that.
| Question | Grade | What it got |
|---|---|---|
| Max loss and breakeven formula | Right | exact match with my source |
| Where the data comes from | Right | correct |
| Launch sequence | Half right | the setup chain, but missed the positions tab's work |
Question 3 is the interesting miss. It found the async Core Data load, the store gate, the chain of products, then entitlements, then a 1.2 s sleep, then a 0.4 s splash animation. It also said, correctly, that these async tasks have no guaranteed order. What it missed is part of what the positions tab does once it appears: update its filter, fetch prices for open positions, then start the background refresh. It found the price fetch but missed the filter update and the background refresh.
The AI's formula vs my two lines of Swift
This is what it wrote down, from machine code only:
width     = shortStrike - longStrike
max loss  = (width - credit) × contracts × 100
breakeven = shortStrike - credit
And this is my source, Utils/PositionMetrics.swift:
// line 25
(width - position.creditValue) * Decimal(position.contractsValue) * 100
// line 31
position.shortStrikeValue - position.creditValue
It cited its evidence: the detail view closure at 0x1000eac84, the calculatedMaxLoss function at 0x1000281c4, and the constant 0x64, which is 100, the shares-per-contract multiplier.
It was also careful about what it didn't know. It said it found no fee term in these formulas, but that it "can't claim the whole app ignores fees." These two functions don't touch fees. That says nothing about the rest of the app.
Why it worked: unstripped symbols make it easy mode
I want to be clear about how much of this came from the symbols. With 8,293 of my own Swift symbols in the binary, the AI could search for names like maxLoss and breakeven and land on the right function. Most of the hard part of reverse engineering is finding where to look, and the symbols did that for it.
So what I can claim is narrow: one app, three questions, one successful run, on a binary with its symbols. I didn't test stripped or obfuscated binaries.
I also checked the AI's citations. It quoted 54 snippets of REA output. 52 were verbatim. The other two were formatting slips: one dropped an underscore (__infix instead of ___infix) and corrected itself in the next sentence, and one joined a line break.
Try it yourself: REA and Ghidra on your own app
Here's how to run the same test on your own app. The tools are free, and the blind run took 16 minutes.
What to install
These are the versions I ran:
| Piece | Version I used | Note |
|---|---|---|
| REA | 6.4.0 (npm rea-agents) | needs Node 22.19+, 24.11+ or 26+ |
| Ghidra | 12.1.4 PUBLIC | official ZIP, SHA-256 checked |
| JDK | OpenJDK 21.0.10 | Ghidra needs it |
| Node | 24.21.0 | Node 25 is not supported |
| Xcode | 27.0 | to build the app and for swift-demangle |
One trap: my system Node was 25.2.1, which REA doesn't support. I didn't touch it. I installed Node 24.21.0 from the official tarball next to it and used that for REA.
Then two commands:
npx rea-agents setup
npx rea-agents doctor
The install took me 29.7 minutes in total.
The two env vars that save you an hour
Most of the config is what you'd expect. Tell REA where Ghidra and Java live, and pick Ghidra as the provider:
export GHIDRA_INSTALL_DIR=<where-you-unzipped-ghidra>
export JAVA_HOME=/opt/homebrew/opt/openjdk@21/libexec/openjdk.jdk/Contents/Home
export REA_ANALYSIS_PROVIDER=ghidra
export GHIDRA_HEADLESS_MAXMEM=4G
The two that cost me time are these:
export GHIDRA_SWIFT_DEMANGLER=/Applications/Xcode.app/Contents/Developer/Toolchains/XcodeDefault.xctoolchain/usr/bin/swift-demangle
export REA_GHIDRA_STARTUP_TIMEOUT_MS=600000
The demangler. Swift mangles its symbol names into long encoded strings, and Ghidra has to decode each one it hasn't seen yet. If you don't set this, Ghidra falls back to /usr/bin/swift, which was about 11.6x slower in my timing than Xcode's swift-demangle. Without it, my first analysis sat in Swift demangling for several minutes before I killed it. With it, the first analysis finished in 237 seconds.
The startup timeout. After open_binary, the first query that needs Ghidra triggers the import and a full analysis before REA can answer. On a Swift app this size that takes minutes, so I set the timeout to 10 minutes.
Build your app as a simulator binary
You don't need to sign anything. I built a Release build for the iOS Simulator with signing turned off, then pulled out the arm64 slice:
xcodebuild -configuration Release -sdk iphonesimulator \
  -destination "generic/platform=iOS Simulator" \
  CODE_SIGNING_ALLOWED=NO CODE_SIGNING_REQUIRED=NO

lipo -thin arm64 <path-to-binary> -output <binary>-arm64
The build took 1.5 minutes.
One thing to check: my binary was not stripped. It had 18,553 arm64 symbols, 8,293 of them Swift symbols from my own code. My project has STRIP_INSTALLED_PRODUCT=YES, but DEPLOYMENT_POSTPROCESSING=NO and COPY_PHASE_STRIP=NO, so most symbols survived. Your Release builds may look the same. Check before you assume they're stripped.
Deep dive: three rounds, two sandboxes, and what I found while grading
Nothing here is needed to run the steps above. It's the full record: versions, timings, the two failed rounds, and the parameters that made round 3 work.
Versions and timing
| Item | Value |
|---|---|
| REA | 6.4.0 (npm rea-agents) |
| Ghidra | 12.1.4 PUBLIC, official ZIP, SHA-256 verified (release) |
| JDK | OpenJDK 21.0.10 |
| Node | 24.21.0 official tarball (system Node 25.2.1 left alone, unsupported) |
| Xcode | 27.0 |
| Blind agent | Codex CLI 0.162.1, codex exec, reasoning high |
| Step | Time |
|---|---|
| Install REA, Ghidra, JDK, Node | 29.7 min |
| App build (overlapped with install) | 1.5 min |
| First analysis, demangler fixed, outside sandbox | 237.3 s |
| First analysis, demangler not set | several minutes, stopped manually |
| Round 3 blind run | 16.19 min |
First binary_overview inside round 3 | 3.14 min |
close_binary in round 3 | 796.6 s to 809.3 s |
Round 1: the AI answered "unknown" to all three
Round 1 ran the agent inside macOS Seatbelt (sandbox-exec) as an extra layer of isolation. The machine was busy: load average around 18, with two Remotion renders going. Java sat at 1 to 3% CPU.
The run produced these errors:
provider_timeout operation: list_documents timeout_ms: 600000
A retry then failed with:
execution_failure: Ghidra client is already started
And closing the binary gave cleanup_incomplete with spawn EPERM.
The AI answered "unknown" to all three questions. It refused to fill in the textbook finance formula for a bull put spread, and said a tool failure doesn't mean the binary lacks these features. A failed run that says "I don't know" is far easier to work with than one that guesses, so I count that as a good sign.
Why Ghidra hangs on Swift demangling
Ghidra's README gives the demangler fallback order as /usr/bin/swift-demangle, then /usr/bin/swift. With nothing set, my Mac ended up on the slow route, /usr/bin/swift demangle.
I timed 20 calls each way:
| Demangler | 20 calls |
|---|---|
/usr/bin/swift demangle | 0.9227 s |
Xcode swift-demangle | 0.0795 s |
That's about 11.6x per call, and Ghidra makes thousands of these calls on a Swift app. Setting GHIDRA_SWIFT_DEMANGLER to Xcode's binary is the fix.
Why the sandboxed runs hit provider_timeout
Round 2 fixed the demangler and raised the timeouts (startup briefly went to 1,500,000 ms), then ran inside Seatbelt again. It still hit provider_timeout and spawn EPERM. One run went 37.24 minutes and stopped with no answer.
spawn EPERM has a clear cause. REA's cleanup spawns a child process to inspect the process table, and the sandbox denies that.
I can't pin provider_timeout entirely on the sandbox. The machine was under heavy load in both rounds. In round 3, outside Seatbelt, one sample showed Java at 19.6% CPU around 151 s in, against 1 to 3% in round 1. That's a single sample under different load, so it doesn't show what the sandbox did to Ghidra.
Round 3: tool isolation instead of an OS sandbox
For round 3 I dropped Seatbelt and relied on the tool-level isolation described above: only REA's MCP server, the 14-tool allowlist, open_binary fixed to one file, and arbitrary-file tools refused. The refused tools were inspect_plist, inspect_keyed_archive, inspect_binary_layout, import_evidence_bundle and compare_source_to_bundle.
To be precise: tool isolation is not an OS sandbox. It limits what the agent can ask REA to do. It doesn't stop REA or Ghidra themselves from touching the filesystem. And REA's output went to a cloud model, so the run was not fully offline.
Round 3 parameters:
| Setting | Value |
|---|---|
REA_GHIDRA_STARTUP_TIMEOUT_MS | 600000 |
MCP tool_timeout_sec | 660 |
Ghidra -analysisTimeoutPerFile | 1200 (added by editing REA's Ghidra launcher, not stock) |
| Self-abort | 28 min |
| Independent kill | 29 min (not triggered) |
It finished in 16.19 minutes and saved 102 pieces of evidence. One analyze_function reply was too large for the MCP transport, so the AI read the saved view of that function instead and kept going.
Two things I noticed while grading
First, Ghidra's pseudocode showed _fetchPricesForOpenPositions(true,param_2), but my source passes forceRefresh: false. Decompiler output doesn't always show the correct argument values. The AI drew no conclusion from that line, which is lucky, because it would have been wrong.
Second, the timings overlap. The 29.7-minute install and the 1.5-minute build ran at the same time, so the cost, not counting the two failed rounds, was about half an hour of setup plus 16 minutes of analysis.
What I didn't test
- Stripped or obfuscated binaries
- Running the app (all analysis was static)
- Other disassemblers such as Hopper or IDA
- More than one app, or more than one successful run
FAQ
- What is REA?
- REA is an open-source reverse-engineering agent toolkit. It runs Ghidra headless as its analysis backend and exposes the results as MCP tools, so an AI agent can open a binary, list functions, read decompiled code and save evidence with addresses. You install it with npx rea-agents setup and check it with npx rea-agents doctor.
- Can an AI figure out what an iOS app does without the source code?
- In my test, mostly yes. Given only the arm64 binary of my own app, it answered two of three questions correctly and one half right in 16 minutes, including an exact reconstruction of my max loss and breakeven formulas. The binary still had its symbols, which makes the job much easier.
- Which Node.js version does REA need?
- REA 6.4.0 needs Node 22.19+, 24.11+ or 26+. Node 25 is not supported. I installed Node 24.21.0 from the official tarball next to my system Node 25 instead of replacing it.
- Why does Ghidra get stuck on Swift demangling?
- If you don't point Ghidra at a demangler, it falls back to /usr/bin/swift-demangle and then /usr/bin/swift. On macOS the /usr/bin/swift route was about 11.6x slower in my measurement, and my first analysis sat in Swift demangling for several minutes before I stopped it. Setting GHIDRA_SWIFT_DEMANGLER to Xcode's swift-demangle fixed it, and the first analysis finished in 237 seconds.
- Does REA work offline?
- The analysis runs locally in Ghidra, but the agent that reads REA's output is a model. In my setup that was a cloud model, so the decompiled code left the machine. Treat it as not fully offline.
- Does this work on stripped or obfuscated binaries?
- I didn't test that. My binary had 18,553 arm64 symbols, so the AI could search for names like maxLoss and breakeven. A stripped or obfuscated binary would be much harder, and I have no numbers for it.
- How long does the setup take?
- Installing REA, Ghidra, JDK 21 and a supported Node took me 29.7 minutes. Building the app took 1.5 minutes and overlapped with the install. The blind analysis run itself took 16.19 minutes.
Read next
- 2026-02-26[Claude Code] Testing iOS Apps with Claude Code: 81% Context Reduction
How I replaced screenshot-heavy iOS test runs with ui_describe_all-first testing in Claude Code, cutting context usage by 81% for BPS Tracker. Plus Fastlane integration for App Store automation.
- 2026-04-13Claude Code Burning Through Tokens? 8 Fixes to Make Sessions Last 10x Longer
You just started using Claude Code and the context window keeps filling up. Here's where the tokens actually go, what you can do about it, and how to make Claude remember things without re-reading everything.
- 2026-10-07Testing EmbeddingGemma 2 on Our Knowledge Base: Recall@5 from 50% to 58.3%
I tested EmbeddingGemma 2 against v1 on my AI's note search on an M1 Max: recall@5 went from 50% to 58.3%, code search improved, and memory rose to 2.75 GiB.
- 2026-10-04[Claude Code] Build a Resource Dashboard Inside Claude Code With Six Prompts
Claude Code mods let a plugin draw a live pane in your session. Six prompts, each run in a fresh session, build a GPU, disk, quota and local-model dashboard.
Don't miss the next one
Subscribe, and you won't.
One-click unsubscribe anytime.