MiniMax-H3 on RTX 5090 · part 5
[Benchmark] From OOM to 8.6 minutes: a MiniMax-H3 config stack for one RTX 5090
❯ cat --toc
- Preface
- The stack that renders 15 seconds of 768p in 518 s
- Two KJNodes patches turn a 47.11 GiB request into a run that finishes
- Chunk 16/8 is 2.9x faster than 2/2, which is the opposite of the published rule
- torch 2.13.0+cu130 cut 32.4% off a 15-second clip: cu128 never registers the FP4 kernel
- SageAttention and Sol-Attn are worth 2% and 3% here, and Sol's first run is slower than not using it
- The TensorRT VAE is worth 1.7%, not the 9.9% someone else measured
- Three of the six levers are free, and they are the three that matter
- Advanced: the spill zone that makes runs 11x slower
TL;DR
One RTX 5090, MiniMax-H3 at native 1344x768, 362 frames = 15.08 s. With nothing attached the sampler asks for 47.11 GiB and OOMs. Two KJNodes nodes plus chunk 16/8 plus torch 2.13.0+cu130 render it in 518.0 s, and the 124-frame production chain goes from about 240 s to 134.2 s. The chunk retune is worth 1.40x and the CUDA line 1.48x, both exact: on cu128 ComfyUI never registers scaled_mm_nvfp4, so the FP4 matmul falls back to eager. Attention kernels and the TensorRT VAE add under 8% together. Image quality was eyeballed, not blind-tested.
Preface
Getting a couch through a doorway is not a strength problem. Either it fits or it does not, and if it does not, shoving harder only scratches the frame — you take the legs off and it goes through. How fast you then carry it up the stairs is a completely separate question, and nobody confuses the two.
Config stacks for video models blur that line constantly. Part 1 got MiniMax-H3 running on a single RTX 5090, Part 2 halved the output time with 14 steps, SageAttention and RTX VSR, Part 3 locked a character with reference images, and Part 4 went through the ten effect embeddings.
This post is the accounting. My graph currently has six optimizations on it. One of them is why a native 768p 15-second clip completes at all; two more are worth 40% and 48% and are mathematically exact; the last three are worth 2 to 3% each and every one changes the numerics. Here is what each one buys.
The stack that renders 15 seconds of 768p in 518 s
Every number in this article comes from the same machine and the same fixed conditions. The row that matters most is the last one — 362 frames is H3's per-clip ceiling, and everything expensive follows from generating that many at native resolution.
| Fixed for every measurement | Value |
|---|---|
| Sampler | res_multistep + simple, 14 steps, shift 12/3, Spectrum ON |
| Weights | DiT minimax_h3_fl2va_pruned_nvfp4.safetensors, TE qwen3vl_32b_heretic_minimax_h3_nvfp4.safetensors |
| Host | Windows 11 native, ComfyUI 0.34.0, Python 3.13.7 |
| Clip length | 1344x768, 362 frames = 15.08 s (124 frames = 5.17 s) |
The full environment, verbatim:
ComfyUI 0.34.0 · Python 3.13.7 · torch 2.13.0+cu130
sageattention 2.2.0+cu130torch2.10.0andhigher.post6
comfy-kitchen 0.2.31 · triton-windows 3.7.1.post27 · nvidia-vfx 0.1.0.1
launch: main.py --listen 0.0.0.0 --port 8188 --enable-manager --use-sage-attention
DiT minimax_h3_fl2va_pruned_nvfp4.safetensors
TE  qwen3vl_32b_heretic_minimax_h3_nvfp4.safetensors
VAE minimax_h3_video_vae_fp16 + minimax_h3_audio_vae_fp32
sampler res_multistep + simple · 14 steps · shift 12/3
And what that stack does to a 15-second clip, one change at a time:
| Config | 362 frames at 1344x768 |
|---|---|
| Nothing attached | OOM — sampler requested 47.11 GiB |
| KJNodes two nodes, chunk 8/4 | ~1056 s |
| Chunk retuned to 16/8 | 755.6 s |
| Plus torch cu128 to cu130 | 518.0 s = 8.6 min |
The shorter production chain moves the same way. 124 frames plus the upscale to 3840x2176 took roughly 240 s on cu128 and 134.2 s on cu130.
Two KJNodes patches turn a 47.11 GiB request into a run that finishes
Without these patches there is no benchmark to take: the run OOMs. The sampler asks for 47.11 GiB in a single allocation and a 32 GB card says no.
Both nodes come from ComfyUI-KJNodes, and both are mathematically exact — I read the source rather than trusting the README, because "low VRAM" is a phrase that usually means an approximation.
MiniMaxLowVRAMAttention splits attention into head groups. Heads are independent, so computing them a group at a time is exact, not an approximation of the full attention. It also frees the normed hidden state right after the qkv GEMM, and frees the fused qkv buffer before out_proj allocates its output.
MiniMaxChunkFeedForward chunks the SwiGLU feed-forward along the packed token dimension. Activations are per-token quantized, so chunking along tokens produces the same output as one pass.
The wiring order matters. Put both patches after Spectrum so they are applied last:
UNETLoader → SpectrumApplyMiniMaxH3 → MiniMaxLowVRAMAttention → MiniMaxChunkFeedForward → BasicScheduler/BasicGuider
Chunk 16/8 is 2.9x faster than 2/2, which is the opposite of the published rule
The node tooltip says more chunks lower the peak at slightly more overhead, which reads as an argument for the smallest value that still fits. I swept it because that is cheap to check.
Same seed, same prompt, only head_chunks and ffn_chunks changed, 1344x768 at 362 frames:
| head_chunks / ffn_chunks | Time |
|---|---|
| 2 / 2 | 2208.1 s |
| 8 / 4 | ~1056 s |
| 16 / 8 | 755.6 s |
| 32 / 16 | 761.3 s |
More chunks are faster here: 16/8 beats 2/2 by 2.9x. The curve then flattens: 32/16 differs from 16/8 by 0.8%, which is noise.
The reason is that "fits" is not a binary. There is a band where the run exceeds VRAM and still does not OOM — Windows spills the CUDA allocation into system memory and the job pages over PCIe for the rest of its life. Coarse chunks make each per-call transient large enough to land in that band. Fine chunks keep every transient small enough to stay resident, and paying for more kernel launches is far cheaper than paying for PCIe. The band itself is the subject of the advanced section below.
torch 2.13.0+cu130 cut 32.4% off a 15-second clip: cu128 never registers the FP4 kernel
This is the largest single lever in the stack, and it is a package upgrade rather than a graph change.
| Frames | torch 2.11.0+cu128 | torch 2.13.0+cu130 | Delta |
|---|---|---|---|
| 124 (n=3) | 181.8 s | 99.6 s | −45.2% |
| 362 (n=1) | 766.1 s | 518.0 s | −32.4% |
The 362-frame row is a single run per arm, but the control is reproducible: that 766.1 s matches the 755.6 s measured earlier in the chunk sweep, 1.4% apart.
The mechanism is two gates in series, and both of them are version checks rather than performance heuristics. First, ComfyUI's comfy/quant_ops.py disables the comfy-kitchen cuda backend outright when torch reports a CUDA major version below 13:
cuda_version = tuple(map(int, str(torch.version.cuda).split('.')))
if cuda_version < (13,):
    ck.registry.disable("cuda")
Second, even when it is enabled, comfy-kitchen's cuda backend only registers scaled_mm_nvfp4 if it can resolve cuBLASLt 13 at runtime.
Querying the registry directly settles it. On cu128: cuda disabled is True, 44 capabilities, scaled_mm_nvfp4 absent. On cu130: disabled is False, 46 capabilities, scaled_mm_nvfp4 present. So on cu128 the NVFP4 matmul can only go through the eager path; on cu130 it routes to kitchen's cuBLAS FP4 GEMM. The weights were NVFP4 the whole time — the kernel that makes them worth something was not.
Faster is only interesting if the same work was done, so I checked the Spectrum accounting in both arms' ComfyUI logs. Identical: steps=14, offline_replay_calls=14, anchor_steps=11, smoothed_steps=3, bypassed_steps=0, fallbacks=0. No steps skipped, no fallbacks taken.
Three practical conditions come with the upgrade:
- torch 2.13 has no cu128 wheel at all. On Windows the CUDA lines are cu126, cu130 and cu132 (cu129 exists for Linux only), so moving to 2.13 forces the CUDA change. It is one decision, not two.
- SageAttention has to be swapped to the
+cu130build. The same post6 release carries both, so this is a reinstall, not a rebuild. - The package that provides
RTXVideoSuperResolutionis callednvidia-vfxon PyPI.nvvfxis only the import name, and pip will not find it.
SageAttention and Sol-Attn are worth 2% and 3% here, and Sol's first run is slower than not using it
Both of these are real kernel speedups that mostly do not show up end to end on this workload.
SageAttention benchmarks at 4.10x to 4.21x on the single op. End to end on this 5090 it is worth 2% — 52.18 s down to 51.11 s. The same SageAttention build is worth 19% on a modded 2080 Ti. The kernel did not get worse; the rest of the 5090 pipeline simply got faster around it.
Sol-Attn is MiniMaxH3ScheduledSolAttentionPatch, running tau 1.3 to 0.8, dense_percent 0.2, sink_conditioning exact_kv_and_rows, int8_qk true, strict true. Its kernel benchmarks at 1.38x to 1.65x on sequences of 8K to 65K tokens. A 362-frame clip is about 91k tokens, already beyond the published benchmark range.
| Run | Time |
|---|---|
| Baseline, no Sol | 755.6 s |
| Sol, first run | 821.3 s |
| Sol, second run | 733.2 s |
| Sol + head_chunks=1 | 730.2 s |
Sol is worth 3% once it has settled, and the first run is 8.7% slower than not using it at all. That is Triton autotuning, and the cache is keyed per token count, so a new clip length pays the tax again. So measure this node twice and throw the first run away.
The TensorRT VAE is worth 1.7%, not the 9.9% someone else measured
ComfyUI-H3VAE_TRT claims up to 1.7x on the VAE stage. A benchmark someone sent me measured −9.9% end to end. I measured −1.7%. All three numbers are correct.
The stage breakdown explains the spread. I got it by resubmitting the same seed so ComfyUI caches the sampler and only the tail re-executes:
| Stage | Time | Share |
|---|---|---|
| Sampling | ~1009 s | 86% |
| Upscale chain | ~116 s | 10% |
| VAE decode + mux | 47.0 s | 4% |
That run was 928x544, 124 frames, 8 steps with an Acc LoRA. Cheap sampling, so VAE was around 24% of their wall clock. Step count affects sampling, not VAE time. Their run used 8 steps; mine uses 14, for roughly ten times more sampling work. The same four seconds of VAE saving is −9.9% for them and −0.6% for me. Amdahl, applied to somebody else's benchmark.
It is still worth having: engine compile took only 23.6 s, and it is a static 256px tile, so there is no rebuild per resolution or per frame count. One caveat — the encoder profile is fixed at T=17, though the current node pads shorter inputs, including a single frame, up to 17 before inference.
Three of the six levers are free, and they are the three that matter
This is the whole ledger in one table. Read the last column first: it separates the levers that are exact from the ones that trade numerics for speed.
| Lever | Worth | Cost |
|---|---|---|
| KJNodes two nodes | OOM to completing | Exact — head groups and token chunks |
| Chunk 8/4 to 16/8 | 1.40x | Exact — same math, different call sizes |
| torch cu128 to cu130 | 1.48x (362 frames) | Same steps, same sampler, no approximation |
| Sol-Attn | 1.03x | Changes numerics |
| SageAttention | 1.02x | Changes numerics |
| TRT-VAE | 1.02x | Changes numerics |
The first three are exact — no approximation — and they take the 15-second clip from OOM to 518.0 s. The last three together are under 8% and every one of them alters the denoising trajectory. If you only do part of this, do the top three.
Advanced: the spill zone that makes runs 11x slower
Skip this section if you came for the config — nothing below changes how you set the machine up. It is here because the failure mode it describes is invisible in every VRAM readout, and it is what makes the chunk-size result above look backwards.
Same 362 frames, same everything, only the resolution changed:
| Resolution | Pixels | Time |
|---|---|---|
| 960x544 | 0.52 MP | 318 s |
| 1152x640 | 0.74 MP | 3576 s |
| 1344x768 | 1.03 MP | OOM without the KJ nodes, 755.6 s with them |
1.41x the pixels cost 11.2x the time. Attention is quadratic in tokens, so 1.41 squared predicts about 2.0x. The gap is 5.6x, and it has nothing to do with attention complexity.
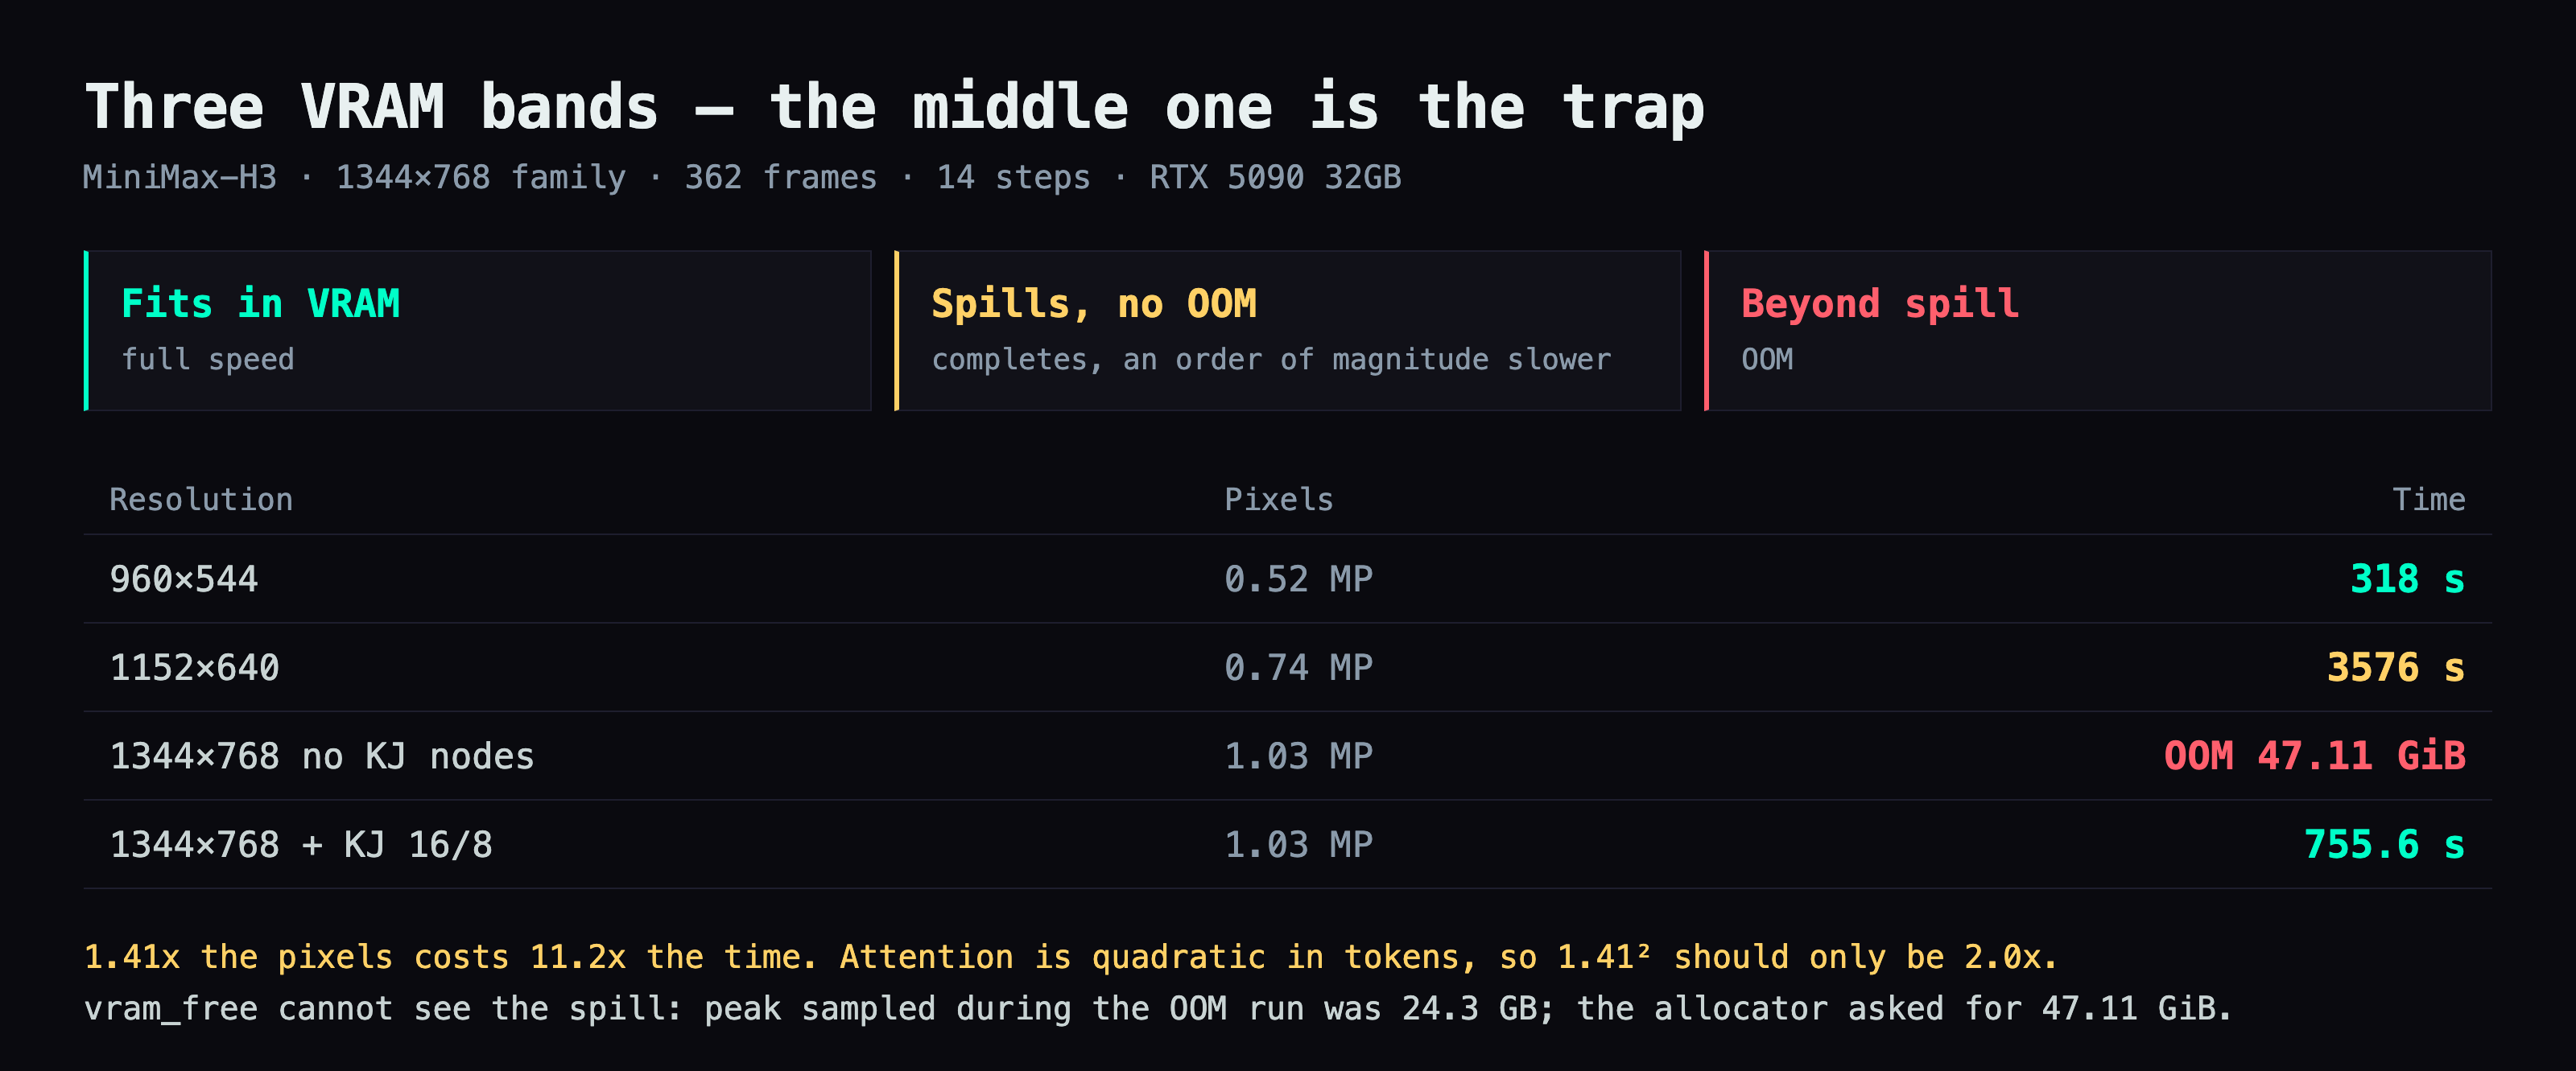
And the row underneath is the one that gives it away: 1344x768 with the KJ nodes attached is 755.6 s. That is 40% more pixels and 3x faster than 1152x640. Pixel count cannot explain an ordering like that. Allocation behaviour can.
There are three bands, not two:
- Fits in VRAM. Full speed.
- Spills but does not OOM. The run completes, an order of magnitude slower, because Windows has moved the allocation into system memory and every access crosses PCIe.
- Beyond that. OOM.
Band 2 is the dangerous one, because from the outside it just looks like a slow run — and a slow run on a bigger resolution is exactly what you expect to see. 1152x640 sits in it. 1344x768 with the KJ nodes does not, because the nodes keep every transient small enough to stay resident. This is the spill behaviour behind the chunk-size results above.
vram_free will not show you any of this. Sampling it every 5 s during the run that OOMed reported a peak of 24.3 GB, on a card with 32 GB, while the allocator was asking for 47.11 GiB. The poller sees steady-state residency; the thing that kills you is a single transient between two samples.
So the detector is not a memory reading. It is the slope: plot time against pixels and look for a point that is implausibly far above quadratic. A jump of 11.2x for only 1.41x more pixels is not model scaling. It is a spill.
FAQ
- Why does MiniMax-H3 run out of memory on a 32 GB RTX 5090?
- At 1344x768 with 362 frames the sampler asks the allocator for 47.11 GiB in one go, which no 32 GB card can serve. The fix is not a smaller resolution but the two KJNodes patches, `MiniMaxLowVRAMAttention` and `MiniMaxChunkFeedForward`, which split attention into head groups and chunk the SwiGLU feed-forward so the peak transient never gets that large.
- Should I use the smallest chunk size that fits in ComfyUI?
- Not on this workload. The node tooltip says more chunks lower the peak at slightly more overhead, which reads as an argument for the smallest value that fits, and measuring the same seed at four settings gave the opposite ordering: head_chunks/ffn of 2/2 took 2208.1 s while 16/8 took 755.6 s, a 2.9x difference. The curve flattens at 16, with 32/16 landing within 0.8% of it.
- Does the CUDA line matter for NVFP4 inference on a 5090?
- It decides whether the FP4 matmul kernel exists at all. ComfyUI disables the comfy-kitchen `cuda` backend when torch reports a CUDA major version below 13, and the backend only registers `scaled_mm_nvfp4` when it can resolve cuBLASLt 13 at runtime. Querying the registry directly: cu128 gives 44 capabilities with no `scaled_mm_nvfp4`, cu130 gives 46 with it present.
- Is the TensorRT VAE worth installing for MiniMax-H3?
- It depends entirely on how expensive your sampling is. The repo claims up to 1.7x for the VAE stage and a benchmark someone sent me measured 9.9% end to end, but that run was 8 steps with an Acc LoRA at 928x544. At 14 steps and 1344x768 the sampler is about 86% of the wall clock and VAE decode plus mux is 4%, so the same saving came out at 1.7%.
Read next
- 2026-08-31[Benchmark] Ten effect embeddings for MiniMax-H3 — 10 MB that buys you bullet time, fire breath and a full year of seasons
Ten community effect embeddings for MiniMax-H3, tested at native 1344x768 on one RTX 5090. What each one actually does, the prompt shape that lets them work, and the placement rule that decides whether they fire at all.
- 2026-08-04[Benchmark] Running MiniMax-H3 on one RTX 5090: four files, 31.7 GB, 175s per talking clip
Beginner walkthrough for MiniMax-H3, the 33B model that generates video and stereo audio in one pass. Full precision is 115 GB; quantized it fits one RTX 5090. What to download, where it goes, how to prompt it.
- 2026-10-18A 25-second no-fog FPV one-take with MiniMax-H3 and ComfyUI-H3-Continuum on one RTX 5090
A 25-second FPV one-take over Taiwan with no fog: MiniMax-H3 Ref2VA and ComfyUI-H3-Continuum on one RTX 5090, each splice hidden in a turn through the sky.
- 2026-10-16A 22-second Taiwan FPV flight without a drone: Blender blockout + MiniMax-H3 on one RTX 5090
A 22.7-second FPV flight that reads as one take, over Yushan, Taroko Gorge, Taipei 101 and Sun Moon Lake, built from a gray Blender blockout and MiniMax-H3 Ref2VA on one RTX 5090.
Don't miss the next one
Subscribe, and you won't.
One-click unsubscribe anytime.