DeepSeek-V4-Flash on DGX Spark · part 4
[Local LLM] My 284B agent quietly stopped reusing its KV cache — the ds4 evict storm that re-paid prefill every turn
❯ cat --toc
- The short version
- The setup
- The symptom: it felt like Part 2 never happened
- Two log lines that named both culprits
- Root cause: tool-call turns never saved a checkpoint
- The fix: 256G KV budget + the PR #489 binary
- Verification: a second tool-call turn now reuses 81% of its prefix
- Decode speed is fixed — prefill is the only lever left
- Takeaways
- Where the time went
- Reusable diagnostics
- The general principle
- Conclusion: the checklist
TL;DR
A month after Part 2 called DeepSeek-V4-Flash "bimodal — smooth on the hot path," the hot path quietly died. Two log lines told the story: kv cache evicted reason=disk-cache-full hits=0 (the 128G disk-KV budget was full, evicting prefixes before they were ever reused) and prompt=14209 common=268 (a 14K-token conversation reused 268 tokens and re-prefilled the rest). Root cause of the second one: tool-call turns never saved a checkpoint — fixed upstream in antirez/ds4 PR #489. The fix: bump the KV disk budget to 256G and switch to the PR #489 binary. After: a second tool-call turn reused 81% of its prefix, and the evict storm went to zero. Decode is still ~13.7 tok/s — that's the GB10 bandwidth wall and no flag moves it. The entire win is in not re-paying prefill.
The short version
Think of an assistant with a great memory that you talk to through one long, shared work log. Ideally you come back, pick up where you left off, and it answers fast — because it remembers what you already covered. That's what Part 2 was about: ds4 writes the "already-computed start of the conversation" to disk, so next time it grabs that opening back instead of re-reading it.
A month in, that changed. Now every time you speak it acts like it's seeing the log for the first time — reading the whole thing from page one before it answers. A 14K-token conversation, and it only recognizes the first couple hundred tokens; the rest gets re-read from scratch. It feels slow again: tens of seconds of dead air before every reply.
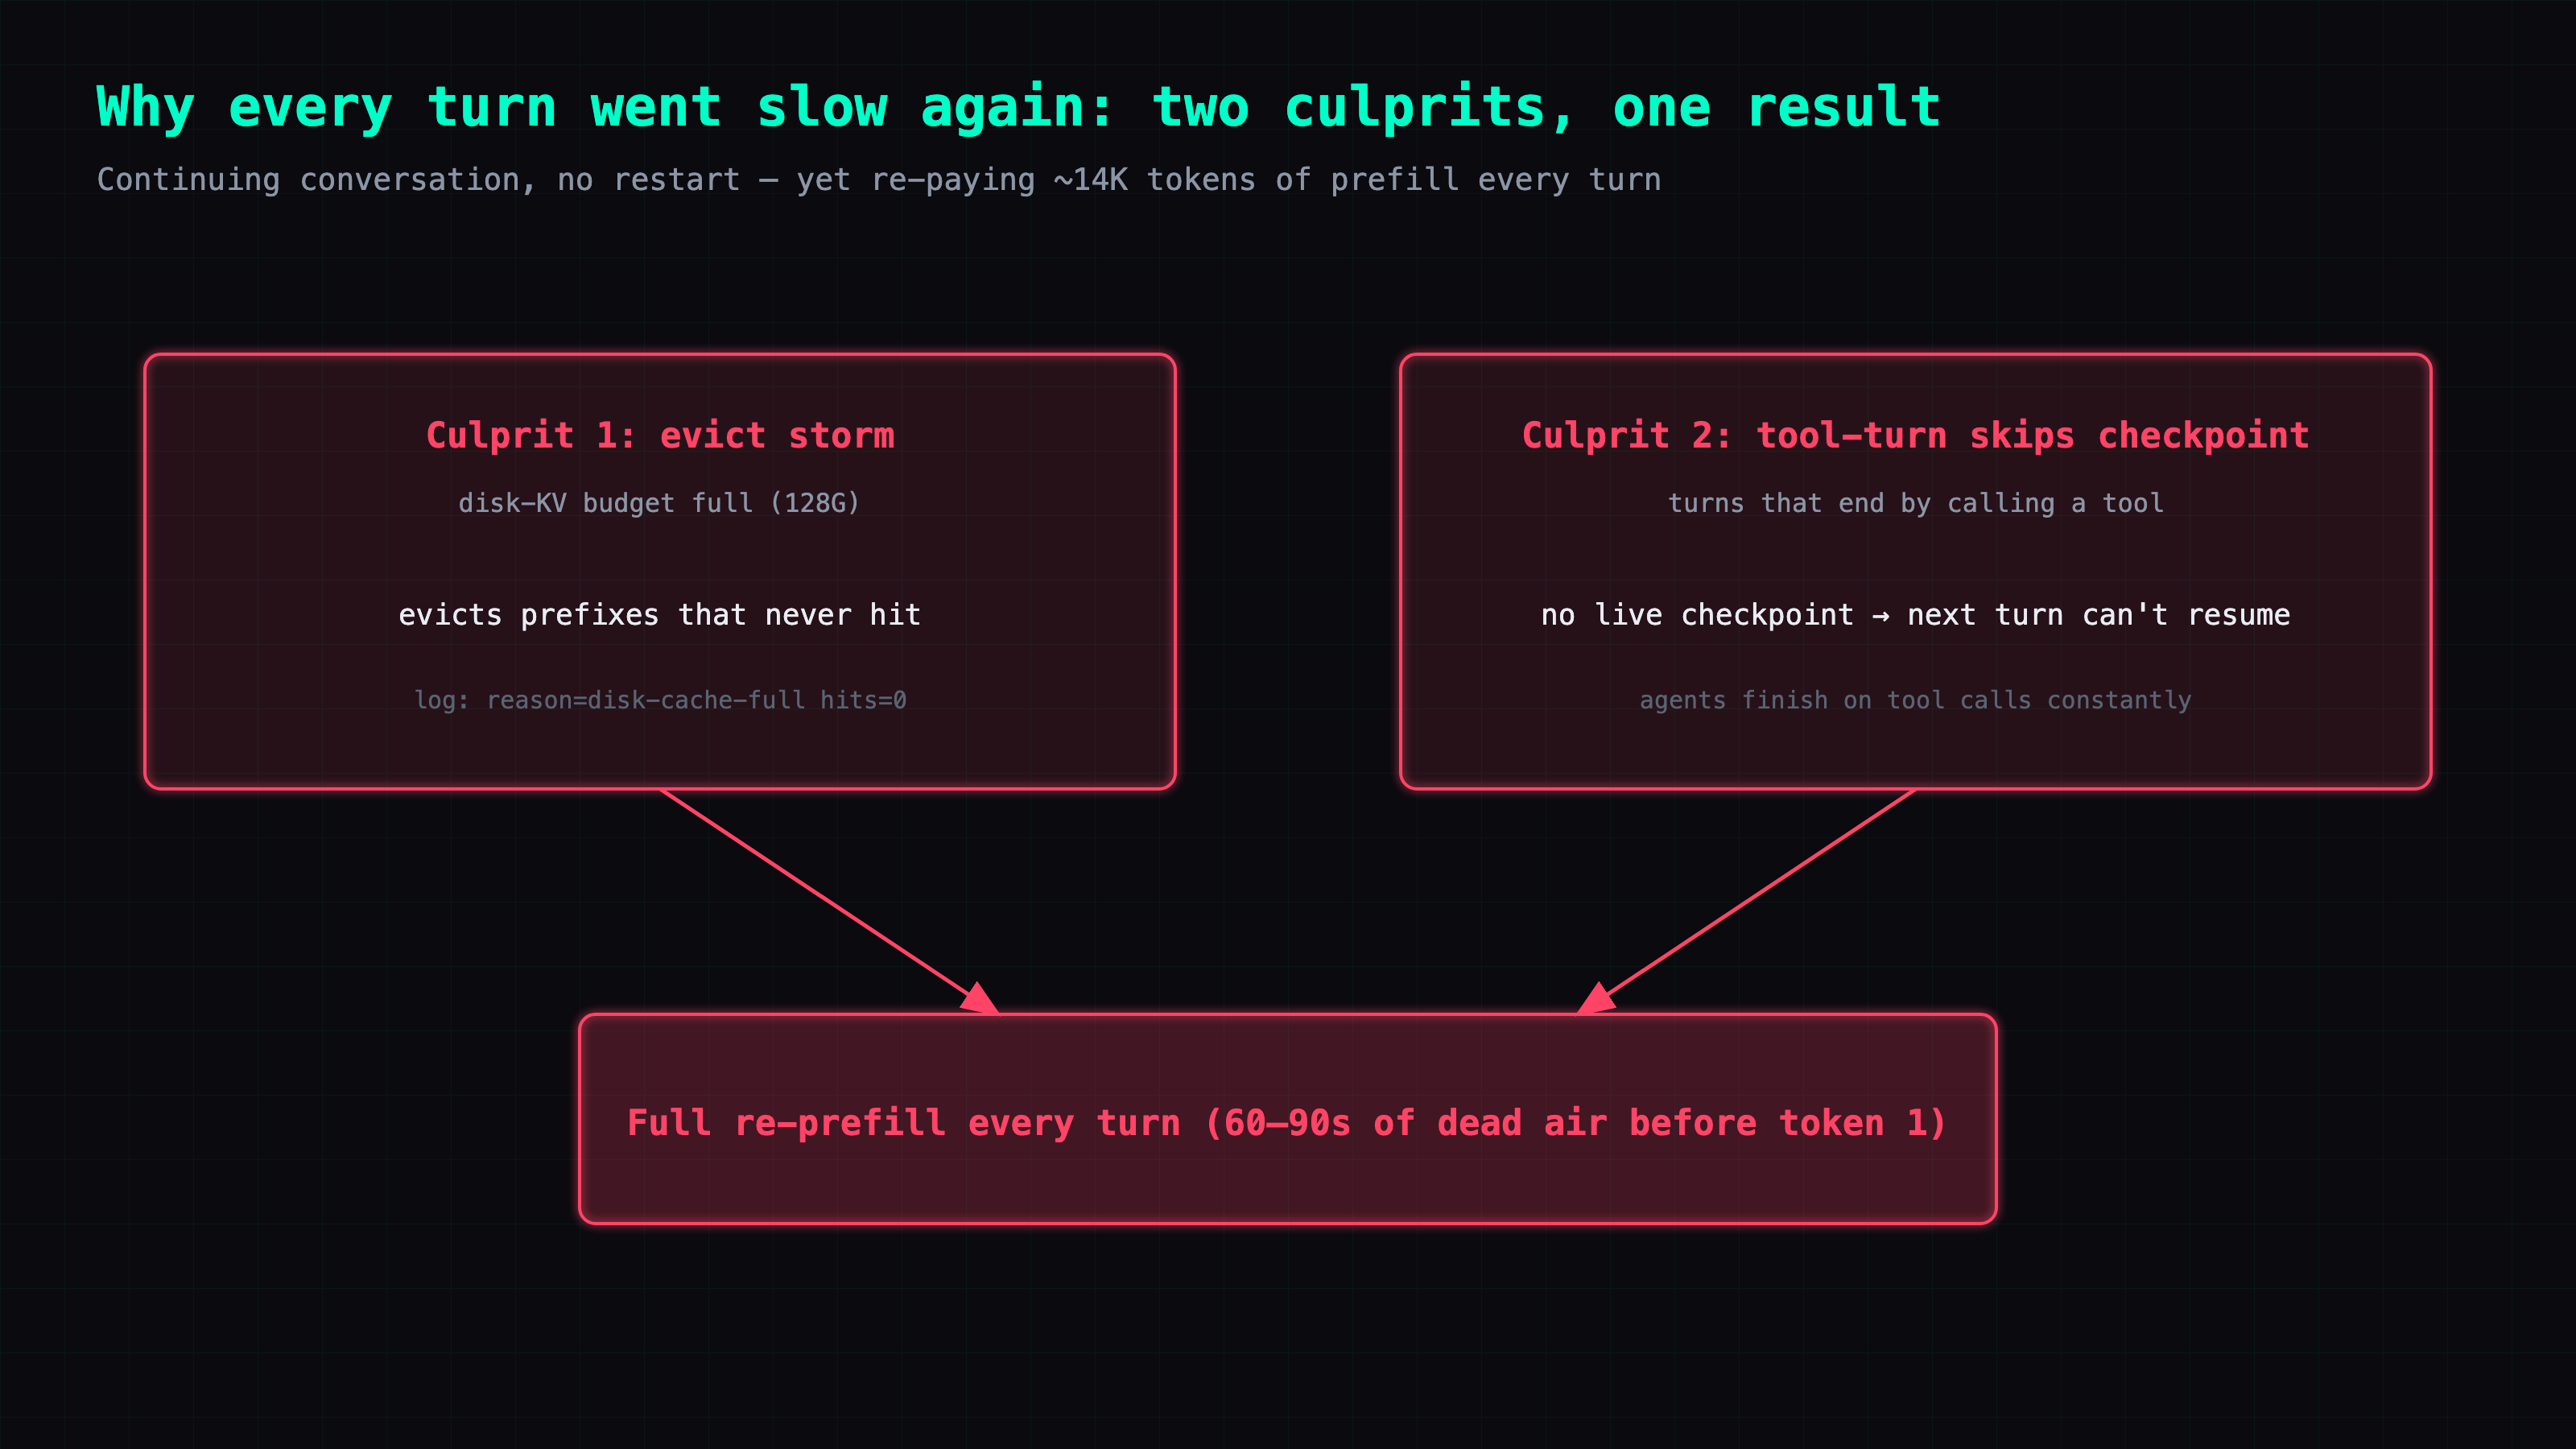
Two culprits. One: the disk that holds the already-computed prefixes filled up, so it started throwing out entries before they were ever reused — a cache that isn't caching. Two, the sneaky one: any turn that ends with a tool call never saved its progress — and an agent calls tools all day, so almost nothing got saved. The fix: bump the disk cache from 128G to 256G, and swap in a build that also checkpoints tool-call turns. After that, the second turn of the same conversation recognizes 80% of the opening and skips the re-read.
As for decode speed itself? That doesn't budge — it's pinned at the hardware bandwidth wall, and no flag touches it. Every second I got back came from not re-reading, nowhere else.
The setup
A model's benchmark number is one prompt on an idle box. Whether it's still pleasant a month later, after real agentic use has bloated every conversation and filled every cache, is a completely different measurement — and it's the one that actually decides whether you keep using the thing.
This is Part 4 of the DeepSeek-V4-Flash on DGX Spark series. Part 1 got the 284B model running on a single 128GB GB10. Part 2 wired it into a daily agent and made a specific promise: the KV disk cache makes it bimodal — the hot path (cache hit) is smooth, only the cold path drags. I measured 48% of a day's replies finishing in 5–15s and called it comfortable.
That measurement was one day old. This post is what a month of heavier use did to that promise: the hot path quietly stopped being hot, the thing I'd praised silently degraded, and it took two log lines to see why.
The symptom: it felt like Part 2 never happened
The tell wasn't a crash. It was the feeling that the disk cache had switched off — every turn back to a cold-start wait, the exact thing Part 2 was supposed to have solved. A continuing conversation, no restart, no new topic, and still tens of seconds of dead air before each reply.
That "should be a cache hit and isn't" gap is the whole post. On a GB10 an 81GB Q2 model re-prefilling ~14K tokens is 60–90 seconds of pure wait before the first token — so a cache that silently stops hitting doesn't degrade gracefully. It falls off a cliff.
Two log lines that named both culprits
I didn't guess. ds4's server log states both failures outright. The first:
kv cache evicted reason=disk-cache-full hits=0
The disk-KV budget was full (I'd set 128G in Part 2), so ds4 was evicting checkpoints to make room — and hits=0 means it was throwing out prefixes that had never once been reused. That's not a cache doing its job; that's a cache thrashing: writing a prefix, then evicting it before the next turn can hit it. Over a month of use the budget had simply filled, and every new write pushed out a still-useful prefix.
The second line is the subtle one:
live kv cache miss ... prompt=14209 common=268 reason=token-mismatch
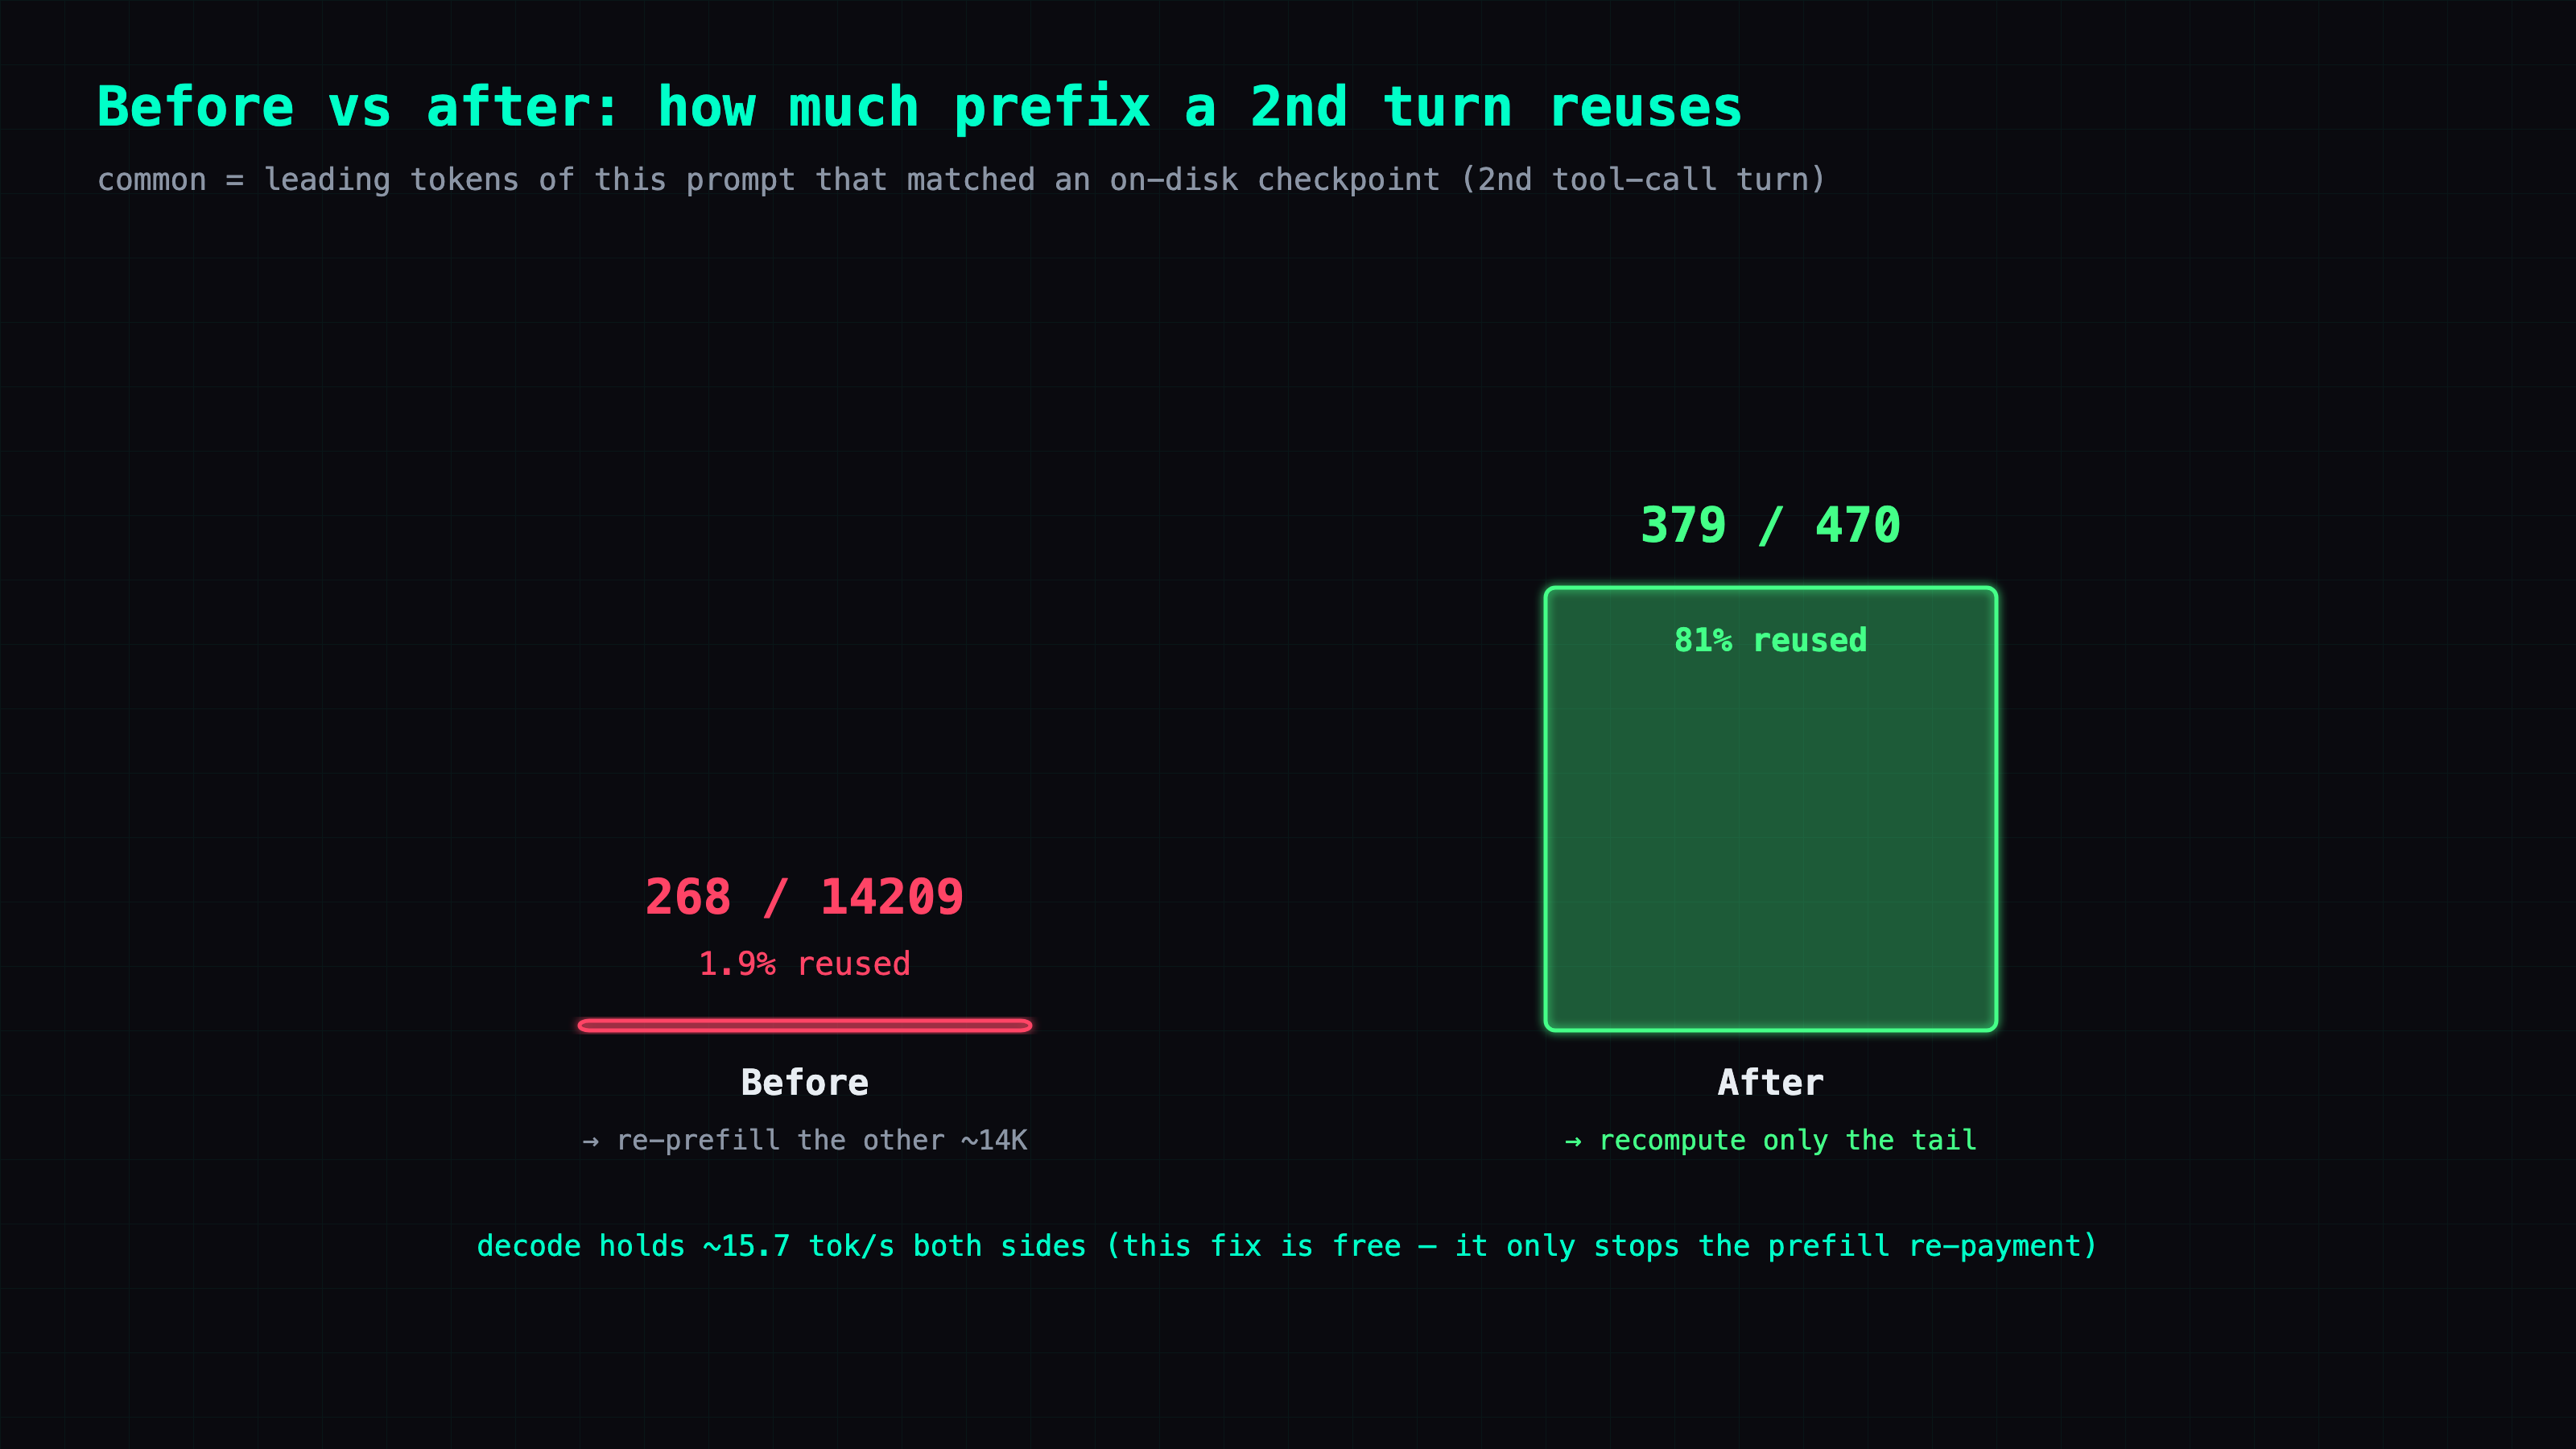
common= is how many leading tokens of this prompt matched an on-disk checkpoint. 268 out of 14209 — 1.9% reuse. The conversation had barely changed since the last turn, so this should have matched almost the entire prefix. Instead it matched a couple hundred tokens and re-prefilled ~14K from scratch. reason=token-mismatch says the on-disk checkpoint diverged from the live conversation almost immediately.
Root cause: tool-call turns never saved a checkpoint
The evict storm was the easy half — the budget was full, raise it. The common=268 collapse took longer, because on paper the conversation was continuous; there was no reason the prefix shouldn't match.
The reason is where in the turn the checkpoint gets saved. ds4 writes a "live checkpoint" of the computed prefix at the end of a turn so the next turn can resume from it. But there was a gap: turns that finished by calling a tool didn't save that checkpoint. And an agent's turns almost always end with a tool call — read a file, run a command, hit an API, over and over. (In Part 8's log dig I found real user turns carrying 2–13 tool round-trips, sometimes as many as 39.) So the more agentic the workload, the more of the conversation lived in tool-call turns that left no checkpoint behind — and the next turn had nothing recent to resume from, collapsing common= to whatever the last non-tool turn had saved.
That's exactly what PR #489 ("Server: fix agent-loop cache misses…", by elkaix) fixes. The specific commit is titled "Remember a visible live checkpoint for chat/Anthropic tool-call turns" — it makes tool-call turns save the checkpoint they'd been skipping. This is why Part 2's one-day sample looked fine and a month of heavier tool use didn't: light use hits enough plain turns to keep the prefix warm; heavy agentic use starves it.
This is also a nice case of the two failure modes compounding. The evict storm meant good prefixes got thrown out; the checkpoint gap meant good prefixes barely got written in the first place. Either one alone degrades the hit rate; together they took it to near zero.
The fix: 256G KV budget + the PR #489 binary
Two changes, two ~2.5-minute restart windows.
P1 — give the cache room, on the running binary:
# was 131072 (128G) — full, thrashing
--kv-disk-space-mb 262144        # 256G; the NVMe had 384G free
DS4_CUDA_KEEP_MODEL_PAGES=1       # kept, but see below — it's a no-op here
The disk budget going from 128G to 256G is the whole fix for the evict storm: with headroom, a written prefix survives long enough to be hit instead of being evicted on the next write.
DS4_CUDA_KEEP_MODEL_PAGES=1 is here for transparency, not speed. I A/B'd it and got ±2% — a no-op on a GB10, because its unified memory keeps the expert weights resident anyway; there are no model pages getting paged out that this would pin. I left it on because it's harmless, but on this hardware it does nothing. (It would matter on a discrete-GPU box.)
I also kept context at 256K, not higher. 384K is the threshold for ds4's "Think Max" mode, but at 384K the KV buffer leaves the box with ~10G of RAM headroom — too tight to co-run anything. 256K is the conservative daily setting.
P2 — swap the live binary to PR #489:
# built in an isolated worktree, zero warnings:
make cuda-spark -j4 CUDA_HOME=/usr/local/cuda-13.2
# live binary now: ~/ds4-pr489/ds4-server
I built #489 in a separate worktree so the daily binary was never at risk, then pointed ~/start_ds4.sh at it. The old binary stays one line away for rollback (ds4-server-main-80ebbc3.bak).
Verification: a second tool-call turn now reuses 81% of its prefix
The point of a fix like this is that you can prove it with a test where the broken and fixed versions produce visibly different numbers. Here the discriminator is common= on the second turn of a multi-tool exchange: broken, it collapses to a few hundred; fixed, it should be most of the prefix.
| Signal | Before | After |
|---|---|---|
common= on a 2nd tool-call turn | 268 / 14209 (1.9%) | 379 / 470 (81%) |
disk-cache-full hits=0 evictions | recurring storm | 0 |
| decode (short test) | ~15.7 tok/s | ~15.7 tok/s (no regression) |
The evict storm stopped, and the checkpoint gap closed — the second tool-call turn now resumes from where the first left off instead of re-reading the conversation. Decode didn't regress, which is the point: this fix costs nothing on the decode side, it just stops the re-prefill.
One honest caveat: this table is the discriminating A/B — it proves the mechanism is fixed. What I'm still watching is real production traffic (my agent "hikari" runs on this box): whether its everyday common= climbs from the low hundreds to near-full-prefix across a real day's conversations, which is where the 80s→seconds wall-clock win would actually show up. The mechanism is confirmed; the full-day payoff is the thing I'm still logging.
Decode speed is fixed — prefill is the only lever left
It would be easy to read this post as "and then it was fast." It wasn't, and it's worth being precise about why.
Decode on my real ~14K-context traffic measures ~13.7 tok/s, and I've confirmed no server flag moves it. That's not a tuning failure — it's the memory-bandwidth ceiling for an 81GB Q2 model on a 128GB GB10. Every token of decode has to stream the active weights out of unified memory, and that bandwidth is fixed. You cannot flag your way past physics.
So the only lever left is prefill: the tens-of-seconds cost of reading the conversation before the first token. You can't tune decode, but you can refuse to re-pay prefill. That's the entire reason a working disk-KV cache is worth more than any decode tuning on this box — and the entire reason its silent failure hurt so much. The fix didn't make the model faster. It stopped making me pay for the same 14K tokens on every single turn.
Takeaways
Where the time went
Not in the fix — the fix is two settings and a binary swap. It went into trusting a Part-2 measurement that had aged out. "48% of replies finish in 5–15s" was true for one day of light use; it quietly stopped being true as the workload got more agentic and the disk budget filled. The lesson is that a cache's hit rate is not a property you measure once — it's a property that decays with usage, and the decay is silent until you go read the eviction log.
Reusable diagnostics
common= versus prompt= in the cache-miss log is the single number that tells you whether a prefix cache is actually working. A continuing conversation should show common= near the full prompt length; if it's a few hundred against a five-figure prompt, your cache is writing but not hitting, and you should go find out why — a full disk budget and un-checkpointed turn types are the two usual suspects. And hits=0 on an eviction line is the specific fingerprint of a thrashing cache: it's evicting things nobody ever used, which means it's too small, not too cold.
The general principle
On a bandwidth-bound local model, decode is a constant you can't tune and prefill is a cost you can refuse to re-pay. Every hour I've spent making DeepSeek-V4-Flash feel fast has been spent on the second half of that sentence, never the first. The disk-KV cache is the whole game; keeping it actually hitting is the maintenance nobody warns you about.
Conclusion: the checklist
- Watch
common=vsprompt=in the cache-miss log. Near-full on a continuing conversation = healthy. A few hundred against 14K = your cache isn't hitting. disk-cache-full hits=0means the budget is too small and the cache is thrashing. Raise--kv-disk-space-mbuntil written prefixes survive to be reused (128G → 256G here).- Tool-call turns need to checkpoint. If your ds4 predates PR #489, agent workloads silently starve the prefix cache; build the fix in an isolated worktree and swap the binary.
- Don't chase decode. ~14 tok/s is the GB10 bandwidth wall for this model; no flag moves it. Spend the effort on prefill reuse instead.
- Verify with a discriminating test, not a vibe.
common=on a second tool-call turn goes from a few hundred to most of the prefix — that number can't lie the way "feels faster" can.
Also in this series: Part 1 — Running a 284B on a 128GB box, then blaming the wrong thing for broken tool calls · Part 2 — Running a 15 tok/s 284B as your daily agent brain: the settings that make it bearable · Part 3 — Weights win: a 284B crushed to 2-bit still beats the small model that fits
FAQ
- Why did my ds4 agent get slow again after weeks of running fine?
- Two failure modes compounded. First, the KV disk cache budget (128G) filled up, so it evicted prefix checkpoints before they were ever reused — the log shows `reason=disk-cache-full hits=0`. Second, tool-call turns never saved a live checkpoint, so a 14K-token conversation only matched a few hundred tokens on the next turn (`common=268`) and re-paid the entire prefill. Raising the disk budget to 256G and switching to the PR #489 binary fixed both.
- What does `common=268` mean in a ds4 KV cache miss log?
- It's how many leading tokens of the current prompt matched an on-disk prefix checkpoint. `prompt=14209 common=268` means only 268 of 14209 tokens were reused — the other ~14K got re-prefilled from scratch, which on a GB10 is tens of seconds of pure wait before the model says anything. Healthy reuse on a continuing conversation should be most of the prefix; after the fix a second tool-call turn hit common=379/470 (81%).
- Can you make DeepSeek-V4-Flash decode faster than ~14 tok/s on a GB10 with flags?
- No. Decode on my real 14K-context traffic sits at ~13.7 tok/s, and I confirmed no server flag moves it — it's the memory-bandwidth ceiling for an 81GB Q2 model on a 128GB GB10. The only lever left is prefill: don't re-pay it. That's why the disk-KV cache working correctly matters more than any decode tuning.
- Does DS4_CUDA_KEEP_MODEL_PAGES speed up ds4 on a DGX Spark?
- Not on a GB10. I A/B'd it and saw ±2% — a no-op, because the GB10's unified memory keeps the expert weights resident anyway, so there are no model pages to pin that weren't already there. I left it on because it's harmless, but it's not a speedup on this hardware. It would matter on a discrete-GPU box where weights can get paged out.
Read next
- 2026-06-12[Local LLM] Running a 15 tok/s 284B as your daily agent brain — the settings that make it bearable
A 284B model at 15 tok/s, wired into a daily agent. Two sets of settings make it comfortable — server-side and agent-framework-side. --no-mmap cuts cold start to 57s, the KV disk cache halves prefill, and one missing context_length will crash the whole session.
- 2026-06-12[Local LLM] Weights win: a 284B crushed to 2-bit still beats the small model that fits
DeepSeek-V4-Flash (284B) only fits a 128GB box at asymmetric Q2 (~80GB). Sounds like suicide quantization — but it's surgical: only the layers that barely affect quality get cut. As a daily agent it ran 280 turns with zero degradation. Big enough weights survive 2-bit.
- 2026-06-12[Local LLM] My first Q2 model looked broken on a 128GB box — the real culprit was a parser that couldn't read DSML, not the quantization
DeepSeek-V4-Flash is 284B. I got it onto a single 128GB GB10 with antirez's ds4 engine and an asymmetric Q2 GGUF at 15.6 tok/s. The fun part: the broken tool calls weren't the 2-bit quant's fault. The runtime just couldn't parse DSML.
- 2026-06-26[Just for Fun — Advanced] llama.cpp won't persist KV cache to disk — so I put a 60-line proxy in front of it (7× faster restore)
On a long conversation, every message makes the model re-read the whole thing (re-prefill) before it answers — worst right after a restart or a cache eviction. Stock llama.cpp can save the KV cache to disk (--slot-save-path) but won't do it on its own — the auto-persist feature request is closed as not planned. A tiny stdlib reverse-proxy restores instead of re-prefilling: 9.9s → 1.4s on a 5K chat (7×). Mechanism, proxy design, and why I haven't shipped it yet.
Don't miss the next one
Subscribe, and you won't.
One-click unsubscribe anytime.