DeepSeek-V4-Flash on DGX Spark · part 11
[DeepSeek-V4-Flash] A frontier-class open model on hardware you own: running DeepSeek-V4-Flash-0731 on a DGX Spark
❯ cat --toc
- Introduction
- Unified memory deletes the decision, not just the work
- My own mess: two CUDA toolkits, and I only named one of them
- Is the GGUF broken, or does llama.cpp not support 0731 yet?
- The build that works, and the one line that fixes it
- Download: identical to the 2080 Ti article
- The systemd unit, and why each flag is there
- Why I run 256K when the model supports 1M
- Three curls that confirm what actually loaded
- DGX Spark vs one modded 2080 Ti: 7% apart
- One decision, and it happens before the model ever runs
TL;DR
DeepSeek-V4-Flash-0731 runs on a DGX Spark at 17.5-17.9 tok/s with a 256K context, and the setup is short: GB10's 121 GiB is one unified pool shared by CPU and GPU, so there is no VRAM/RAM split to compute and -ncmoe never appears. You answer one question instead — do 91GB of weights plus the KV cache fit in 121 GiB — and they do, at 94,252 MiB resident. Running the identical GGUF on the same llama.cpp commit, the purpose-built box is 7% faster than one second-hand 2080 Ti. Caveat: that comparison is two real deployments, not a controlled A/B.

Introduction
When you move into a bigger house, the win isn't that you carry fewer boxes. It's that you stop standing in the hallway deciding what goes in the attic. Everything fits, so you don't sort.
That is the difference between the previous article in this series and this one. The junk-tier version ran the same 91GB model on a single 22GB card, and almost all of its length went to one dividing line: which weights stay on the GPU and which get pushed out to system RAM. On a DGX Spark that line does not exist, and the article gets shorter.
What's left is a build trap that cost me three hours — and I should say up front that it was my own mess, not something a DGX Spark does to you. This box has quietly accumulated two CUDA toolkits over the months. If yours has exactly one, congratulations, skip that section. I wish past me had been that tidy. Everything below was measured on my own DGX Spark: same model, same GGUF, same llama.cpp commit as the 2080 Ti article.
Unified memory deletes the decision, not just the work
On a discrete GPU, VRAM and system RAM are two separate pools with PCIe between them. That physical fact is what creates the whole -ncmoe / --n-cpu-moe family of flags: you have to decide which weights are worth the fast pool, sweep values, and find the boundary where it stops fitting.
GB10 is unified memory. CPU and GPU share one 121 GiB pool. There is no "move it across" step, because there is no across.
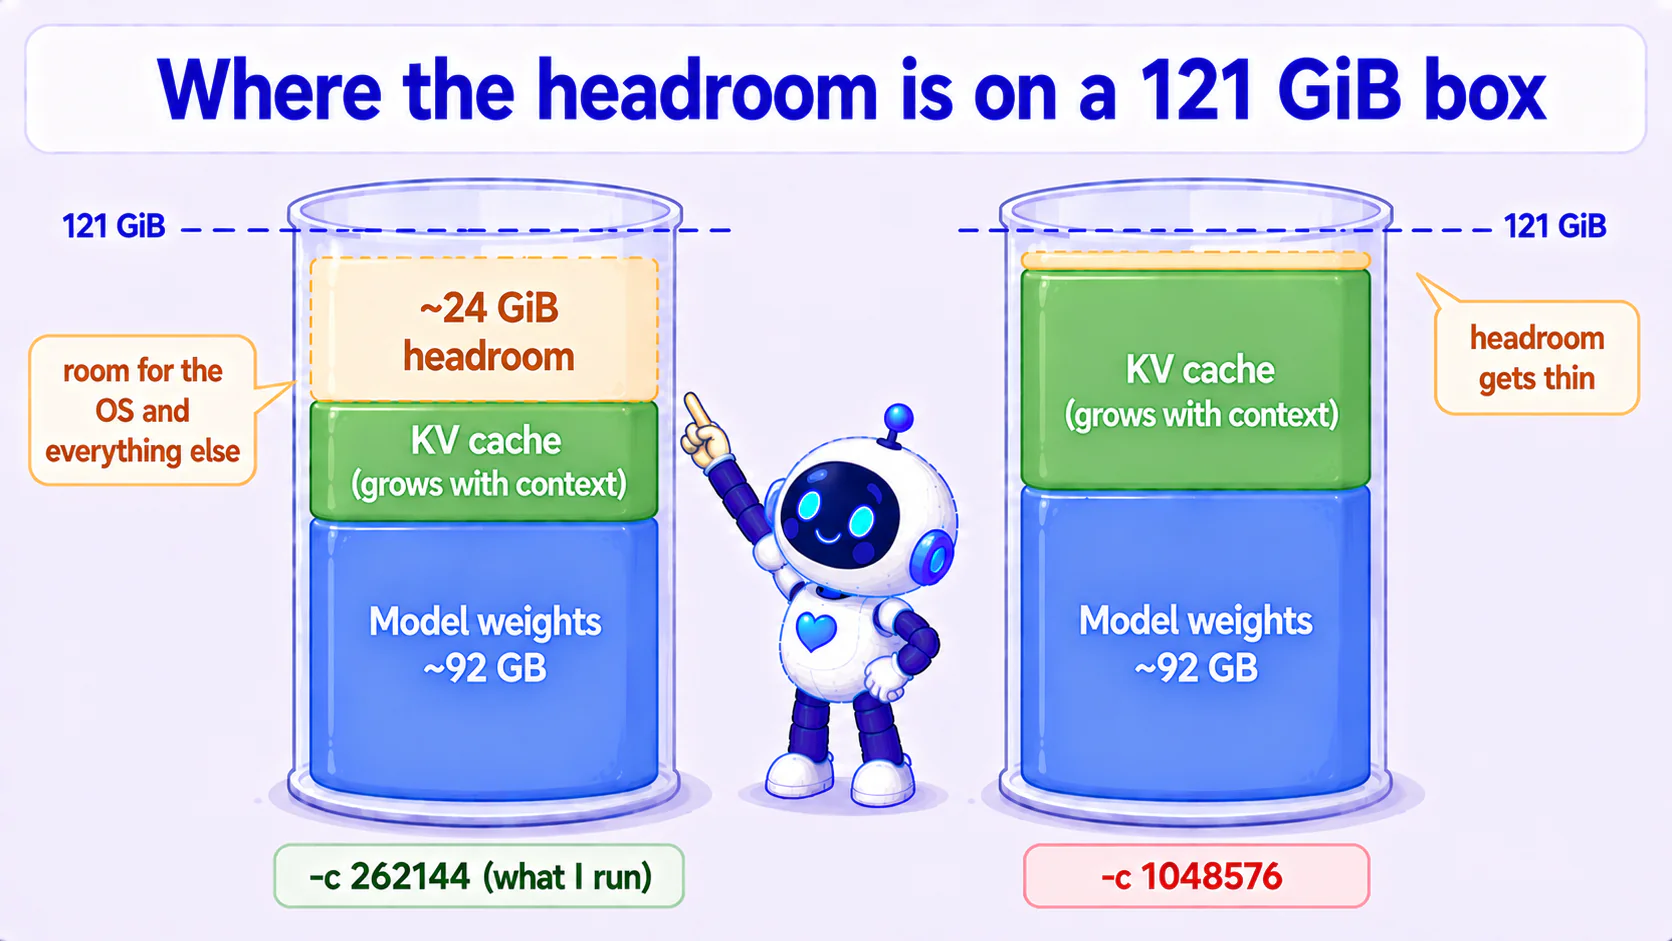
So the sweep disappears and one question replaces it: do 91GB of weights, plus the KV cache, plus the compute buffers fit in 121 GiB? They do. Measured process footprint after load is 94,252 MiB, leaving roughly 24 GiB for the operating system and everything else on the box.
The previous article derived a formula, (VRAM − 11) ÷ 2, for how many layers of experts a card can hold. On this machine that formula has no job. That is the point of the machine.
My own mess: two CUDA toolkits, and I only named one of them
This box has picked up two CUDA installs over the months, and the default PATH points at the older one.
which -a nvcc
# /usr/bin/nvcc
nvcc --version | tail -2
# Cuda compilation tools, release 12.0, V12.0.140

ls -d /usr/local/cuda*
# /usr/local/cuda  /usr/local/cuda-13  /usr/local/cuda-13.2
/usr/local/cuda/bin/nvcc --version | tail -2
# Cuda compilation tools, release 13.2, V13.2.78
I saw that, pointed CMake at the newer compiler, and considered the problem handled.
cmake -B build -DGGML_CUDA=ON \
      -DCMAKE_CUDA_ARCHITECTURES=121 \
      -DCMAKE_CUDA_COMPILER=/usr/local/cuda-13.2/bin/nvcc   # ← compiler only
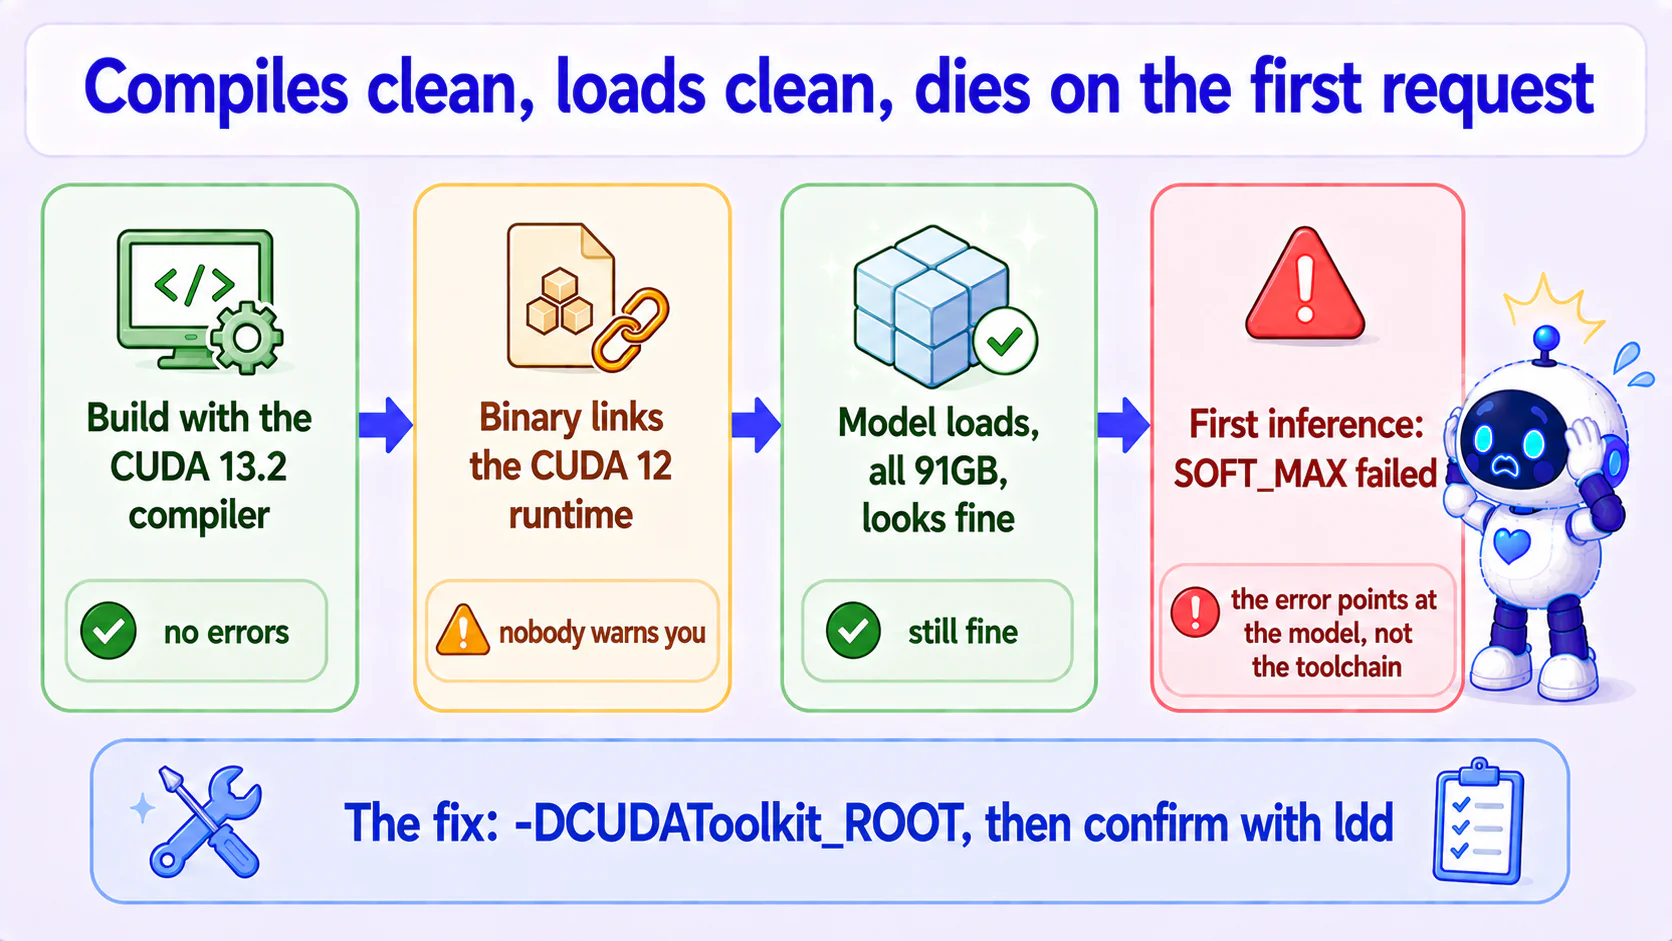
It compiled with zero errors. The model loaded. The first request killed it.
Is the GGUF broken, or does llama.cpp not support 0731 yet?
That was my actual question for the next three hours, and both halves of it were wrong. Here is what the server printed:
/home/coolthor/llama.cpp-0801/ggml/src/ggml-cuda/ggml-cuda.cu:106: CUDA error
ggml_cuda_compute_forward: SOFT_MAX failed
CUDA error: invalid argument
  current device: 0, in function ggml_cuda_compute_forward at ggml-cuda.cu:2374
SOFT_MAX failed with invalid argument reads like a model problem or a parameter problem. A specific operator, a bad argument. I suspected the GGUF file first, then the context length, then incomplete llama.cpp support for the new 0731 architecture. None of those was it.
What identified the culprit was the file path in the stack trace, not the message:
#3 ggml_cuda_error(...) from /home/coolthor/llama.cpp-0801/build/bin/libggml-cuda.so.0
And then what that .so was actually linked against:
ldd build/bin/libggml-cuda.so | grep -E 'cudart|cublas'
# libcudart.so.12 => /lib/aarch64-linux-gnu/libcudart.so.12     ← 12!
Built by the 13.2 compiler, running against the 12 runtime. CMake used the compiler I named, then went looking for runtime libraries on its own, found the system directory first, and linked the old ones.
That also explains the shape of the failure. Loading a model only allocates memory and moves weights around, and those APIs are compatible between the two versions, so the mismatch stays invisible through the entire seven-minute load. It's when execution reaches the kernels that the newer compiler's expectations stop matching the older runtime, and it breaks on the first SOFT_MAX it hits. The symptom surfaces about as far from the cause as it can get, which is exactly why it's hard to recognise.
The build that works, and the one line that fixes it
git clone https://github.com/ggml-org/llama.cpp ~/llama.cpp-0801
cd ~/llama.cpp-0801
git checkout b10217          # the tag I used, commit ddd4ec1

cmake -B build-cuda132-sm121 -DGGML_CUDA=ON \
      -DCMAKE_CUDA_ARCHITECTURES=121 \
      -DCMAKE_CUDA_COMPILER=/usr/local/cuda-13.2/bin/nvcc \
      -DCUDAToolkit_ROOT=/usr/local/cuda-13.2 \
      -DCMAKE_BUILD_TYPE=Release
cmake --build build-cuda132-sm121 --config Release -j$(nproc)
-DCUDAToolkit_ROOT is the one added line. It tells CMake where to find the runtime, instead of letting it guess.
CMAKE_CUDA_ARCHITECTURES=121 is GB10's compute capability, sm_121. It is not the same as consumer cards, so don't copy an 86 or an 89 out of someone else's guide.
Now verify, before you run anything:
ldd build-cuda132-sm121/bin/libggml-cuda.so | grep -E 'cudart|cublas'
# libcudart.so.13   => /usr/local/cuda/targets/sbsa-linux/lib/libcudart.so.13
# libcublas.so.13   => /usr/local/cuda/targets/sbsa-linux/lib/libcublas.so.13
# libcublasLt.so.13 => /usr/local/cuda/targets/sbsa-linux/lib/libcublasLt.so.13
.so.13, under /usr/local/cuda. That single ldd line is worth three hours, because the other path's error message never sends you here.
Compiling cleanly proves nothing about version consistency. Loading successfully proves nothing either.
lddis the only thing that does.
Download: identical to the 2080 Ti article
Same repo, same quantization, nothing machine-specific about it. The junk-tier version of this guide covers the details, including why the 0731 release ships no Jinja chat template.
export HF_HUB_ENABLE_HF_TRANSFER=1
hf download unsloth/DeepSeek-V4-Flash-0731-GGUF \
  --include "UD-Q2_K_XL/*" \
  --local-dir ~/models/ds4-0731-ud-q2-k-xl
Three shards, 91GB total. The first shard is only 5MB and reports n_tensors = 0. That is normal, not a truncated download. Point -m at that file and llama.cpp finds the rest.
The systemd unit, and why each flag is there
# ~/.config/systemd/user/llama-ds4-0731-8000.service
[Unit]
Description=DeepSeek V4 Flash 0731 via llama.cpp on port 8000
After=network-online.target
Wants=network-online.target

[Service]
Type=simple
WorkingDirectory=/home/coolthor/llama.cpp-0801
ExecStart=/home/coolthor/llama.cpp-0801/build-cuda132-sm121/bin/llama-server \
  -m /home/coolthor/models/ds4-0731-ud-q2-k-xl/UD-Q2_K_XL/DeepSeek-V4-Flash-0731-UD-Q2_K_XL-00001-of-00003.gguf \
  -ngl all --fit off -c 262144 \
  -np 1 -ctxcp 2 -cram 2048 -b 1024 -ub 256 --no-warmup \
  --host 0.0.0.0 --port 8000 \
  --alias deepseek-v4-pro --reasoning-format deepseek
Restart=on-failure
RestartSec=10
TimeoutStopSec=180

[Install]
WantedBy=default.target
Four groups of flags are doing real work here.
-np 1 -ctxcp 2 -cram 2048 bound llama-server's own caches. By default it opens several slots, keeps 32 context checkpoints, and lets the prompt cache grow to 8GB. On an ordinary machine that memory comes out of host RAM and nobody notices. On unified memory it competes with the model weights for the same 121 GiB. Left unbounded, one long prompt can push the whole box into OOM.
-b 1024 -ub 256 shrink the prefill compute buffer, for the same reason.
--fit off disables auto-fitting. With it on, llama.cpp picks values for the arguments you did not specify so everything fits; an explicit -c is left alone. Turning it off ensures that I chose every value used in the run.
-ngl all hands every layer to the GPU. On unified memory this isn't a transfer the way it is on a discrete card, but you still have to say it.
Why I run 256K when the model supports 1M
The model's trained maximum is 1,048,576. My production setting is 262,144.
1M does load. I tested it, cold start 416 seconds. But the 121 GiB is shared with the CPU, and a large KV cache thins out what's left for the OS and the other services on the box. At 256K there is about 24 GiB free after load, and that headroom is the reason I don't think about this machine at night.
One correction while I'm here. I originally took rope.scaling.factor = 16.0 together with original_context_length = 65536 as evidence that the long window was raw extrapolation with no training behind it. That was wrong — DeepSeek's technical report says V4's pretraining length was extended all the way to 1M. The remaining caveat is narrower: loading at that length tells you it runs, and I have not measured quality at long context.
Three curls that confirm what actually loaded
Cold start measured 406 seconds. /health returns 503 for that entire window, which is the correct answer, not a fault.
# 1. still loading vs ready
curl -s -o /dev/null -w "%{http_code}\n" http://localhost:8000/health
# 503 = still loading (wait, don't restart);  200 = ready

# 2. did anything quietly rewrite my parameters?
curl -s http://localhost:8000/props | python3 -m json.tool | grep -E 'n_ctx|build'
# n_ctx 262144 / build b1-ddd4ec1

# 3. which model actually loaded?
curl -s http://localhost:8000/v1/models | python3 -m json.tool | grep -E 'n_params|n_ctx_train'
# n_params 284334567511 / n_ctx_train 1048576
Do not restart on a 503. Restarting makes the box read 91GB off disk again and wait another seven minutes for the same answer.
Memory use needs a different command than you'd expect, because unified memory breaks the usual one:
nvidia-smi --query-compute-apps=pid,used_memory --format=csv,noheader
# 1142691, 94252 MiB
nvidia-smi --query-gpu=memory.used returns [N/A] on GB10. Query the compute apps instead.
DGX Spark vs one modded 2080 Ti: 7% apart
Same GGUF, same llama.cpp commit, same quantization, two machines that are both in daily use.
| DGX Spark (GB10) | One modded 2080 Ti 22G | |
|---|---|---|
| Memory | 121 GiB unified | 22GB VRAM + EPYC 7402 system RAM |
| Context in production | 262,144 | 1,048,576 |
| Decode | 17.5-17.9 tok/s | 16.4-16.5 tok/s |
| Split to configure | none | -ncmoe, computed per card |
About 7% apart. How you read that depends on what you thought you were buying.
If you want tokens per second, 7% does not justify the price gap, and the junk-tier build wins outright. What the DGX Spark actually buys is two other things. First, 121 GiB of room: the next model, the bigger one, still fits here, and the 22GB card may not take it. Second, nothing to split: the previous article spends a full section computing -ncmoe, and this one never mentions it outside of explaining why it's absent.
Be clear about the limits of this comparison. This is two real deployments compared, not a controlled hardware A/B. They run different context settings, 256K against 1M, although the previous article measured that this model's decode barely moves as context grows, so I believe the gap is real rather than an artifact of that difference. It is also a single workload, single stream, short inputs. A different workload profile could produce a different result.
One decision, and it happens before the model ever runs
On this machine there is really only one judgement call, and it's made at build time: pin the CUDA paths, then use ldd to confirm you linked what you think you linked. Unified memory takes care of the rest, which is why this guide is half the length of the one for the old graphics card.
The part of the trap worth carrying to your next project isn't "some boxes have two CUDA installs." It's the shape of it: compiles clean, loads clean, dies on the first inference, and the error names softmax. Next time you see "loads fine, crashes immediately with a CUDA error," run ldd before you start blaming the model.
Also in this series:
- #6 A 284B model fits in 128GB and stays fast at long context: it attacks the KV cache, not the parameter count
- #9 One idle question, half a generation of engine upgrade for free
- #10 That free engine upgrade came back for payment in OOM
- The junk-tier version: the same model squeezed onto one 22GB used GPU
FAQ
- llama.cpp compiled without errors and the model loads, but the first request dies with a CUDA error. What is wrong?
- Most likely your build links a different CUDA runtime than the one that compiled it. Loading only allocates memory and copies weights, and those calls are compatible across versions, so the mismatch stays invisible until execution reaches the kernels. Run `ldd build/bin/libggml-cuda.so | grep cudart` and check that the version matches your nvcc. If it doesn't, rebuild with `-DCUDAToolkit_ROOT` pointing at the same toolkit as `-DCMAKE_CUDA_COMPILER`.
- Do I need -ncmoe / --n-cpu-moe on a DGX Spark?
- No. That flag exists to split weights between VRAM and system RAM across PCIe. GB10 has one unified 121 GiB pool shared by CPU and GPU, so there is no boundary to place. The 91GB of weights plus KV cache plus compute buffers either fit in 121 GiB or they don't. Here they fit, with about 24 GiB to spare at 256K context.
- The model supports 1M tokens. Why run it at 256K?
- Two reasons. On unified memory the KV cache competes with the OS and every other process for the same pool, and 256K leaves about 24 GiB of headroom where 1M does not. I verified that 1M loads and runs, but I have not measured quality at that length.
- /health returns 503 for several minutes after startup. Should I restart the service?
- No. Cold start measured 406 seconds here because 91GB has to come off disk. 503 during that window is the expected response. Restarting only makes it read all 91GB again and wait another seven minutes.
Read next
- 2026-07-10[Local LLM] How to tell if a hyped LLM optimization is real on your hardware: read the source, find the ceiling, run one experiment
Most hyped LLM optimizations don't survive contact with your own model and hardware. Three cheap checks — read the source, find the true ceiling, run one discriminating experiment — that tell you which are real, anchored in the FlashMemory investigation on DeepSeek-V4-Flash.
- 2026-07-09[Local LLM] FlashMemory can't improve DeepSeek-V4-Flash's own lightning indexer — I retrained it on my exact Q2 and it still lost
V4-Flash already ships a native lightning indexer tracking true attention at 93–96%. FlashMemory pre-filters candidate chunks, but it makes near-random selections on my Q2 and reaches only 89–92% when retrained — still a NO-GO on GB10.
- 2026-07-07[Local LLM] Why a 284B fits a 128GB GB10 at long context: DeepSeek-V4-Flash attacks the KV cache, not the parameter count
DeepSeek-V4-Flash is a 284B MoE that stays fast at long context on a 128GB GB10 because its hybrid CSA/HCA attention and lightning indexer shrink the KV cache to ~871MiB at 64K and read only a few hundred compressed rows per step. What I found reading ds4's code and DeepSeek's V4 paper.
- 2026-07-06[Local LLM] Depth-1 MTP on V4-Flash: +9% on agent turns, −4% on prose — route speculative decode by workload
Depth-1 MTP speculative decode on DeepSeek-V4-Flash is lossless but workload-dependent on a GB10: +9.4% on agent turns and +6.5% on code, −3.6% on prose and −3.7% on Chinese chat. The sign follows the acceptance rate because decode here is verify-bound (108ms verify vs 4ms draft). It's not a global faster switch — route it by workload.
Don't miss the next one
Subscribe, and you won't.
One-click unsubscribe anytime.